Socialinė teorija, empirija, politika ir praktika eISSN 2345-0266
2020, vol. 21, pp. 96–109 DOI: https://doi.org/10.15388/STEPP.2020.25
The Benefit non-take-up in the Context of Cash Social Assistance Reform in Lithuania
Vitalija Gabnytė
Vilnius University, Faculty of Economics and Busines Administration
E-mail: vitalija.gabnyte@evaf.vu.lt
Tautvydas Vencius
Lithuanian Social Research Centre
E-mail: tautvydas.vencius57@gmail.com
Jekaterina Navickė
Vilnius University, Faculty of Philosophy
E-mail: jekaterina.navicke@fsf.vu.lt
Abstract. The purpose of this article is to present the results of cash social assistance (CSA) benefit non-take-up in the context of the CSA system reform in Lithuania. The right to adequate minimum income benefits is one of the 20 key principles under the European Pillar of Social Rights (EPSR). Using the tax-benefit microsimulation model EUROMOD we seek to identify all those eligible to CSA benefit and to analyse its non-take-up rates in Lithuania. The analysis for 2016 showed that CSA benefit non-take-up in Lithuania was around 22%. This means that around one fifth of those who are entitled to this benefit do not get it for various reasons. The results show that there are two types of households, with a non-take-up rate exceeding 30%: single person and lone parent households. The dynamics of CSA benefit non-take-up between 2007-2016 were strongly negatively correlated to the annual average number of recipients of the CSA benefit. This makes for a counter-cyclical dynamic of the CSA non-take-up relative to the economic growth cycle. We find some evidence of an increase in the CSA non-take-up rate following the recent CSA reform in Lithuania. Further analysis is needed to distinguish between the effects of the economic cycle and the CSA reform.
Keywords: Social assistance, benefit non-take-up, Lithuania
Piniginės socialinės paramos išmokų nepaėmimas piniginės socialinės paramos sistemos reformos kontekste
Santrauka. Straipsnio tikslas yra pristatyti piniginės socialinės paramos išmokų nepaėmimo mastų skaičiavimus Lietuvai, atsižvelgiant į piniginės socialinės paramos sistemos reformą. Teisė į adekvačias minimalių pajamų išmokas yra vienas iš 20 principų, įtvirtintų Socialinių teisių ramstyje. Naudojant mokesčių-išmokų mikrosimuliacinį modelį EUROMOD buvo siekiama identifikuoti visus teisę į piniginę socialinę paramą turinčius žmones ir išsiaiškinti, koks galėtų būti išmokų nepaėmimo mastas Lietuvoje. Rezultatai 2016 m. parodė, kad Lietuvoje išmokų nepaėmimas buvo apie 22 proc. Taip pat buvo identifikuoti du namų ūkių tipai, kuriuose piniginės socialinės paramos išmokos nepaėmimo mastas viršija 30%: vieniši asmenys bei vieniši tėvai. Pastebėta, kad piniginės socialinės paramos išmokų nepaėmimo dinamika 2007–2016 m. laikotarpiu neigiamai koreliuoja su vidutiniu metiniu piniginės socialinės paramos išmokų gavėjų skaičiumi. Tai rodo, kad piniginės socialinės paramos išmokų nepaėmimas pasižymi anticikliškumu lyginant su ekonomikos augimo ciklu. Mes patvirtiname prielaidą, jog išmokų nepaėmimo lygis Lietuvoje didėjo po pastarosios piniginės socialinės paramos sistemos reformos. Visgi, reikalinga detalesnė analizė siekiant atskirti ekonominio ciklo ir socialinės paramos reformos poveikį piniginės socialinės paramos nepaėmimui.
Pagrindiniai žodžiai: Piniginė socialinė parama, išmokų nepaėmimas, Lietuva
Received: 2020-08-24. Accepted: 2020-02-21
Copyright © 2020 Vitalija Gabnytė, Tautvydas Vencius, Jekaterina Navickė. Published by Vilnius University Press. This is an Open Access article distributed under the terms of the Creative Commons Attribution Licence, which permits unrestricted use, distribution, and reproduction in any medium, provided the original author and source are credited.
Introduction
The right to adequate minimum income benefits is one of the 20 key principles under the European Pillar of Social Rights (EPSR), launched in 2017, to support fair and well-functioning labour markets and welfare systems in Member States. Specifically, Principle 14 states that “[e]veryone lacking sufficient resources has the right to adequate minimum income benefits ensuring a life in dignity at all stages of life, and effective access to enabling goods and services” (European Commission, 2017). However, many people do not receive the social benefits to which they are entitled, and this is the common issue across the EU (Eurofound, 2015).
Non-take-up of social benefits is problematic and may cause short- and long-term social and economic costs through a number of channels, e.g.: by distorting the intended welfare impact on poverty and social inclusion; by contributing to indebtedness and precarious financial circumstances, health problems or reduced equal opportunities for children; by causing unjustified disparities among eligible clients; and by reducing the capacity to anticipate both social outcomes and financial costs of policy reforms (Fuchs et al., 2019).
In order to ameliorate social protection policies in Lithuania and improve the effectiveness of the CSA, as well as to ensure better use of public funds, a reform of the CSA system was envisaged in 2011 and launched in 2012 with a primary aim of stirring motivation among the working-age population to integrate into the labour market and reduce long-term welfare dependency, risks of poverty traps, and CSA abuse by providing assistance to those who need it the most.
Lithuania in February 2019 held a Peer Review on “Ensuring adequate assistance for those most in need (Minimum Income)”. The Peer Review underlined some of the positive aspects of the Lithuania CSA decentralization reform which included the close collaboration of various local level stakeholders, including social workers, and the active involvement of local community members in the decision-making process. Although, as it was pointed out, the risk that the larger discretionary power of municipalities, if not exercised carefully, may lead to larger non-take-up of CSA benefits.
Benefit non-take-up is a widespread problem, unfortunately, there are no calculations or studies on this topic in Lithuania. Navicke (2015) in her doctoral dissertation analysed the coverage of the social assistance by those who need assistance (people below the poverty line of 60% median and reporting “big difficulty” on making ends meet (self-employed people were excluded) in Lithuania). The results showed that based on 2013 Survey of Income and Living Conditions (thereafter SILC) data, only 57% of those in need of social assistance received it.
The purpose of this article is to analyse non-take-up of cash social assistance (thereafter CSA) in the context of the recent CSA reform in Lithuania.
There are different ways to identify benefit non-take-up. One way is to use administrative data and identify those who are eligible for the benefit (Bargain et al. (2012), Vinck et al. (2019)). Another possible way is to use microsimulation to establish non-take-up rates of various benefits and for particular groups (Bargain et al. (2012), Herber and Kalinowski (2019)). To do this, the EU tax-benefit microsimulation model EUROMOD can be used (Matsaganis et al. (2010), Tasseva (2016), Fuchs et al. (2019)). In this paper we discuss the different methods for estimating benefit non-take-up and the arguments for using microsimulation approach. This article goes as follows: first we present the CSA reform in Lithuania and its implications for benefit non-take-up. Second, we discuss different ways for evaluating benefit non-take-up, including tax-benefit microsimulation using EUROMOD. Third, the method used for estimating benefit non-take-up in this paper is presented. Finally, using EUROMOD and SILC data, we identify those eligible to CSA benefit and analyse what are the CSA benefit non-take-up rates in Lithuania. Estimates are made and presented in the general population and in the selected 5 household types: single persons, lone parents, 2 adults without children, 2 adults with 1-2 children and 2 adults with 3 and more children. For the CSA benefit non-take-up, data for the period of 2007-2016 is analysed, covering the pre-economic crisis, economic crisis and recovery. This timeframe also covers the period of CSA reform in Lithuania. We use the latest data for performing decomposition of the non-take-up rate by household type.
Finally, it is worth to mention that, since the reform of the CSA system, all municipalities provide CSA for poor residents under equal conditions (Law on Cash Social Assistance for Poor Residents, 2020), but discretion of municipalities in sphere of CSA provision was extended (e.g. they can grant social benefits also in cases when the income of the household is above the amount of the state supported income). Further, they have full discretion when it comes to awarding additional benefits (e.g. paying of housing debts, lump-sum benefits etc.) and monitoring CSA recipients. The territory factor is important for the benefit non-take-up, but due to data limitations we are unable to analyse this at the municipality level, so the SILC data is not representative at the municipal level.
Reform of the CSA system in Lithuania
The CSA reform covered the period from 2012 to 2015. Its main elements: the transfer of independent responsibility for CSA provision to the municipalities and the introduction of measures promoting labour market (re)integration among working-age CSA recipients. The autonomous function on CSA has been transferred to the municipalities due to the fact that at a lower regional level it is possible to better target social assistance and to identify persons who are eligible or ineligible for this benefit.
In 2012, the principles of the CSA reform were first implemented in five municipalities and, after the assessment of the results, extended to all municipalities in 2015. Statistical indicators provided by the municipalities suggest that the implementation of the CSA reform led to a considerable reduction in the number of CSA recipients, an increase in the level of CSA benefits, better targeting of CSA, growing possibilities to provide more and varied social services at the local level, and more active inter-agency collaboration. Particular attention should be drawn to gradually increasing (financial) incentives for CSA recipients to (re)enter the labour market through employment or temporary economic activities and thus abstain from the shadow labour market.
Since the CSA reform implementation, there was a considerable decline in the number of CSA recipients (see Figure 1). The number of social benefit recipients decreased three times, from 221 900 to 74 500, or by more than 66%, from 2012 to 2017, and the expenditure for social benefit decreased accordingly. In addition, the number of recipients in the case of compensations for heating, hot and drinking water decreased by more than 50% from 198 800 thousand in 2012 to 97 300 thousand in 2017. In addition to this, expenditure for compensations for heating, hot and drinking water expenses decreased by almost 68% (Ministry of Social Security and Labour, 2020a).
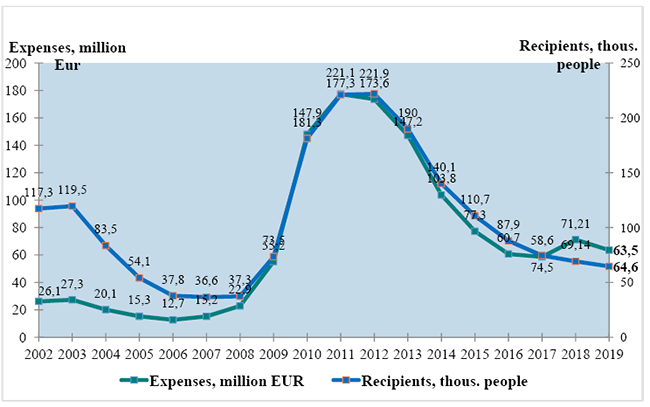
Figure 1. Annual average number of recipients (thous.) and expenditure (million euro for social benefits in Lithuania in 2002–2019*
Source: Ministry of Social Security and Labour, 2020a
*Note: before the economic crisis period (2006-2008), the annual average number of CSA recipients was around 1.1-1.2% of the total population; during the economic crisis period (2009-2012), the share was more than 7%; in 2016, after the implementation of the CSA system reform, it was around 3% of the total population, and the share of CSA recipients is still decreasing.
Of course, the number of CSA recipients was declining during the economic recovery and due to decreasing unemployment levels. However, it is noteworthy that because of the changes made during the reform a lot of people may have decided not to seek support due to stricter regulation. Another issue for the drastic decline of the CSA recipients may be due to the municipalities’ aim to save money from cash social assistance and to increase available funds for other social needs. The municipalities have no obligation to repay unused funds for the cash social assistance to the state budget. Since 2018, municipal budget funds which were not used for calculation and payment of cash social assistance must be used by the municipalities only for other social purposes, like the implementation of social rehabilitation and integration measures for persons (families) at social risk; development of family and community support to children, disabled, elderly and their families; financial support to reduce poverty and social exclusion; prevention of violence, suicide, addiction, trafficking; social integration of the disabled; development of communities and non-governmental organizations and the implementation of their social programs; implementation of employment promotion programs; municipal and social housing fund development, reconstruction and repair; financing social services measures as well as modernising and implementing their infrastructure; improving social services workers work conditions and increasing their wages; increasing the wages of social benefit specialists working in the municipal administration. The Ministry of Social Security and Labour, which is carrying out the monitoring of the implementation of the Law on cash social assistance for poor residents, is conducting an analysis of the use of funds that were not used for CSA.
The reform of the CSA system in Lithuania may have a twofold foreseeable effect on the coverage of CSA. On the one hand, tighter control of the CSA benefit recipients may lead to higher non-take-up rates. On the other hand, due to a stricter control mechanism, there should be a lower benefit leakage to those non-eligible.
Ways for estimating benefit non-take-up
There are various ways to identify benefit non-take-up (for a review see e.g. Ministry of Social Security and Labour (2020b)). Some authors use administrative data and microsimulations (Bargain et al. (2012)). Others mix different methods like, quantitative data (administrative data) analysis and qualitative analysis (Vinck et al. (2019)), while other use survey data and microsimulations to identify eligibility for particular benefits (Herber and Kalinowski (2019)).
According to Fuchs et al. (2019) the size of non-take-up was estimated by comparing proportions of households that potentially fulfil the entitlement criteria with proportions of actually benefit-receiving households (whether entitled or non-entitled) as well as the related expenditures. This method is, however, not common. Bargain et al. (2012) distinguishes two other possible benefit non-take-up estimations. The first approach identifies non-take-up of benefits as a share of eligible non-receivers to the total number of eligible people. The second approach is to estimate a share of eligible non-receivers to the sum of total number of eligible people (whether in receipt or not in receipt of benefit) and those who are receiving the benefit but are not eligible (non-eligible receivers). The denominator of the second non-take-up rate is equal or larger than the denominator of the first non-take-up rate and so estimates for this indicator are equal or lower, respectively, than for the first definition. Hence the estimate of the non-take-up estimated using the first method can be accounted as a higher bound, while those using the second method – a lower bound of the benefit non-take-up (ibid.). These lower and upper bounds of the extent of non-take-up were applied by Vinck et al. (2019) and Tasseva (2016). Herber and Kalinowski (2019) used the first method stated in Bargain et al. (2012) in combination with microsimulations for the survey data to estimate non-take-up of student financial aid in Germany. Austria, like Germany, use the first approach (Ministry of Social Security and Labour, 2020b). The second method was applied by Matsaganis et al. (2010).
Furthermore, either administrative or survey data could be used to estimate benefit non-take-up. Both these data types have their limitations (Goedemé and Janssens, 2020). As Geodeme and Janssens (2020) notes, the biggest limitations of using survey data include under-representation of particular groups, availability of information only about private households (homeless people, people living in the institutions are excluded), mismatch with income reference period, etc. Administrative data also has some restrictions. On the one hand, administrative data could solve the problem of under-representation of particular groups (ibid.). Another strength of using administrative data is related to the availability of monthly data and more accurate dynamics of benefit receipt. On the other hand, administrative data has information only about particular benefit recipients and sometimes it could be hard to identify eligible non-recipients (ibid.). Another issue for the administrative data limitations is related to insufficient information about household members. Most of the registry data collects information about individuals, not households (ibid.). An important limitation of the administrative data within a Lithuanian context is that shadow income and remittances are not visible.
One of the common ways for identifying benefit non-take-up is microsimulation. For example, EUROMOD tax-benefit microsimulation model was previously used in assessing the size of non-take-up of social assistance benefits in Spain and Greece (Matsaganis et al., 2010), Bulgaria (Tasseva, 2016) and Austria (Fuchs et al., 2019). Moreover, a number of other countries (e.g. Estonia, Finland, and Belgium) apply different calculations in order to capture partial benefit take-up in the EUROMOD model.1
EUROMOD is a static tax-benefit microsimulation model (Sutherland & Figari 2013). It enables researchers and policy analysts to calculate, in a comparable manner, the effects of taxes and benefits on household incomes and work incentives for the population of each EU country and for the EU as a whole. The model is open access, with an increasing number of users across Europe and beyond. EUROMOD models monetary social benefits, direct taxes and selected social insurance contributions according to the rules in place on the 30th of June of each year. The labour market income and other non-simulated income sources are taken directly from the data and updated based on average growth by income source based on external statistics from administrative sources or official projections.
The input data for EUROMOD simulations is derived from the EU-SILC data. The EU-SILC data is used across the EU countries for calculation of official poverty and inequality measures. Hence EUROMOD is distinguished by comparability across the EU countries due to: harmonized data and simulations; the impact of comparable policy analyses on household income; model flexibility and a wide range of user choices; due to the development of a tax-benefit model language that is universal.
Besides many advantages, that EUROMOD has, this model has some limitations. First limitation is due to the EU-SILC data. The EU-SILC data do not include information about persons’ social insurance contribution records, and it allows to simulate some benefits only partly (Sutherland & Figari 2013). Moreover, EUROMOD is a static tax-benefit microsimulation model and it allows to analyse first-order effects on social indicators, i.e. the effect before person/household changes their behaviour (Sutherland & Figari 2013).
Methodology
The estimations presented in this paper are done using the Lithuanian component of the EUROMOD tax-benefit microsimulation model version I2.0+. More information on the Lithuanian component of the model and the modelling rules for social assistance is described in detail by Navicke et al. (2019). In this paper we utilize the microsimulation approach by looking at the number of CSA recipients in the original survey data and in the same data after applying simulations using EUROMOD. The second approach for identifying benefit non-take-up as used by Bargain et al. (2012) is applied. We discuss the methodology used in this paper is more detail below.
We estimate the non-take-up using the second method described in Bargain et al. (2012) & Tasseva (2016), i.e. with an assumption that those eligible for CSA according to EUROMOD simulations, but not reported as receiving it in the underlying non-simulated original SILC data, may be considered as those who do not take-up CSA. We estimate the non-take-up rates on an individual level. The formal procedure used in this paper for calculating the non-take-up rate is as following:

where Nentitled,not∈receipt is the number of entitled individual household members according the EUROMOD simulations who did not receive the benefit, and is the number of the individual household members who receive the benefits according to the underlying non-simulated SILC data (whether entitled or non-entitled).
There are some important constrains using survey data for analysing the CSA benefit non-take-up, which need to be discussed before presenting the results. First, the problem of representativeness of the targeted (CSA recipients) group in the SILC data. Table 1 compares the administrative data on CSA recipients (MSSL data) with the SILC data by household type for 2016.
As it can be seen, almost all CSA recipients by household type (except single person household) are overrepresented in the SILC data. This data mismatch may be because SILC representativeness is for the total population in Lithuania. The CSA recipients’ population is small (in 2019, it consisted 2.6% of the total population) and when we decompose those recipients by household type, data mismatch becomes possible.
Table 1. Total annual number of CSA recipients in 2016 in Lithuania comparing Ministry of Social Security and Labour (MSSL) data with SILC data. Source: own calculations
|
Household type |
MSSL data |
SILC |
Diff. |
|
Single person |
58425 |
39354 |
148% |
|
Lone parent |
37216 |
48925 |
76% |
|
2 adults without children |
12348 |
20282 |
61% |
|
2 adults with 1-2 children |
37640 |
57193 |
66% |
|
2 adults with 3 or more children |
30851 |
31998 |
96% |
|
Total annual number of CSA recipients |
176480 |
197752 |
89% |
*Note: MSSL data – Ministry of Social Security and Labour data; SILC – Survey of Income and Living Conditions.
Also, there are differences in definitions, i.e. average annual number of CSA recipients versus total annual number of CSA recipients. In the SILC data we get annual number of CSA recipients. This means, that, as it was mentioned before, income test is applied every 3 months to get CSA benefit. Even if the person got this benefit for the short time period, in the SILC data we get average monthly benefit for the 12 months. It is not possible to find out for how long a CSA benefit recipient got this benefit due to SILC data limitations. The Ministry of Social Security and Labour usually uses the average annual number of the CSA recipients (see Figure 1).
The third constrain for the CSA benefit non-take-up is related with the simulations. First, there are some limitations to include and simulate all the CSA benefit entitlement rules. These rules are complicated and because of the data constrains we are unable to identify all people who are entitled or unentitled to this benefit. Table 2 (see below) shows the mismatch between original data and simulated data. Also, widespread shadow economy not only between household disposable incomes, but also for remittances. To solve this (shadow income) issue, we are using EUROMOD tax compliance adjustment. This adjustment compares people income from the survey (which they presented) and from the registry data. If the incomes from those two sources mentioned before do not match, we assume the potential CSA benefit recipients to not be eligible for CSA benefit system. We assume that those who report shadow income in SILC do not apply for CSA and we do not count those towards the non-take-up. This is a strict condition, but it helps to at least partially solve the shadow income problem.
Results: non-take-up of csa benefit in Lithuania
Dynamics of non-take-up of CSA benefit
Keeping in mind the methodology and its constraints described in the above section of the paper, we estimate non-take-up rate and its dynamics of CSA benefit in Lithuania. The results are presented in this section.
We start by looking at the dynamics of CSA benefit non-take-up in Lithuania in 2007-2016 period. Figure 2 presents the results. To make data for 2007-2016 comparable, we do not apply tax compliance adjustment for the 2016, which is only available since 2016 in EUROMOD.
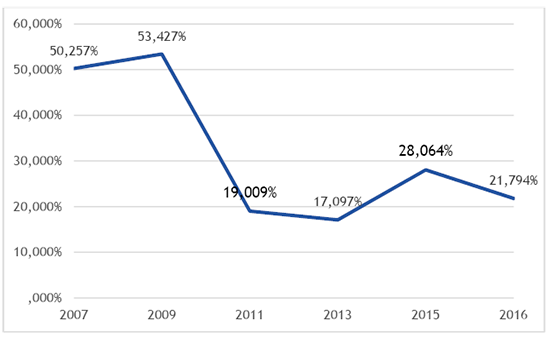
Figure 2. CSA benefit non-take-up in Lithuania in 2007-2016, %*
Source: own calculations.
*Note: Years refer to income year. For 2016, the CSA benefit non-take-up is calculated without tax compliance adjustment. Gray dotted lines show the year when there were methodological changes in the Lithuanian SILC methodology (between 2007 and 2009) and changes in the total resident number after the population census (between 2009 and 2011); the light green line shows CSA system reform.
Results show that before and at the onset of the economic crisis (2007-2009) period, the benefit non-take up rate was high – over 50%. This means, that the share of those who got CSA benefit only after simulations was larger than the share of CSA benefit recipients in the SILC data. Also, there were methodological changes in Lithuanian SILC data collection between 2007 and 2009. Since then, Statistics Lithuania started to collect information about person (household) income from the registry data (before that they collected information about income from the respondent and used registry data for the imputations or additional information). The high benefit non-take-up rate may also be due to low benefit amount per person. Table 2 presents maximum CSA benefit amount for one person per month and the relation with the minimum wage for the analysed period.
Table 2. Maximum CSA benefit amount for one person per month, EUR and the ratio to minimum wage at the time during 2007-2016 in Lithuania*. Source: own calculations.
|
Year |
SSI |
Ratio to MMS |
|
2007 |
59 |
34% |
|
2008 |
83 |
36% |
|
2009 |
101 |
58% |
|
2010 |
101 |
58% |
|
2011 |
101 |
58% |
|
2012 |
101 |
58% |
|
2013 |
101 |
35% |
|
2014 |
101 |
35% |
|
2015 |
102 |
31% |
|
2016 |
102 |
29% |
*Note: SSI – state supported income (maximum amount of CSA benefit for one person); MMS – monthly minimum wage. Till 2015, the Lithuanian currency was Litas. Currency exchange rate to Euro calculations were made for the SSI, MMS sizes for 2007-2014 (1 EUR = 3.45 Litas).
Results show that for 2007-2008, the maximum amount for CSA benefit per month for one person is around 34-36% compared with MMS. This ratio may result that the CSA benefit amount is relatively low, and it gets lower as an individual’s income gets higher. The minimum wage was also substantially lower compared to the average wage.
After 2009, the CSA benefit non-take-up rate dropped down and reached 17-19%. That kind of benefit non-take-up reduction may also be because of the previous mentioned methodological changes in the Lithuanian SILC (weights for the population were corrected due to population census data in 2011), but this may also be because of the reduced stigma in the context of the economic crisis, one that the right to this kind of benefit is reserved to those who do not want to work or are families at social risk. Also, the unemployment rate in Lithuania was high during the economic crisis period, which means that household income decreased and more people became entitled to this benefit. In addition to this, the CSA benefit amount increased since 2009, and it was 58% of MMS size of that time (see Table 2).
The year 2015 can be considered an economic growth period. Also, in 2015, as it was mentioned before, CSA system reform was implemented across Lithuania, providing municipalities with a higher discretion for the provision of the CSA benefit. Figure 2 shows the increase of the benefit non-take-up from less than 20% in 2011-2013 to around 28% in 2015 and around 22% in 2016. The increase of the non-take-up since 2013 may be due to the effect of the economic cycle and that of the CSA reform, which increased the control and monitoring of the provision of CSA by municipalities. Moreover, as a result of the latter reform, the unused funds for cash social assistance became available for other municipal social purposes, which potentially created incentives for municipalities to restrict access to CSA in order to save funds. Nevertheless, the current methodology does not enable to distinguish which part of the increased non-take-up after the economic crisis is related to the effect of the economic cycle and which to the social assistance reform.
The overall dynamics of CSA benefit non-take-up is as it was expected, i.e. high non-take-up rate before and at the onset of economic crisis, decreased non-take-up thereafter and increase/ stabilization of the non-take-up rate for the CSA system reform years and as an economy recovers again. Looking at association of the CSA non-take-up and the total number of CSA benefit recipients, a strong negative correlation is observed (a negative non-parametric Spearman’s rank correlation coefficient of -0.8). While there is a small number of CSA benefit recipients, benefit non-take-up rate is high and vice versa.
Non-take-up of CSA benefit by household type
Next, it is important to know which household types are more affected by benefit non-take-up. Table 3 (see below) presents benefit non-take-up results for 2016 disaggregated by household type.
Table 3. Total annual number of CSA benefits recipients by household type and CSA benefit non-take-up in Lithuania in 2016.* Source: own calculations.
|
Household type |
a. SILC |
Euromod |
b. Only Euromod |
CSA benefit non-take-up |
|
Single person |
39354 |
27633 |
17398 |
31% |
|
Lone parents |
48925 |
62280 |
31061 |
39% |
|
2 adults without children |
20282 |
5415 |
1258 |
6% |
|
2 adults with 1-2 children |
57193 |
21711 |
5875 |
9% |
|
2 adults with 3 or more children |
31998 |
12489 |
404 |
1% |
|
Total annual number of CSA recipients |
197752 |
129528 |
55996 |
22% |
*Note: For the EUROMOD simulations tax compliance adjustment was used. Years refer to income year.
The results show that the total CSA benefit non-take-up in Lithuania in 2016 (including the tax compliance adjustment) is about 22%. Also, table 3 shows the match between SILC and Euromod. It shows that simulations are problematic due to the complexity of the CSA benefit rules. We simulate less benefit recipients than there are in SILC, which means that the CSA benefit non-take-up should be evaluated keeping in mind all previously mentioned constraints.
The biggest CSA benefit non-take-up rate is among the two household types: single persons (31% non-take-up) and lone parents (39% non-take-up). This non-take-up may be for various reasons, both substantial and technical.
On a substantial side, single persons may have higher non-take-up rates due to the widespread shadow economy, stigma, or control factors applied by municipalities, especially after the CSA system reform (e.g. a municipality has the right to check household income, the situation in the household, to ask those who are able to work yet do not work (officially) or are registered at an employment office, performing public works, etc. This is especially relevant to single parents: since the family is entitled to a CSA benefit, social services have the right to do an inspection at the recipient’s house and if they notice that a single parent do not live alone (has a partner) and did not update the social services about these new circumstances, they may lose the CSA benefit.
On the technical side, there can be microsimulation error and sampling errors involved, e.g. those people could not apply for CSA, because household income is tested every 3 months in order to get CSA; household income is slightly higher than the income test boundary; samples of CSA recipients are not representative in SILC. However, such an error should in principle be distributed equally among all groups of CSA recipients. Hence, it can be argued that while the point-estimates presented in Figure 2 and Table 3 may be subject to some statistical and simulation error, they should capture the tendencies and the magnitude of the benefit non-take-up across years and by household type.
Conclusions
There is no established methodology on how to evaluate the benefit non-take-up rate in Lithuania. In this paper, we estimate the non-take-up of CSA benefit in Lithuania for the period of 2007-2016 using SILC data and EUROMOD micro-simulation tool.
The analysis of the CSA benefit non-take-up for 2016 has shown that CSA benefit non-take-up in Lithuania was around 22%. This means that around one fifth of those who are entitled to this benefit do not get it for various reasons, even after the CSA system reform was established. The results show that there are two types of households, with a non-take-up rate exceeding 1/3, i.e.: single person and lone parent households. Non-take up among single persons and single parents may be high due to several reasons, including shadow and unreported income, control measures applied by municipalities to validate the status of a single person and related stigma.
The dynamics of CSA benefit non-take-up are strongly negatively correlated to the annual average number of recipients of the CSA benefit. While there is a small number of CSA benefit recipients, the benefit non-take-up rate is high and vice versa. This makes for a counter-cyclical dynamics of the CSA non-take up relative to the economic growth cycle. One of the reasons why the benefit non-take-up rate before economic crisis period was high is that within the favourable economic growth cycle, not all who were entitled to this benefit applied to get it. This may be due to the shadow economy and the existing stigma for those who receive this benefit, a relatively low maximum CSA benefit amount per month, and other reasons. During the economic crisis period, CSA benefit non-take-up has decreased, while the number of recipients has increased. This may be the result of the high unemployment rate, the increased maximum CSA benefit amount for one person during this period, and also due to reduced stigma for the CSA benefit recipients in the context of general economic hardship. In the period of economic recovery and rapid economic growth, the CSA benefit non-take up increased again. This may be due to the before-mentioned shadow economy, still existing social stigma for CSA benefit recipients, and it could also be due to an increased municipalities’ discrepancy after the latest social assistance reform. Moreover, as a result of the latter reform, the unused funds for cash social assistance may be used for other municipal social purposes, which may create incentives for municipalities to restrict access to CSA in order to save funds. Nevertheless, the current methodology does not enable to distinguish which part of the increased CSA non-take-up after the economic crisis is related to the effect of the economic cycle and which to that of the social assistance reform. It also does not allow to disaggregate the total national estimates to a municipal level.
It is important to pay attention to the limitation of this analysis due to the data restrictions related to the issue of how representable CSA benefit recipients are, the shadow economy, annual average benefit data, etc. There is a way to improve this evaluation by using administrative data. However, administrative data has its own constrains (e.g. incomes are visible only from the registry data, thus shadow economy and remittances estimates are not available). Nevertheless, the use of administrative microdata in combination with microsimulations has a high potential for the future, once such data are available. Other alternative methods for estimating CSA non-take-up in Lithuania should also be used and compared with the results presented in this paper.
Acknowledgement
The results presented here are based on EUROMOD version I2.0+ and additional components for Lithuania developed by the Ministry of Social Security and Labour of the Republic of Lithuania. The core EUROMOD model is maintained, developed and managed by the Institute for Social and Economic Research (ISER) at the University of Essex, in collaboration with national teams from the EU member states. The process of extending and updating EUROMOD is financially supported by the European Union Programme for Employment and Social Innovation “Easi” (2014-2020). The additional development of the model’s component for Lithuania is carried out in the framework of the project No. 10.1.1-ESFA-V-912-01-0019 “The establishment of a system for forecasting, deciding, coordinating and monitoring the effectiveness of social assistance policies.” We are indebted to the many people who have contributed to the development of EUROMOD. The results and their interpretation are the author’s responsibility.
References
Bargain, O., Immervoll, H., & Viitamäki, H. (2012). No claim, no pain. Measuring the non-take-up of social assistance using register data. The Journal of Economic Inequality, 10(3), 375-395.
Eurofound (2015). Access to social benefits: Reducing non-take-up, Publications Office of the European Union, Luxembourg. URL: https://www.eurofound.europa.eu/publications/report/2015/social-policies/access-to-social-benefits-reducing-non-take-up.
European Commission (2017). The European Pillar of Social Rights in 20 principles. URL: https://ec.europa.eu/commission/priorities/deeper-and-fairer-economic-and-monetary union/european-pillar-social-rights/european-pillar-social-rights-20-principles_en.
Fuchs, M., Hollan, K., Gasior, K., Premrov, T. & Scoppetta, A. (2019). Falling through the social safety net? The case of non-take-up in Austria, Policy Brief 2019/2. Vienna: European Centre. URL: https://www.euro.centre.org/downloads/detail/3436.
Goedemé, T. & Janssens, J. (2020). The concept and measurement of non-take-up. An overview, with a focus on the non-take-up of social benefits, Deliverable 9.2, Leuven, InGRID-2 project 730998 – H2020.
Herber, S. P., & Kalinowski, M. (2019). Non-take-up of student financial aid—A microsimulation for Germany. Education Economics, 27(1), 52–74. https://doi.org/10.1080/09645292.2018.1490698.
Iva V. Tasseva (2016). Evaluating the performance of means-tested benefits in Bulgaria. Journal of Comparative Economics, 44 (4), pp. 919-935.
Law on Cash Social Assistance for Poor Residents (2020). URL: https://e-seimas.lrs.lt/portal/legalAct/lt/TAD/TAIS.215633/asr.
Matsaganis, M., Levy, H., & Flevotomou, M. (2010). Non‐take up of social benefits in Greece and Spain. Social Policy & Administration, 44(7), 827-844.
Ministry of Social Security and Labour of the Republic of Lithuania (2020a). URL: https://socmin.lrv.lt/lt/veiklos-sritys/seima-ir-vaikai/socialine-parama-seimoms-ir-vaikams/statistika.
Ministry of Social Security and Labour of the Republic of Lithuania (2020b). Socialinės paramos išmokų nepaėmimo tyrimas: ES taikomų metodikų apžvalga ir pritaikymas Lietuvoje. URL: http://socmin.lrv.lt/uploads/socmin/documents/files/veiklos-sritys/darbas/darbo-rinka/TYRIMAI/I%C5%A1mok%C5%B3%20nepa%C4%97mimo%20ataskaita_2020_05.pdf.
Navickė, J. (2015). The role of cash social benefits in poverty reduction in Lithuania: Discipline, redistribute, include, invest (Doctoral dissertation, Vilnius University).
Navicke, J., Čižauskaitė, A., Užgalė, U. (2019). EUROMOD country report - Lithuania (LT) 2016-2019. EUROMOD version I2.0. URL: https://www.euromod.ac.uk/sites/default/files/country reports/year10/Y10_CR_LT_Final.pdf.
Sutherland, H., Figari, F. (2013). EUROMOD: the European Union tax-benefit microsimulation model. International Journal of Microsimulation, vol. 6(1), pp. 4-26.
Vinck, J., Lebeer, J., & Van Lancker, W. (2019). Non‐take up of the supplemental child benefit for children with a disability in Belgium: A mixed‐method approach. Social Policy & Administration, 53(3), 357–384. https://doi.org/10.1111/spol.12457.
Information on the modelling of the benefit non-take-up can be found in the country reports for the above-mentioned countries using the following URL: https://www.euromod.ac.uk/using-euromod/country-reports
1 Information on the modelling of the benefit non-take-up can be found in the country reports for the above-mentioned countries using the following URL: https://www.euromod.ac.uk/using-euromod/country-reports