Ekonomika ISSN 1392-1258 eISSN 2424-6166
2019, vol. 98(1), pp. 38–59 DOI: https://doi.org/10.15388/Ekon.2019.1.3
A Comparison of Lithuanian and Swedish Old Age Pension Systems1
Teodoras Medaiskis*, Šarūnas Eirošius
Lithuanian Social Research Center, Lithuania
Abstract. The aim of this study is to compare Lithuanian and Swedish pension systems from the point of view of their design and performance in order to elaborate reasonable recommendations to Lithuanian pension policy based on the best Swedish experience. Swedish income, premium and guaranteed old-age pensions system are compared with the analogous Lithuanian system of the “first,” “second” pillars and the “social” pensions. The main features of the systems are discussed, and the performance of the systems, mainly from the point of view of adequacy, is compared. The differences in system design and performance are identified, and the possible reasons of these differences are examined. Special attention is paid to differences in financing and the approach to the definition of benefits. The Lithuanian pension points approach is compared to the Swedish Notional Defined Contribution (NDC) approach. Each system is analyzed, and the relevance of transforming the Lithuanian first pillar pensions into a NDC system is examined.
Key words: Pensions, NDC system, pension reforms, pension adequacy and sustainability.
* Corresponding author:
Department of Quantitative Methods and Modeling, Faculty of Economics and Business Administration,
Vilnius University, 9 Saulėtekio Ave., LT-10222, Lithuania
Email: teodoras.medaiskis@evaf.vu.lt
Received: January 2019. Revised: February 2019. Accepted: March 2019
Copyright © 2019 Teodoras Medaiskis, Šarūnas Eirošius. Published by Vilnius University Press
This is an Open Access article distributed under the terms of the Creative Commons Attribution Licence, which permits unrestricted use, distribution, and reproduction in any medium, provided the original author and source are credited.
1. Introduction
The problem of protecting the senior populace always was and still remains one of the main challenges of the modern welfare state. Population ageing is an important factor making this problem even more significant. The share of experience among countries who implemented pension reforms in order to maintain pensions’ adequacy and sustainability in the changing world may contribute to common progress in this field. Due to this, it appears valuable to compare the Lithuanian pension system, which is still in the process of changing, to the Swedish system, which is characterized by long experience and modern reform and which is frequently mentioned as successful and benchmarking for other countries.
The aim of this paper is to compare the analogous statutory parts of Swedish and Lithuanian pension systems, with special attention to similarities and differences in benefit composition, and to evaluate the chances of adopting this system in Lithuania.
What are the differences and similarities in the design of pension systems in Lithuania and Sweden? What can we learn from the comparison of Swedish and Lithuania pension systems? Is the Swedish NDC model suitable for Lithuania? These questions are analyzed in the context of different different pension indexation rules as well as scales and modes of how pension systems are financed.
Comparative and statistical analysis, as well as imitational modelling, were widely used in this paper. Alongside the analysis of the pension benefits’ structure, the main statistical data on the performance of pension systems are examined and presented. Special attention is paid to a comparison of replacement ratios, including the poverty rates of the retired population (gender differences included) in Sweden and Lithuania. The impact of the financial crisis on pension benefits is also compared in both countries.
Finally, a simulation model is constructed and applied for the analysis of whether the Swedish Notional Defined Contributions (NDC) approach in the pension system would be more suitable for Lithuania than the current approach of “pension points”. Based on this model, individual pensions are calculated as if the NDC system had been introduced in Lithuania since 2001. The results allow to compare the actual and simulated performance of the Lithuanian system as well as to identify the possible strengths and weaknesses of the NDC system if truly applied in Lithuania.
2. Literature Review
No direct comparison of the Swedish and Lithuanian pension systems was done before. Only separate analyses of each system are available.
The Lithuanian pension system was analyzed mostly from the point of view of financial sustainability, effects on public finances and problems of the current design of the system (Medaiskis 2001; Lazutka 2008; Gudaitis 2009; Medaiskis 2011; Lazutka 2012; Bitinas, Maccioni 2014). Ever since the pension “pillars” were introduced, special attention was paid to their role. In the studies, usually mentioned are the challenges for the Lithuanian pension system like the ageing of the population, the low financing of the pension system (and, consequently, the low benefits of the pensions), an absence of any clear indexation rules, emigration, and the expected growth of the pension expenditures.
Less research work was made on pension adequacy. Some of the studies compared the pensions of the participants and non-participants of the “second pillar.” A comparison of the accumulated pension capital with losses in the pay-as-you-go system showed that the average accumulated amount in fully funded, private second pillar pension funds slightly exceeds the evaluated present value of the lost part of social insurance pensions (Medaiskis, Gudaitis 2013).
An analysis of possibly reforming how benefits are calculated is presented in the report on this matter (Pensijų skaičiavimo…, 2012). The results of the study showed that there was no reason to put high expectations on changing the models of the pension calculation formulae as this would not solve sustainability problems of social insurance. With regard to budget balancing, the consistency of the formula for calculating and indexing the amount of pensions would be more useful. The report advised to change the former pension calculation formula to the “pension points” approach as one that would be more closer to the current approach and less expensive from the administrative point of view than a full reform toward NDC yet fully able to ensure the same consistency.
The Swedish pension system has been quite widely analyzed since the introduction of the NDC scheme. Studies has found it to be both advantageous and disadvantageous. The NDC pension scheme in Sweden is equipped with a combination of a demographically adjusted annuity provision, indexation, and a solvency ratio that maintain a near-perfect financial stability in the long run (Palmer 2014). On the other hand, Cichon (1999) noted that without any ad hoc adjustments to benefit levels and indexation provisions, the NDC system is not in an automatic equilibrium. The system does not automatically fully cope with the financial effects of population ageing. K. G. Scherman (2007) notes that any country that contemplates the introduction of the NDC system such as that of Sweden – it being a system designed to keep the contribution rate unchanged – has to recognize that such a system maintains decreasing pension levels as the population continuously ages. He suggests that this negative effect could be postponed by the existence of a buffer fund (as there is one in Sweden) or higher immigration levels. E. Whitehouse, after a comparison of the pension systems of different types, states that “notional accounts are an example of good practice […]. However, well designed pension schemes of the alternative types – defined-benefit or points – share these characteristics” (Whitehouse 2010, p. 20).
3. The Current Pension Systems in Lithuania and Sweden: Some Design Similarities and Differences
In order to lay the foundation for further analysis, we will start with a short comparison of features of the Lithuanian and Swedish systems that are most important to this analysis. This is presented in Table 1.
In comparing the origins and development of the pension systems during the recent decades, it ought to be noticed that the Lithuanian system was reformed much more often and developed less consequently than the Swedish one. It may be justified by the fact that Lithuania had to create the first national system from scratch, having no sufficient experience in pension policy. A political consensus on the pension system reform was partially achieved at the time when funded pillars were introduced; nevertheless, no consensus in the political opinions regarding how to adapt the pension system to the consequences of the financial crisis was achieved, and decisions taken in the years 2004 and 2012 were strongly revised and partially abolished by the more recent political parties who came into the legislative force in 2016. The permanent process of the reforms diminishes the confidence that the society has in the pension system; thus, this confidence seems to be much weaker in Lithuania than in Sweden. In 2016, the confidence of Lithuanians with pension system dropped from 28 percent to 18 percent during one year. The main reason mentioned by the respondents – frequent initiatives to change the pension system (SEB, 2017)
Table 1. A comparison of the Lithuanian and Swedish pension systems.
|
Lithuania |
Sweden |
|
The current pension system was shaped by several essential reforms. After the restoration of the independence in 1990, Lithuania inherited the system common for all the former Soviet Union states. The first national pension system of the “first pillar” was designed in the years leading up to 1995 and became applicable from that year. The second essential reform was passed before 2004 and began in the same year. This reform introduced a “second” and “third” pillar of funded pensions. At the end of 2012, this system was modified because of the financial crisis. Recently, another reform regarding the funded part of the system was legislated and becomes effective in 2019. |
The current pension system was introduced based on the consensus of the five largest political parties in Sweden. In 1994, after more than a decade of debate and research, the reform guidelines were adopted; four years later, all the necessary changes to the law were adopted. The new pension system began operating in 1999. The fact that the reform was carried out based on a consensus between the five political parties allows a sufficiently high stability of the system and makes it resistant to political change. This stability is also evidenced by the fact that no significant changes have taken place since the start of the new system.
|
|
The main parts of the current Lithuanian pension system are the following “pillars”: “first pillar” (pay-as-you-go); “second pillar” (fully funded). These “pillars” are supplemented, from one side, with “social pensions” granted to old and disabled citizens who have no full right to the first two pillars’ pensions; from the other side, the “pillars” are supplemented with the voluntary savings of the so-called “third” pillar. No occupational pensions are available in Lithuania. “First pillar” pensions are divided into general (semi-flat, dependant on the number of years of insurance) and individual (earnings-related) parts. |
The main parts of the current Swedish old age pension system are as following: income pensions (pay-as-you-go); premium pensions (fully funded). These pensions are supplemented with “guarantee pensions” for those with insufficient pension rights as an addition to the income pension up to threshold. About 90 percent of Sweden’s wage-earners are covered with occupational pensions. Private pensions are also available in Sweden.
|
|
From the year 2019, the general part became financed from general taxation, and the individual part – from personal contributions (8.72 percent of the wage for senior inhabitants, disabled inhabitants, and survivors’ pensions). Contributions are not shared by the employers. Contributions are collected into the State Social Insurance Fund (SSIF). Personal records of the earned “pension points” are available from the year 1994. The “social pension” is non-contributory and financed from general taxation. |
Income pension is financed from contributions. The rate for the income of old age pensions is 16 percent of pensionable income, which is divided between the employee and the employer.
All insured people have virtual accounts in the Swedish Pension Agency, where their accumulation balance is maintained. The “guarantee pension” is non-contributory and financed from general taxation. |
|
The general part of pension is semi-flat, i.e., it is calculated as a flat “basic pension” multiplied to the ratio of income earned by a person and the “obligatory” years of pension insurance. The individual part is calculated on the basis of the “pension points” approach. Both parts are indexed according to the seven years’ average of the growth rate (reported and expected) of the national Labor Compensation Fund. |
Income pension is calculated on the basis of the NDC scheme. It is indexed according to an index based on the real wage three years’ growth and reduced by 1.6 percentage points. |
|
The “second pillar” is fully funded by a privately managed DC scheme. From the year 2019, it is financed from personal contributions and matching State contributions. During the transition period in the coming years, the personal contribution will reach 3 percent of the personal gross wage, and State contribution – 1.5 percent of the country’s gross average wage. |
Premium pensions are fully funded DC pensions managed by investment funds. The contribution rate for premium pensions is 2.5 percent of pensionable income. |
|
The pensions of the disabled and those of the survivors are included into first pillar system. |
Disability and survivors’ benefits are not tied to the old age pension scheme and are managed by the Swedish Insurance Agency. |
|
All kinds of pensions are exempt from any taxation. |
Pensions are subject to taxation like other forms of income. |
Source: Fritzell et al. (2018), Orange Report 2017 (2018), The Swedish old-age pension system (2016), Anderson, Backhan (2013).
A common feature of both the Lithuanian and Swedish pension systems is that both consist of the pay-as-you-go and funded components and supplemented with “guaranteed” or “social” provisions for those who are not entitled for pension benefits at all or for whom these benefits are too low. Private pensions are available in both countries, yet occupational pensions only in Sweden.
Despite the similar composition, there are many essential differences in the design of the components. Some of them are discussed below.
The different role and weight of the flat part of pension. The Lithuanian “first pillar” pension includes a general part paid for all recipients. Any individual earnings-related part is paid on the top. The general part is calculated according to the number of years of insurance and it is related to the current amount of the “basic pension”; the individual part depends on the number of pension points collected by the recipient multiplied by the current value of the pension point. One pension point per year is earned by the insured person if she/he pays the requested contribution from the country’s average gross wage; not more than five pension points may be earned per year because of the ceiling of the contributions’ base (an appropriate ceiling will be fully applied beginning with the year 2021). If the sum of the general and individual parts of a person’s pension is below the current level of the “social” pension, the difference is then covered. The essential difference here from the Swedish system is in that the general part of a pension is paid for all recipients, not only for those who receive a low amount of the individual part (unlike in Sweden, where a guaranteed pension is paid only to those with a low income pension). Instead of the Swedish guaranteed pension, the Lithuanian system applies two levels of semi-flat payments: the general and (if necessary) “social.” This part of the pension is not means-tested in either of the two countries.
The Swedish approach appears more simple and transparent than the Lithuanian approach. Unfortunately the efforts to follow this approach and to join the Lithuanian general and “social” pension into one “zero-level” universal pension (similar to the Swedish guaranteed pension) were not successful due to the evaluated expenses of transformation. If, for example, we wished that the current average (and above average) old-age pension after the transformation should be paid equal to the amount before the transformation solely as an individual part (with no general part included), the value of the pension point must be almost doubled, because the general part now consists of around a half of an average pension. That includes the necessity for high additional expenses for the pensions with the values above average despite the fact that general part for these pensions would not be paid. It also means that additional financing in this case would be directed to higher-income groups, which is not acceptable due to social and political reasons. If, in another case, it was decided that the current two-time average old-age pension (and above) after transformation should be paid at the previous amount as an individual part, the value of the pension point should then be increased less than in the first case; however, more than 90 percent of the recipients would still remain the recipients of the full or of a part of the new general pension. A reform aimed at less than 10 percent of the recipients with the highest income (and those increasing this income) and one that leaves 90 percent of the recipients as the recipients of a guaranteed supplement do not look rational. In Sweden, only one third of the income pension recipients are also granted the guaranteed pension (The Swedish old-age pension system (2016)).
It seems that the core of the differences in the benefits structure between the Swedish and Lithuanian pension systems is that the Lithuanian system is more redistributive among recipients than the Swedish one. Above 50 percent of all pension expenditures in Lithuania are directed to the semi-flat general part. This is the consequence of the relatively low financing of the Lithuanian pension system (further explained below): the low budget should be distributed among the recipients more evenly in order to guarantee necessary subsistence for the recipients with low insurance records and a low number of earned points. For comparison: the expenditures for the Swedish guaranteed non-contributory pension are only 8.5 percent of the sum of income and guaranteed pension expenditure (this is calculated by the authors based on the data presented in Pensions Myndigheten. Statistikdatabas, October 2018).
Differences in financing. The different design of the pay-as-you-go parts of the pension systems implies a different approach to the financing of these systems. Until the year 2019, both the general and individual parts of pension in Lithuania were financed from contributions shared between the employers and employees. The pension insurance (including disability and survivors’ pensions insurance) contribution rate in the year 2018 was 25.3 percent (22.3 points paid by the employer and 3 points by the employee). In mid-2018, the essential tax and contributions reform was passed. The whole financing of the general part of pension was directed to the State (general tax) as the amount of this part is not related to contributions paid by the insured person. Only the individual part is now financed from contributions, and these contributions will be paid solely by the employee. The consequence of this “tax revolution” is that all wages from January 2019 should be nominally increased by 28.9 percent in order to the maintain previous net income of employees. The personal income tax is increased from 15 to 20 percent, and the contribution rate to the pension system is 8.72 percent. The main motive for this reform lies in an attempt to decrease the tax burden on labor.
The Swedish 16 percent and the Lithuanian 8.72 percent contributions for income and individual pensions respectively correspond to the differences in the pay-as-you-go pillar composition between Lithuania and Sweden. The Swedish pension composition, with a much higher weight of the earnings-related part of pension, seems more fair; the low Lithuanian expenditures for pension, as it was stated above, act as an obstacle in following the Swedish approach. Another essential difference of pension contributions is that the whole Lithuanian contribution from the year 2019 is paid by the employee and not shared by the employer. The motive for this change, as presented by the politicians, is to show the employee “the full cost of social insurance” and in this way encourage citizens to avoid shadow labor. We are not convinced by this motive.
As it was mentioned above, the Lithuanian pension system is financed much less than the Swedish in absolute and in relative terms. Eurostat data on old age pension expenditure as the percentage of GDP are presented in Figure 1.
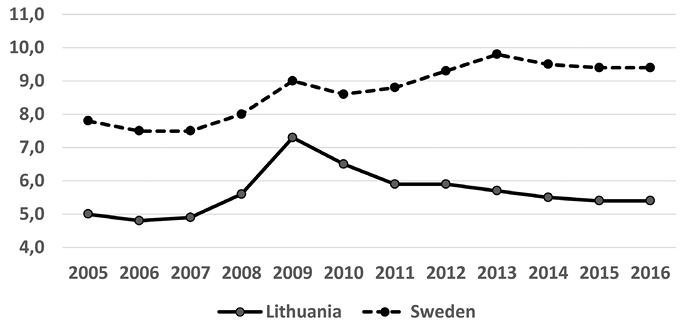
Fig. 1. Expenditures for old-age pensions in Lithuania and Sweden (percent of GDP).
Source: Eurostat, table [spr_exp_pens]
The low financing of the Lithuanian pension system corresponds to the whole relatively low level of Lithuania’s public resources. According to Eurostat data, total general government expenditures in the year 2016 were 34.1 and 49.7 percent of the GDP in Lithuania and Sweden, respectively.2 This shows that the pension financing problem is part of a bigger problem associated with government revenue. Tax evasion, the shadow economy, and low direct taxation are usually cited as the main reasons of low government revenue (OECD 2018, p. 186–187). Nevertheless, if the Lithuanian government would manage to collect taxes at the Swedish level and proportionally increase old age pension financing, it would amount almost up to 7.9 percent3 of the GDP for pensions, which would still be less than the current Swedish 9.4 percent. This means that in Lithuania, not only the whole pie of government expenditures is smaller, but that the slice of the pie, too, is also smaller.
As it was mentioned above, both the Lithuanian and Swedish systems have fully-funded components in their old age pension systems. In Sweden, this is the premium pension, and in Lithuania – the “second pillar.” The Lithuanian “second pillar” pension savings are managed by private pension accumulation companies. There currently are four management companies and one life insurance company in Lithuania, while in Sweden – more than 100 financial service companies (Fritzell et al. 2018). Despite the common purpose of additional savings and a common FDC approach, several differences between these pensions should be noted.
A person who wished to participate in the Lithuanian “second pillar” process may choose a pension accumulation company and then a pension fund managed by this company. Before the year 2019, a person was allowed to direct 2 percent of the obligatory pension insurance contribution into a personal account under the condition that they would save additional 2 percent of the received wage in this account. A matching State contribution of 2 percent of the country’s average wage was then added to this account. Participation in this system (usually referred to, in simple terms, as the “2+2+2”) was voluntary: a person could choose either to pay the full contribution to the “first pillar” or join the “second pillar”; in the latter case, the “first pillar” pension was proportionally reduced, but additional savings were earned. From the year 2019, this system became modified: participation in the “second pillar” is still voluntary, but a person who did not choose a pension accumulation company was automatically enrolled and assigned to a randomly selected company. A person has the right to cancel this enrollment and stay solely in the “first pillar”; any default state-run fund is provided in this case like in Sweden.
Pension funds managed by pension accumulation companies are reorganized according to the life-cycle approach; thus, a participant is directed into the appropriate fund according to his/her age. The former 2 percent pension insurance contribution now is joined with 2 percent taken from a personal payment; so, the “2+2+2” system in the coming years is transformed into “0+4+2” and then into “0+3+1.5” due to the above mentioned “tax revolution.”
The direct personal contribution to the “second pillar” made the Lithuanian “second pillar” system more similar to the Swedish approach, but the main difference from the Swedish system remained: it matches the Lithuanian State contribution to a person’s account, which is not the case in Sweden. The Contribution by State (may also be treated as tax relief) is justified as an incentive for those who are prudent and save their money for the future. It aims to encourage people to take more care about their future when pension protection from the “first pillar” is expected to be very modest due to population ageing.
It is difficult to directly compare the scale of the Swedish premium and Lithuania’s “second pillar” by the rate of contribution, because the base of contribution (i.e., the gross wage) is different due to different tax regimes. Nevertheless, it seems that the Lithuanian 4.5 percent may accumulate relatively higher pension savings than the Swedish 2.5 percent, and that the pension part paid from the Lithuanian “second pillar” savings will in the future be higher than the corresponding part paid from the Swedish premium pension. This, in a certain sense, offsets the domination of the semi-flat general part of Lithuania’s pay-as-you-go pension. According to the OECD’s calculation, about 50 percent of pension in the future will be paid from the “second pillar” savings (Lis 2018).
Differences in the calculation and indexation of benefits. The main difference in how the Lithuanian and Swedish pensions are calculated lies in the distinction between the “pension points” and the NDC approach. As mentioned above, the Lithuanian “pension points” system was revised from the year 2018 in order to make it more consistent, but it was not recommended to change the whole system into a NDC approach. In the last sections of this paper, we construct a simulation model that helps us to evaluate the possible advantages and disadvantages of an NDC system if it were to be applied in Lithuania.
The main factors determining the value of the Lithuanian pension are the amount of the basic pension (determining the general part) and the value of the pension point (determining the individual part). Despite the efforts to introduce clear rules of the definition and indexation of these factors according to objective economic indicators, they were set by ad hoc decisions of the government during many previous years. Clear pension indexation has been introduced and effective in Lithuania only since 2018. As a starting point, the current values of the basic pension and the pension point at the end of the year 2017 were taken. Both factors are indexed according to the average growth rate of the national Labor Compensation Fund. For the calculation of this average, the data of three years before current year, the expected value of the current year, and the forecasted growth rates of the coming three years are taken. Indexation is not applied if the decrease of the GDP or the Labor Compensation Fund is expected in the coming years. This rule is anticipated to ensure the financial sustainability of the pension system in the ageing population and additionally helps to accrue a reserve fund to be used for maintaining pension values in case of a recession.
The value of the Swedish pensions depends on the notional accounts of retirees, on the internal rate of return applied to these accounts, and on the rules regarding how they are converted into annuities and then indexed. Annuities are calculated in a way that pensioners receive a part of real growth in advance. This results in higher initial payments, but when benefits are indexed according to an income index based on a three year growth of wages, this index is respectively reduced.
In order to ensure the financial sustainability of the Swedish pension system, it includes automatic balancing. A formula for calculating the assets and liabilities of the system is prescribed by legislation. Assets and liabilities are valued at a three year moving average. If the balance ratio falls below 1, the automatic balance mechanism is activated. It switches the indexation of pensions and notional pension capital to a new index series called the balance index. The balance index is calculated by multiplying the balance ratio (which is less than 1 if the balancing mechanism is activated) by the income index. Once the balance index catches up with the income index, the balancing mechanism is deactivated.
As a common feature of both systems may be mentioned the fact that pension benefits are calculated based on lifetime contributions (the number of points collected or notional account accrued). However, in the Lithuanian case, it is fully true only for the individual part of pension.
In both systems, pensions are indexed according to labor market performance, but this is taken into account in rather different ways: the growth rate of the LCF versus real wage growth, different periods of evaluation of the growth rates (seven or three years), and the choice of using growth rate forecasts or not.
Both systems have formal rules on how to slow down or stop the indexation, but these rules are quite different: the Lithuanian system directly relies on macroeconomic indicators, while the Swedish one relies on these indicators indirectly, via ABM.
4. Some Issues on the Performance of the Pension Systems
The comparison of pension systems should not be limited to only to systemic design issues; it should also include a comparison of the performance of analyzed systems. The most important aspects of pension system performance are without a doubt the level of success in such essential issues as the smoothing of life income (evaluated as the replacement rate of income) and the protection from poverty (evaluated as the poverty rate of pensioners). Another quite interesting perspective is to look at how the pension systems fared through the economic crisis.
The replacement ratio. The aggregate replacement ratio, presented in Graph 1 and discussed below, is defined by Eurostat as the “gross median individual pension income of the population aged 65–74 relative to gross median individual earnings from work of the population aged 50–59, excluding other social benefits.”4
In Sweden, the aggregated replacement ratio has not changed significantly during the years 2005–2016. The highest ratio was seen just before the last financial crisis, and it reached the lowest point in 2012. The slow impact of the crisis is caused by the adjustment mechanism, which uses indicators not from the last year but from the average of three years.
In Lithuania, this indicator shows a quite different situation: the replacement ratio is around 15 percentage points lower than in Sweden and much less stable. Surprisingly, the highest level was reached during the financial crisis. One of the main reasons for this is that pensions in Lithuania had no formal adjustment mechanism. The indexation of pensions was based only on political discretion. During the time of crisis, even though wages were significantly decreased, pensions were not reduced proportionally, and this caused an increase in the replacement ratio (including the social protection budget debt as well).
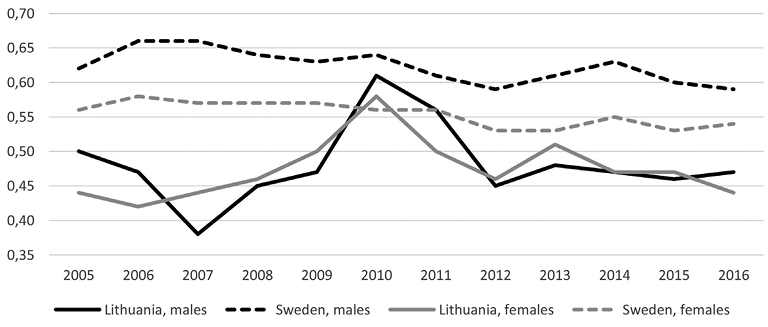
Fig. 2. Aggregate replacement ratio
Source: Eurostat, table [tespn070]
When looking at the gender aspect of the aggregate replacement ratio, it should be noticed that during the whole last decade, the females ratio went from 5 to 8 points lower than the males ratio in Sweden, which is not the case in Lithuania. Despite some differences in certain years, the male and female replacement ratio in the averages does not differ so much in Lithuania as it does in Sweden.
This observation serves as evidence that the Swedish system provides better income protection and income smoothing during the life cycle but is more unequal from the gender point of view than the Lithuanian one. The main reason for this is the much lower financing of the Lithuanian pension system (see above); gender inequality in Sweden may probably arise due to the fact that many women still devote more time to unpaid work and less time to paid work than men, which results in lower average incomes and, later on, in lower average pensions for women (Ahuja 2011).
The at risk of poverty rate. The aggregate replacement rate shows the current average situation. Another important indicator of pension system performance is the gross replacement rate, which is defined by the OECD as “gross pension entitlement divided by gross pre-retirement earnings” (OECD 2018). According to the OECD’s projections, a 50 percent wage earner may expect 74.4 a percent replacement rate in Lithuania and 55.8 percent for the same rate in Sweden. On the other hand, a 150 percent wage earner may expect a 47.3 percent replacement rate in Lithuania and a 64.5 percent for the same rate in Sweden (OECD 2018). These figures confirm the conclusion that the Lithuanian pension system is more redistributive in favor of the recipients of lower benefits.
It should be mentioned that a comparison of “gross” pension income between Lithuania and Sweden may be partially misleading as Lithuanian pensions are not taxed at all, while Swedish pensions are fully taxed. Thus, the Swedish “gross” pensions are in fact compared to “gross” median earnings; in the Lithuanian case, “net” pensions are compared to “gross” earnings. Because of this, the distance between replacement rates in Lithuania and Sweden may be lower than presented above.
One of the main indicators of how adequacate is a pension system is the percentage of retirees at risk of poverty. For this, Eurostat data for Lithuania and Sweden are presented in Figure 3.
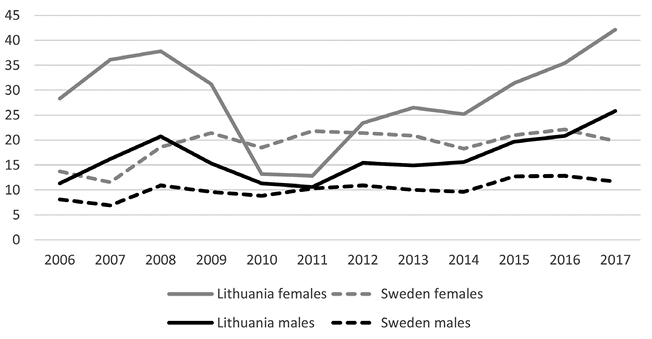
Fig. 3. At Risk of Poverty Rate for pensioners
Source: Eurostat, table [tespn100]
Swedish data show a stable or slightly increasing trend of the percentage of pensioners at risk of poverty with small deviations. The gender gap is also more or less stable – the percentage of female pensioners at risk of poverty is above the male percentage by around ten percentage points. It shows us that the Swedish system provides rather stable protection, but the situation of women is visibly worser than the situation of men. The reason for this is possibly similar to the reason behind the differences in the replacement ratio.
Lithuanian data are different: the percentage of pensioners at risk of poverty is much higher than in Sweden except for the years of 2010–2011, when, due to the economic crisis in Lithuania, the median income of the population fell down more than the income of pensioners, which resulted in the low levels of the poverty rate. Outside of this period, the Lithuanian percentage of pensioners at risk of poverty is much higher than in Sweden and has a dangerous trend of rapidly increasing in the recent years. The gender gap is also bigger than in Sweden – by around 15 percentage points. Having in mind that the replacement ratio of men and women in Lithuania differs not so much, the most probable reason lies in the lower wage of women and the shorter insurance period due to an earlier retirement age applied in the former years, when the current generation of the pensioners had retired.
To conclude, these indicators show the better performance of the Swedish system; nevertheless, even in Sweden, women happen to be in a worser situation than Swedish men after retirement.
How pension systems reacted to the economic crisis. The financial crisis of 2008 struck the sustainability of Lithuanian social security insurance very severely. The deficit of the SSIF was more than a quarter of incomes in 2009 and 2010 due to the decreased contributions; it also owes to the fact that just before the crisis, the amount of old-age pensions and maternity benefits had considerably increased (almost by 30 percent). In these circumstances, the government had no choice but to decrease pensions. The value was restored after two years, but then, this amount of pension was frozen during four years.
Swedish pensions, on the other hand, were reduced by automatic balancing in 2010 and 2011; nevertheless, the government stepped in to provide tax cuts to pensioners so as to offset some of the reductions. The tax breaks were financed from the general budget, so they had not affected the financial status of the pension system (Anderson, Backhan 2013). The stock market downturns of the early 2000s and 2008 have affected the fully funded pensions much more than the pay-as-you-go segment. In 2014, income pensions were reduced again (by the negative balancing index in 2012). Another round of tax breaks for pensioners managed to offset some, but not all, of the reductions in the pension pay-outs. So later, after the crisis, the balancing mechanism was still affecting pensions to stabilize budget. Because of an economy recession that was not as deep, and owing to the three years’ average usage, the balancing index was not as high; however, the reduction of pensions lasted quite long even after the crisis.
Both Lithuania and Sweden were forced to reduce pensions because of the financial crisis. In Lithuania, this reduction was much more painful partly due to the much deeper recession, which in turn is partly due to the absence of a clear rule of indexation during that time that would have taken into account – like this was done in Sweden – economic and demographic developments rather than political decisions.
5. An Evaluation of the Possible Application of the NDC System
in the Lithuanian Pension System
The main aim of this part of our study is to answer the following questions: if the Swedish NDC approach would have been made effective in Lithuania since 2001, what consequences would it have yielded? Would it have helped in improving the system’s adequacy and sustainability? Would it have helped to cope with the crisis? Is the Swedish NDC model suitable for Lithuania in a long-term perspective?
Methodology of constructing the simulation model. In order to answer these questions, we apply a simulation model based on the Swedish scheme and adapted for Lithuania by modifying the formulae of the scheme and selecting the parameters suitable for Lithuania.
The equations of the model and data. In the NDC scheme, the sum Ki,T, accumulated by an individual i at the end of the time period T, is determined by the following formulae:
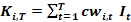 ,
, 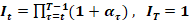 (1)
(1)
Here
c stands for the pension contribution rate (or accumulation norm),
wi,t stands for individual wage in the time period t,
It stands for an index calculated according to an internal yield in the time period t,
αt stands for the growth of the average wage. Apart from this, αt would also be used for indexing the pensions that are already being paid.
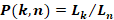
The factor of the annuity is calculated in the following way:
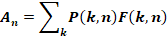 (2)
(2)
 (3)
(3)
 (4)
(4)
Here
An is the annuity factor for an individual who retires at the age of n,
P(k, n) stands for the probability for the individual aged n to expect to live to the age of k,
Lk stands for the number of population at age k,
Ln stands for the number of population at age n.
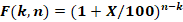
F(k, n) is the discount factor from k years of age to n years of age,
X stands for the discount rate.
The pension paid for the individual i is calculated as an accumulated sum divided to the annuity factor: Ki,n / An and then indexed by the growth rate of the average wage.
The period of 2001–2040 was chosen for the analysis. This period is sufficient for providing an overview of the economic cycle and evaluating the demographic changes.
The population data, especially the numbers of people of working age and those retired, as well as data regarding the average wage in the years 2001–2018, were used as published by the Department of Statistics of Lithuania. For the period of the years 2018–2040, Eurostat population forecast data were applied.5 For the growth rate of the average wage, the short-term forecast of the Ministry of Finance was used, and for the later years, a 5 percent of the average wage growth was presumed.
The specificity of the system determines that pensioners receive a share of real economic growth in advance. Technically, this is achieved by adding discount rate X in formula (4), which is presumed as 1.5 percent. This leads to higher initial payments. The calculation shows that this number is the most suitable for increasing pension amounts as it leads to a smaller annuity factor and higher pensions. On the other hand, using a higher rate of long-term economic growth would cause a deficit in the pension insurance balance for the first years. For example, if the value of X was equal to 2 percent, the pension insurance balance would be negative in 2001, the first modelled year. Also, the number value of 1.5 percent is quite close to the Swedish case, which stands at 1.6 percent.
Scenarios of calculation. Based on the previous formulae, the performance of the pension system was calculated according to six scenarios. The accumulated amounts, benefits, and other indicators were calculated for the individuals who contributed to the simulated NDC scheme the same rate from the average wage for 35 years before retirement. Contribution rates were taken in the terms of the years before 2019 (i.e., before the “tax revolution” spoken of previously). Since 2001, the pension amounts have been calculated for retiring persons each year. Pensions for persons who retired earlier than 2001 were transferred to the NDC scheme, too. It was performed by equating the benefits to the calculated pensions for the retired in 2001. Since the statistical data of average wages are not available for the whole career of the persons who retired in the earliest years, it was assumed that the virtual capital for the year without statistical data is equal to the contributions from the earliest available average wage multiplied by years of participating in social insurance. It should not distort the model, as virtual capital would be indexed by the growth of the average wage as well.
The scenarios I–III presume that the whole old age pension system is changed into notional personal accounts; thus, that all old age pension contributions (18.41 percent of the wage) are paid to these accounts. The rate of 18.41 percent is calculated as 70 percent of the total pension insurance contribution (26.3 percent), because about 70 percent of total expenditures on pensions are used for old age pensions (the rest being used for the disabled and the survivors). The scenarios IV–VI presume that only 9.4 percent of the full old age pension insurance contributions are paid to notional personal accounts. The rest (9.01 percent) are paid as a tax, while the general part of the pension is financed from the state budget. The general part of pension is calculated by dividing the insurance fund accumulated from 9.01% of wages from a number of pensioners. Thus, this part is perfectly balanced.
Table 2. Calculated scenarios of the NDC system.
|
Scenario |
Contribution rate for the general part of pension |
Contribution rate for the individual (NDC) part of pension |
Balancing mechanism calculation |
Balance mechanism activation |
|
I |
None |
18,41% |
None |
None |
|
II |
An insurance balance rate of the average of three previous years’ pensions |
Is activated only when the balance rate is below 1 |
||
|
III |
Is activated every year, despite of the value |
|||
|
IV |
9.01% |
9.4% |
None |
None |
|
V |
An insurance balance rate of the average of three previous years’ pensions |
Is activated only when balance rate is below 1 |
||
|
VI |
Is activated every year, despite of the value |
Source: calculated by the authors.
A special balancing mechanism is foreseen in different scenarios. An index of balancing is calculated as an average of the three past years’ social insurance incomes and expenditures’ ratios. In scenarios II and V, the index of balancing would be applied only if the three past years’ incomes were smaller than the expenditures on pensions paid, which means that the index is less than 1. The activation of the balancing mechanism means that pensions would be indexed not only by the growth of the average wage but by the balancing index as well. In scenarios III and VI, the index of the balancing mechanism would be applied every year, so that the surplus of the pensions’ social insurance balance be distributed between pensioners.
Results: amounts of pensions and the intercohortal differences. The modelled amount of pensions from 2001 to 2040 was calculated for all of the six scenarios. Figure 4 (see the line “before correction”) shows differences between the minimal and maximal pensions of persons who have same the history of contributions (having got the average wage during their whole 35-year-careers) but who became retired during different years. The scenarios III and VI are presented in the Fig. 4 because of the highest differences with the general part of pension (Scenario VI) and without it (Scenario III). However, a similar conclusion can be drawn throughout all of the scenarios.
For example, let us look at the modelled pension amounts for Scenario III in the year 2020. A person who retired in 2013 would get a 495 EUR monthly pension in 2020, but the person who retired in 2009 would receive only 202 EUR in the same year of 2020. It should be stressed that both of these pensioners had similar history of contribution, but the pensions would differ by 293 EUR in 2020. The difference in the minimal and maximal pensions of the same year between different cohorts is increasing almost every year. It is less visible in scenarios with general pension and more visible in scenarios where a balancing mechanism is possible with positive values.
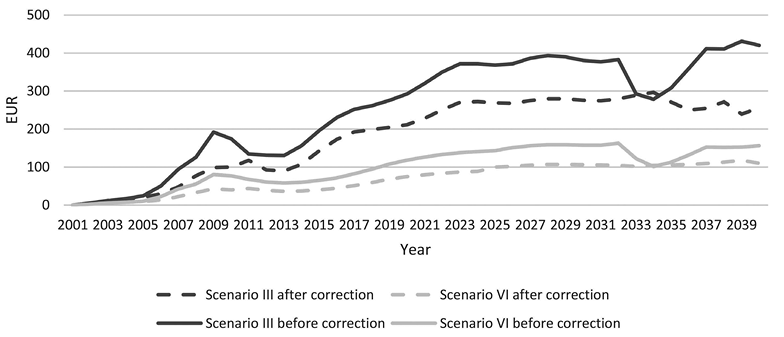
Fig. 4. Differences between the minimal and maximal pensions of pensioners who had average wages but retired during different years.
Source: calculated by the authors.
These differences might occur due to two reasons. First, a balancing mechanism is applied on the pensions’ benefits, and that causes the different indexations between benefits and capital. It means that the virtual capital and the amount of pensions are increasing on different levels. Thus, a balancing mechanism should be used not only on benefits but on virtual savings as well. Second, the annuity factor is calculated each year and it might be slightly different annually. Figure 5 shows the annuity factors calculated from 2001 to 2040. The trend of the annuity factor is increasing from 2001 to 2016 and from 2026 to 2040. This increase is caused by the growth of life expectancy. The higher annuity factor indicates that a pensioner will receive a smaller benefit because the virtual capital will be divided by a greater denominator. From 2016 to 2025, the annuity factors are decreasing because of the changes in pension age. The older a person retires, the shorter life expectancy is used in annuity calculation. It means that the pension of a person with the same virtual capital in 2016 will be smaller than in 2025. Therefore, people who retire before the increase of pension age will be in more a disadvantageous situation. Another finding in the dynamics of the annuity factor is the significant changes in 2006–2011. People who had retired during this period were born at the time of the Second World War, and the number of such people is generally lower. The annuity factor is calculated according to formulae (3) and (4); thus, a lower number of people who reach the pension age causes a higher annuity factor. In order to avoid this problem, a linear extrapolation during this period (see Fig. 5) was used to demonstrate a correct version of these calculations.
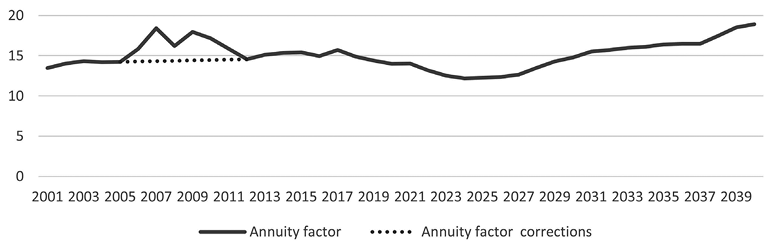
Fig. 5. Annuity factors.
Source: calculated by the authors.
After correcting annuity and applying a balancing mechanism not only on benefits but on virtual savings as well, new “corrected” pension amounts were calculated. The differences between the minimal and maximal pensions after the corrections for scenarios III and VI are showed in Figure 4 (dashed lines). The dorrections decreased these differences, especially in Scenario III, yet this does not solve the whole problem.
This finding suggests that one of the disadvantages of the NDC system is the difference in the amount of pensions between people of different cohorts but the same amount of contributions. After applying the corrections of virtual capital indexation and the annuity factor, differences between pensions decreased but still remained due to the changes of the pension age and life expectancy. If pensions had been indexed by a wage growth and balancing index as in Scenario III, the persons of different cohorts would have received benefits varied up to almost 300 EUR since 2023. Thus, this indexation method might be one of the least favorable in accordance with justice, although it creates a possibility to pay out the full balance surplus directly to the pensioners.
Results: balance of the pension system. The balances (measured as the ratios of assets and liabilities) of the system modelled in all six scenarios are represented in Figure 6. According to the results, all of the six scenarios indicate the rather different balances of the pension system, particularly until 2026. In later years, scenarios without a balancing index suggest that liabilities exceed assets each year, and in 2040, the system gives a 36% deficit in a scenario without any general pension and 22% – in a scenario that includes a general pension. Therefore, indexation without a balancing mechanism is not sustainable, and if Lithuania had applied the NDC pension model, it could have worked only until 2026, while the pension age was increasing. Thus, the NDC scheme, if applied without a balancing mechanism, is not suitable for Lithuania.
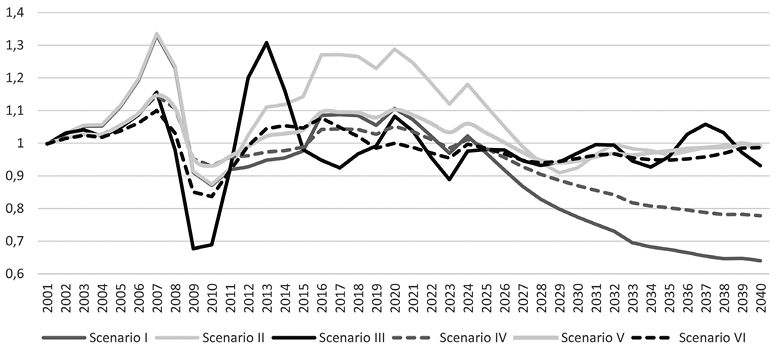
FIG. 6. The balance of pension insurance.
Source: calculated by the authors.
On the other hand, Scenarios II and III (do not include the general part of pension but have a balancing mechanism) indicate s quite high amplitude of system balance during the periods of fast economy growth or crisis. Those scenarios with general pensions help stabilize the system. Also, it is notable that Scenarios I/II and Scenarios IV/V show identical results before the balancing mechanism is activated in 2011. Scenario II allows to collect a very high surplus of the social security fund during the peak of an economy cycle. It is important to mention that during 2003–2007, a very high economy growth was visible in Lithuania. If the NDC system had been applied in Lithuania, it would have been indexed by wage growth, which would reach up to 20% per year, and the pension insurance fund would have collected even more money because of the significantly decreased unemployment rate, which was 17% in 2001 and only 4% in 2007. During the crisis years, the negative balance would had not been as deep. Also, the surplus from the previous years could had been used to balance the system. Scenario III does not create such a surplus, because if the system was to give a positive balance, pensions would then had increased. Due to the increased benefits, the balance would then become drastically negative in the beginning of the crisis. During 2009–2010, the deficit would approximately be 30%. Therefore, as it was mentioned previously regarding the differences in the amount of pensions, a balancing mechanism with positive impact possesses not only problems related to adequacy but with the sustainability of the whole system as well.
Results: replacement ratio. Results of the replacement ratio6 are presented in Figure 7. It is visible that the scenarios with general pension would have a smaller amplitude in the dynamics of replacement ratio. This is caused because of the higher level of redistribution in such scenarios. A pensioner who has contributed twice as much as the other pensioner would get twice the higher pension in scenarios I–III. However, in Scenarios IV–VI, the difference between these pensioners would proximately be 25%. Thus, the general pension is more suitable for people with lower income.
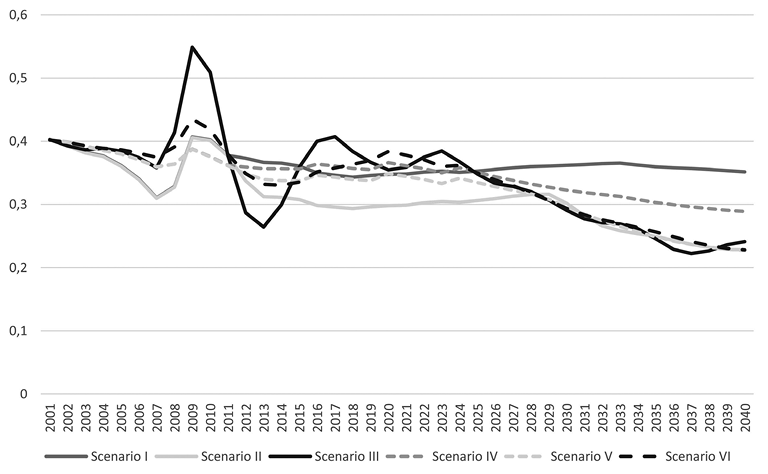
FIG. 7. The replacement ratio.
Source: calculated by the authors.
The replacement rate in all scenarios would start at 40% and would not be exceeded, excluding the ones with a positive balancing mechanism. In Scenario III, the years 2009 and 2010 would see the replacement rate at over 50%. These years were the peak periods of the crisis, but benefits were increased due to the very high growth of the economy in previous years. On the other hand, when an economy starts to grow after a crisis, pensions should be reduced because of the delayed indexation. It shows that the NDC system has a quite big lag between the real situation in an economy and the NDC system’s benefits. It may cause problems in both the sustainability and adequacy of social insurance. An almost same level of replacement would be kept in Scenarios I and IV during the analyzed period, but as it was mentioned previously, these scenarios have the highest level of uncertainty about sustainability and would see the most negative impact made on the pension insurance budget. On the other hand, the remaining scenarios provide a sharply decreasing replacement rate and, in the end of analyzed period, see it reaching only 22–24%. After the crisis, the replacement ratio decreased in all scenarios, and only the replacement rate of Scenario III managed to reach a 40% level in 2016 and 2017. However, it decreased as well during the later years and does not happen to be significantly different from the other scenarios.
6. Conclusions
Both the Lithuanian and Swedish old-age pension systems are composed with pay-as-you-go and funded components, which are supplemented with additional provisions for those who are not entitled for pension benefits at all or for whom these benefits are too low.
The individual earnings-related component in Swedish pensions is much more significant than in the Lithuanian analogue. The relatively low financing of the Lithuanian pensions results in the necessity to distribute the available budget more evenly in order to guarantee necessary subsistence for the recipients with low insurance records. Thus, the Lithuanian system is much more redistributive among the beneficiaries, and the flat component of the pension is much weightier. On the other hand, Lithuania’s fully funded “second pillar” pension component may accumulate relatively higher pension savings than the Swedish premium pension part due to the higher contribution rate and matching contribution. This partially offsets the domination of the redistributive part of the Lithuanian pay-as-you-go pension. Both the Swedish and Lithuanian pension benefits are calculated according to lifetime contributions. In both systems, pensions are indexed according to labor market performance, but this is taken into account in different ways: the growth rate of the Labor Compensation Fund in Lithuania vs. the real wage growth in Sweden. Also, both systems have formal rules on how to slow down or stop the indexation, but these rules are quite different: the Lithuanian system directly relies on macroeconomic indicators, while the Swedish one relies on these indicators indirectly using an automatic balancing mechanism.
An analysis of statistical data shows that the Swedish system provides better income protection and income smoothing during the life cycle in terms of the replacement rate, but it happens to be more unequal from the gender point of view than the Lithuanian one. Also, the percentage of the pensioners at risk of poverty is much higher in Lithuania than in Sweden (except for 2010–2011). The gender poverty gap is also bigger than in Sweden.
The main difference between how Lithuanian and Swedish pensions are calculated is in the difference between the “pension points” and the NDC approach. The model used to simulate the possible application of an NDC system in Lithuania found out a certain inequality effect of NDC: the people who have retired at different years would receive pensions of considerably different amounts despite them having had the same length of service and similar wages (compared with the average wages of each year). The main reason for this is the influence of the growing life expectancy. The NDC scheme, only because of its balancing index, is able to maintain financial sustainability, but fluctuations in such a system would be quite high because of the time lag between real economic development and its impact on pension indexation. It is a paradox, but a rapid increase in wages is not good for this system, as it generates high fluctuations in the system balance. From the viewpoint of the NDC system’s adequacy, despite the more clear indexation and better connection between contributions and benefits, it has no preference for countries facing demographic challenges since it does not help more than the other traditional systems (if well designed) to keep the replacement ratio on the same level.
References
Anderson K., Backhan M. (2013), ASISP Annual National Report 2014 Sweden.
Ahuja A. Effects of life courses on women’s pensions in Sweden. Peer review comment paper. November 2011. Retrieved from: http://ec.europa.eu/social/main.jsp?catId=1024&langId=en&newsId=1409&moreDocuments=yes&tableName=news
Bitinas, A., Maccioni, F. A., (2014) Lithuanian Pension System’s Reforms Transformations and Forecasts. Universal Journal of Industrial and Business Management 2(1)
Cichon M. (1999) Notional defined contribution schemes: Old wine in new bottles? International Social Security Review, Vol. 52, p. 87–105.
Fritzell, J., Heap, J., Nelson, K., Palme, J., Schon, P. (2018) ESPN Country Profile. Sweden 2017-2018.
Gudaitis, T. (2009). Research of Lithuanian pension system reform: from conception to first annuities. Management of Organizations: Systematic Research 49: 37–56.
Lazutka, R. (2008) Pensijų privatizavimo Lietuvoje tikslai ir rezultatai // Ekonomika (mokslo darbai), Vilnius: VU, 2008, Nr.1.
Lazutka, R. (ed.) (2013) Socialinis draudimas Lietuvoje: kontekstas, raida, rezultatai. Vilnius, 2013.
Lis M. (2018) Lithuania’s pension system in the international perspective. Bank of Lithuania conference “Lithuania’s pension system: how to ensure socially just and sustainable pensions?“. https://www.lb.lt/lt/renginiai/ekonomikos-konferencija-lietuvos-pensiju-sistema-kaip-uztikrinti-socialiai-teisinga-ir-tvaria-pensija
Medaiskis, T. (2001). Changing the financing of Lithuanian pensions system. International Social Security Review, vol 54, no 2–3, 2001. ISSN 0020-871X. Retrived from: http://onlinelibrary.wiley.com/doi/10.1111/issr.2001.54.issue-2-3/issuetoc
Medaiskis, T. (2011) Pensions at the Time of Recession. The Case of Lithuania. Zeitschrift fur Socialreform (Journal of Social Policy Research), 57. Jahrgang (2011), Heft 3, p.251–266. ISSN 0514-2776.
Medaiskis, T., Gudaitis, T. (2013) Assessing The Impact Of Second Pillar Component On Old Age Pension in Lithuania. Ekonomika, vol. 92(4). ISSN 1392-1258. Retrived from: http://www.zurnalai.vu.lt/ekonomika/article/view/2344
OECD (2018), Net pension replacement rates (indicator). Retrived from: https://www.oecd-ilibrary.org/finance-and-investment/net-pension-replacement-rates/indicator/english_4b03f028-en (Accessed on 27 November 2018)
OECD (2018), Gross pension replacement rates (indicator). Retrived from: https://www.oecd-ilibrary.org/finance-and-investment/gross-pension-replacement-rates/indicator/english_3d1afeb1-en (Accessed on 27 November 2018)
Orange Report 2017 (2018). Swedish Pensions Agency. Stockholm, 2018.
Palmer, E. (2014) Financial Sustainability of Swedish Welfare Commitments. Policy Research Institute, Ministry of Finance, Japan, Public Policy Review, Vol.10, No.2
Pensijų skaičiavimo būdo analizė ir valstybinių pensijų reformos koncepcija (2012). Mokslinio tyrimo baigiamoji ataskaita. R. Lazutka, T.Medaiskis, D.Skučienė ir kt. Retrived from: https://socmin.lrv.lt/uploads/socmin/documents/files/pdf/743_2_baigiamoji-pensiju-ataskaita.pdf
Pensions Myndigheten (2018). Statisticdatabas. Retrived from: https://www.pensionsmyndigheten.se/statistik/pensionsstatistik/
Scherman, K.G. (2007) The Swedish NDC System – A Critical Assesment. The 2nd Colloquim of the Pension, Benefits and Social Security Section of the Actuarial Association. Helsinki, May 2007.
SEB tyrimas: gyventojai mažiau tiki pensijų sistema ir pensija ima rūpintis patys (2017). Retrived from: https://www.seb.lt/naujienos/2017-02-07/seb-tyrimas-gyventojai-maziau-tiki-pensiju-sistema-ir-pensija-ima-rupintis
Swedish old-age pension system (2016). Ministry of Health and Social Affairs. Stockholm, December 2016.
Whitehouse, E. (2010), “Decomposing Notional Defined Contribution Pensions: Experience of OECD Countries’ Reforms”, OECD Social, Employment and Migration Working Papers, No. 109, OECD Publishing, Paris. Retrived from: http://dx.doi.org/10.1787/5km68fw0t60w-en
1 This article was prepared under the framework of the project “Challenges to the Welfare State Systems in Lithuania and Sweden,” which is financed by the Research Council of Lithuania (No. S-MIP- 17-130).
2 Eurostat table [gov_10a_main], 2018.
3 Calculated as the Lithuanian old age pension expenditure percent 5.4 divided by 34.1 and multiplied by 49.7.
4 https://ec.europa.eu/eurostat/tgm/web/table/description.jsp.
5 Eurostat table [proj_15npms], 2018.
6 The ratio between the average pension and the average wage of the same year.