Ekonomika ISSN 1392-1258 eISSN 2424-6166
2019, vol. 98(1), pp. 81–95 DOI: https://doi.org/10.15388/Ekon.2019.1.5
Are there Multiple Bubbles
in the Stock Markets? Further Evidence
from Selected Countries
Assoc. Prof. Dr. Feyyaz Zeren*
Yalova University, Turkey
Assoc. Prof. Dr. Veli Yilanci
Sakarya University, Turkey
Abstract. In this study, the existence of multiple bubbles in 15 selected countries is researched by means of the GSADF unit root test developed by Phillips, Shi, and Yu (2015). The data set consists of a weighted average of the monthly price/earnings ratios with the different start dates for countries whose data could accessed. As a result of the conducted analysis, the existence of multiple bubbles was detected for all the countries examined. The results demonstrate that bubbles in stock markets occur before the local and global crisis periods. We therefore conclude that the GSADF method may be used as one of the early warning systems of a financial crisis. It is significant for policymakers and investors to know these signs in terms of financial stability and profitable investments.
Keywords: Multiple Bubbles, Price / Earnings Ratio, Financial Crisis, GSADF Unit Root.
* Corresponding author:
Faculty of Economics and Administrative Sciences, Department of International Trade and Finance,
Yalova University Main Campus, On Çınarçık Road, 77200, Yalova/Turkey.
Email: feyyaz.zeren@yalova.edu.tr
Received: September 2018. Revised: December 2018. Accepted: January 2019
Copyright © 2019 Feyyaz Zeren, Veli Yilanci. Published by Vilnius University Press
This is an Open Access article distributed under the terms of the Creative Commons Attribution Licence, which permits unrestricted use, distribution, and reproduction in any medium, provided the original author and source are credited.
1. Introduction
Traditionally, under rational expectations and the rational behaviors of market factors, assets are priced appropriately in terms of real value. However, many recent studies have proven that the price dynamics of assets can include foams, and excessive volatility in price behavior can occur due to these foams (Al-Anaswah and Wilfling 2011: 1073). In this context, stock prices are an important economic indicator if the markets are effective. However, if the markets are affected by the actions of speculative traders, it is possible that the problems are unfolding. Because speculators, as financial actors benefiting from the movements of price increases and decreases, are up for creating bubbles (Mokhtar 2006: 103). In such a case, probable deviations from the core values indicate that the markets have lost their effectiveness and that there are bubbles in these markets (Çağlı and Mandacı 2017: 64).
Bubbles can be classified according to three different categories. Accordingly, bubbles are defined as internal and external bubbles, rational and irrational bubbles, and finally, explosive and non-explosive bubbles (Yuhn et al. 2015: 256). Internal bubbles are presented as bubbles following the principals of an effective market, which change in parallel with market factors; external bubbles are formed by influencing psychological factors and are considered as the representatives of behavioral finance flows (Arshanapalli and Nelson 2016: 29). According to the second categorization, rational bubbles are the result of rational expectations, while irrational bubbles are the result of the irrational behavior of the traders. According to the third and final categorization, the explosive properties of explosive bubbles are high, while non-explosive bubbles are bubbles that apparently foam but are not explosive (Yuhn et al. 2015: 256).
One of the oldest-known bubbles is the Tulip Mania, or the Tulip Bubble, that occurred in the Netherlands in 1637. During this period, the prices of tulip bulbs in the Netherlands soared so much that a skilled craftsman was able to increase his income tenfold by receiving contracts based on tulips. The Mississippi Bubble (1927), the Asian Countries Estate and the Stock Bubble (1992–1997), the Dot-Com Bubble (the Internet Bubble) at the end of the 1990s, the Mortgage Housing Bubble (2008–2012), and the Greek Government Debt Crisis (2011) are among the most important bubble examples in history.
The aim of this study is to test the existence of bubbles in some selected countries where the price earnings can be accessed accurately. For this purpose, analyses were carried out by means of the GSADF unit root test. A literature review of the studies focused on bubble testing, an explanation of the econometric method used, data, and the empirical findings are presented in the following parts of the paper.
2. Literature review
According to a review of relevant literature, the study by Diba and Grossman (1985) is one of the pioneering works examining the existence of stock market bubbles. The researchers, using the Dickey-Fuller (DF) test, found no financial bubbles in their study. On the other hand, Evans (1991) found that bubbles may occur periodically rather than at all times. In another study, Charemze and Deadman (1995), examining the non-linearity of the bubbles, detected findings that prove that bubbles could emerge periodically rather than reaching any judgment for the whole time period studied, such as in unit root tests.
In a study of the basic level ADF and KPSS unit root tests, Juntilla (2003) identified the presence of bubbles in the information technology sector in the Finnish stock market. These findings are valid for the monthly data of the 1997–2000 period. Hom and Breitung (2012) used the Chow-type Dickey-Fuller test to identify bubbles on the NASDAQ Stock Market. An analysis of the 1973–2005 period reveals the existence of explosive bubbles after the first half of 1995.
Mokhtar et al. (2006), using Weibull’s logarithmic logistic hazard model, determined rational speculative bubbles in the Malaysian stock market before and after the 1997 Asian financial crisis.
Capelle Blancard and Raymond (2004) used cointegration tests with monthly data from 1973–2002 in their studies of markets in France, Germany, Japan, the United Kingdom, and the United States. The speculative bubbles were proved in the findings of the study. Chang et al. (2007) examined the existence of bubbles in the United States stock markets in their study of the 1871–2002 period with the help of traditional Johansen cointegration and nonparametric Bierens (1997) cointegration tests. According to the results obtained, the Johansen test found a bubble in the market, while Bieren’s (1997) test determined no bubbles in the financial markets.
Ahmed et al. (2010) have tried to identify nonlinear speculative bubbles using the Hamiltonian regime switch and a rescaled interval analysis in their study of 27 developing countries for the 1990–2006 period. According to the findings, the presence of bubbles was observed in 22 countries. Anderson et al. (2010), using Markov regime switching models, found that the presence of bubbles shows sectoral differences in the S&P 500 index. In another study using Markov models, Al-Anaswah and Wilfling (2011) found that the presence of bubbles is valid for speculative periods for the United States, Brazil, Indonesia, Malaysia, and Japan. Balcilar et al. (2016) used the Markov regime switching models in their study and found speculative bubbles in the South African Johannesburg stock market.
Chen and Quan (2013) used traditional PP and KPSS unit root tests and Engel-Granger and Johansen cointegration tests to investigate the presence of bubbles in Asian countries. As a result of studying different data ranges, the presence of bubbles for the Japanese, Singaporean, Korean, Taiwanese, Thai, Malaysian, Indonesian, and the Philippine stock markets was determined, while the analysis showed no bubbles in the Hong Kong Stock Market. Bozoklu and Zeren (2013) studied the presence of rational bubbles in Turkish markets using a hidden cointegration technique. According to the findings, it has been determined that there is a cointegration relation between the price index and the return index and that there accordingly are no rational bubbles. Yuhn et al. (2015) report the results of studying three major events on the US market (Black Monday (1987), the Information Technology Explosion (2000), and the Housing Market Explosion (2008)). The results show that bubbles for the S&P are only observed during the Mortgage Housing Crisis, while bubbles in prices for the NASDAQ index are observed for the Black Monday and the Housing Crisis periods. In this study, traditional PP unit root and Johansen cointegration tests were used.
Chen et al. (2016) examined whether the bubbles are seen periodically in the United States, Belgium, Denmark, and Finland with the help of MTAR and LNV-MTAR models. The findings found no bubbles in the stock markets of these countries.
Chang et al. (2015) examined the presence of multiple bubbles by using the GSADF unit root (2013) test in their study of BRICS stock markets. As a result of the study, in which the monthly data are used for the share prices and the profit share distribution ratios, it has been understood that the bubbles in the stock markets of these countries have occurred in the case of specific events. Chang and Cai (2016) also obtained similar findings for the Shanghai and Shenzhen markets using the GSADF method. Liu et al. (2016) used the SADF (2011) and GSADF (2013) tests in their study of the Shanghai market. According to the SADF test, only one bubble can be mentioned, while two bubbles were detected with the GSADF test in the period of 2014–2015 and the period of the mortgage crisis. In another study where the SADF and GSADF tests were used, Arshanapalli and Nelson (2016) examined the S&P 500 index for the 1960–2014 period. According to the conducted analyses, the SADF test showed no multiple bubbles, while the GSADF test showed that bubbles were observed in 1974 and 1987. Hu and Oxley (2017) investigate the price movements of southern seafarers in the United States by using the GSADF test. The results of the study determined the presence financial bubbles in the prices of the mentioned firms. The study by Çağlı and Mandacı (2017) examines the different sectors of the Istanbul Stock Market using the GASDF test and identifies the existence of rational bubbles.
A summary of the studies described up to this point is presented in Table 1:
Table 1. Literature Review
|
Source |
Stock Market |
Data (Frequency) |
Method |
Is There a Bubble? (Yes: √, No: X) |
|
Diba and Grossman (1985) |
USA |
1871–1980 (annual) |
Dicker-Fuller Unit Root |
X |
|
Evans (1991) |
USA |
1871–1980 (monthly) |
Engel Granger Cointegration |
It exists periodically |
|
Charemze and Deadman (1995) |
Poland |
1871–1988 (weekly) |
STER Method |
It exists periodically |
|
Juntilla (2003) |
Finland |
1997–2000 (monthly) |
ADF and KPSS Unit Root |
√ |
|
Capelle Blancard and Raymond (2004) |
French, Germany, Japan, UK and USA |
1973–2002 (monthly) |
Engel Granger Cointegration |
√ |
|
Mokhtar et al. (2006) |
Malaysia |
1994–1996 (monthly) 1999–2003 (monthly) |
Weibull’s Logarithmic Logistic Hazard Models |
√ |
|
Chang et al. (2007) |
USA |
1871–2002 (annual) |
Johansen and Bierens cointegration |
Johansen > √ , Bierens > X |
|
Ahmed et al. (2010) |
27 Developing Countries |
1990–2006 (daily) |
Hamilton Regime Switch and Rescaled Interval Analysis |
22 countries > √ , 5 countries > X |
|
Anderson et al. (2010) |
USA |
1973–2004 (monthly) |
Markov Regime Switching Model |
It varies according to sectors |
|
Al-Anaswah and Wilfling (2011) |
USA, Brazil, Indonesia, Malaysia and Japan |
Different starting points – 2004 (monthly) |
Markov Regime Switching Model |
It exists in speculative times. |
|
Hom and Breitung (2012) |
USA |
1973–2005 (monthly) |
Chow Type Dickey Fuller |
It exists after 1995Q1 |
|
Chen and Quan (2013) |
9 Asian Countries |
Different starting points – 2011 (monthly) |
Engel-Granger and Johansen Cointegration |
Hong Kong > X , Others> √ |
|
Bozoklu and Zeren (2013) |
Turkey |
1998–2013 (monthly) |
Hidden Cointegration |
X |
|
Chang and et al. (2015) |
BRICS |
1990–2013 (monthly) |
GSADF Unit Root |
It exists at specific times |
|
Yuhn et al. (2015) |
USA |
1987–2007 (monthly) |
Johansen Cointegration |
S&P > √ in Mortgage, NASDAQ > √ in Black Monday and Mortgage |
|
Balcılar et al. (2016) |
South Africa |
1954–2015 (monthly) |
Markov Regime Switching Model |
√ |
|
Chen et al. (2016) |
USA, Belgium, Denmark and Finland |
Different starting points – 2012 (monthly) |
MTAR and LNV-MTAR Unit Root Tests |
X |
|
Chang and Cai (2016) |
Shanghai and Shenzhen |
1990–2016 (weekly) |
GSADF Unit Root |
√ |
|
Liu et al. (2016) |
Shanghai |
2000–2015 (monthly) |
SADF and GSADF Unit Root |
SADF > √, GSADF > √ in 2008 2014 and 2015 |
|
Arshanapalli and Nelson (2016) |
USA |
1960–2014 (monthly) |
SADF and GSADF Unit Root |
SADF > X GSADF > √ in 1974 and 1987 |
|
Hu and Oxley (2017) |
USA South Sea Firms |
1719–1720 (daily) |
GSADF Unit Root |
√ |
|
Çağlı and Mandacı (2017) |
Turkey |
2006–2016 (monthly) |
GSADF Unit Root |
√ |
When the studies were examined, the surplus of applications on the S&P 500 became noteworthy. In terms of methodology, methods such as Cointegration and the Markov Regime Change model are mainly used until the year 2010, and after that, the findings obtained with the new generation of unit root tests used in bubble detection, such as SADF, RADF, and GSADF, are becoming more prevalent.
However, in determining critical values, the method developed by Harvey et al. (2016), which processes data by taking all kinds of variance problems into account, has been seen on any work done with the SADF, RADF GASDF tests. In this paper, the Harvey et al. (2016) method, used with the GSADF test, is a sufficient method to detect multiple bubbles. This situation point outs the specificity of the study when compared with the previous studies.
3. Econometric methodology
The discovery of speculative bubbles in stock prices is seen as a challenging process in studies using long-term historical data. One way to determine the presence of a bubble in a market is to test the stability of the stock prices. This situation has prompted researchers to seek new methods to determine if this ratio is stationary. In this context, unit root tests using autoregressive models are widely used to determine if a series is stationary. To do this, the first method used is the simplest traditional, left-tailed Dickey Fuller test (DF), which realizes a first-order autoregressive AR estimation.
If, according to this model, the residuals in the autoregressive model from the first order are still related, the test can be extended with ΔPt-1 for autoregressive processes at the high level.
On the contrary, the right-tailed SADF unit root test proposed by Phillips et al. is based on the following regression when evaluated in the context of the DF test:
∆pt = ∝ + (β –1)pt –1 + ϵt + ϵt ~ iid (0, σ2)
The H0 hypothesis represents the absence of a unit root and bubble, while the H1 alternative hypothesis represents explosive behavior or bubble presence.
H1 = β > 1 (right-tailed)
The SADF test performs a hypothesis test based on the secondary value of the ADF statistical series by repeatedly estimating the ADF model over a series of forward-expanding samples.
The window size (rw) is spreading from r0 to 1. Here, r0 is the smallest sample window, while 1 is the largest sample window, tellingly the total sample size. R1, the starting point of the sample directory, is fixed at “0.” Thus, the end point of each sample, r2, is equal to rw, and r1 changes from r0 to 1. Here is the ADF statistic of a sample running from 0 to r2:

Phillips et al. (2011) repeatedly apply the right-tailed ADF test to a forward-spreading sample sequence and infer from the critical value of the corresponding ADF statistical sequence. Thus, the SADF test of Phillips et al. (2011) appears to significantly increase its power compared to tests investigating the presence of traditional, cointegration-based bubbles. This test also provides a timing strategy for the identification of bubble formation and termination points.
The SADF test seems to be inconsistent and insufficient to elicit the presence of bubbles when used in an analysis of long-time series and rapidly changing market data. The cause of this is that the SADF test can detect only one bubble. If there is more than one bubble in the examined data range, the SADF test remains incapable. In order to come up with this deficiency of the SADF test, a new approach has also been proposed by Phillips et al. (2015) – the generalized sub-ADF (GSADF) test.
The GSADF test is based on a repeatedly applied right-tailed ADF test as in the SADF test. However, the sample sequence of the GSADF test is based on a wider and more flexible range. Instead of fixing the initial observation of the sample in the GSADF test, the starting and ending points of the sample are spread over the possible and flexible window. Besides, the GSADF is a sufficient method for detecting multiple bubbles. This test takes structural breaks and non-linearity into account (Çağlı and Mandacı 2017: 66).
The sample index in the SADF and GSADF tests is designed to capture the explosive behavior seen in the entire sample and to ensure that there is sufficient observation for initiating self-renewal. For this reason, the GSADF test includes more sub-examples of the data and has greater window flexibility. For this reason, it is a more effective method for revealing explosive behaviors in big data.
The main idea of the GSADF test is based on the repeated application of the ADF test regression to a sample sequence, as in the SADF test. However, the sample index of the GSADF test is an expanded version of the SADF test’s sample index. The GSADF allows the test start points (r1) to change within a possible range (from 0 to r2-r0), while the end point of the regression changes from r2 to r0 to 1. Sample sequences of the SADF and GSADF tests are shown in Figure 1.
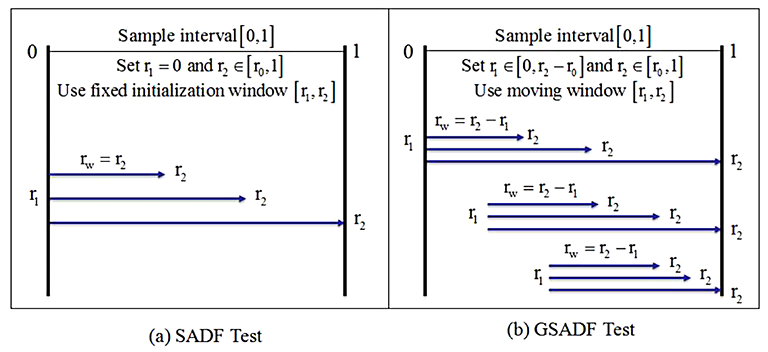 Figure 1. Sample Ranges for the SADF and GSADF tests.
According to Phillips et al. (2015), GSADF is defined as:
Similar to the SADF statistic, the smallest window size in the asymptotic GSADF distribution depends on r0. In practice, the deciding factor should be based on “T,” the total number of observations of r0. If the “T” is small; r0 should be chosen to be large enough to ensure that sufficient initial observations can be made. If “T” is greater, r0 can be set to a smaller value so as not to overlook any early explosive event.
The GSADF test is a time-varying RADF test with a double-support window selection system. Unlike the SADF test developed by Phillips et al., a window size is selected using the double support window selection system, and the ADF test is applied to sample the indexes in a window frame feature that progressively moves up to the last sampling.
The SADF test is inadequate in locating bubbles when there is a collapse at sample boundaries and where multiple excesses are involved. The GSADF test is also effective in locating bubbles in such cases; it is also good at providing significant advantages in long-running series (Zeren and Ergüzel 2015: 45).
In the determination of critical values, the method developed by Harvey et al. (2016), which processes data by taking all kinds of variance problems into account, has been followed.
4. Data and empirical findings
The study used a weighted average of price/earnings ratios on a monthly basis, consisting of different start dates for 15 countries whose data were accessed accurately to determine whether bubbles were formed in stock prices. The earliest start date is January 1991, and the latest end date is September 2017 for all countries excluding the DAX stock market in Germany. The data ranges used for the mentioned stock markets are presented in Table 2.
Table 2. Stock Market Dataset
|
Country |
Data Range |
Country |
Data Range |
|
Turkey |
01-1991 / 09-2017 |
China |
08-1996 / 09-2017 |
|
USA |
01-1991 / 09-2017 |
Korea |
01-1998 / 09-2017 |
|
Australia |
01-1991 / 09-2017 |
Jordan |
09-1999 / 09-2017 |
|
India |
01-1991 / 09-2017 |
Chile |
01-2003 / 09-2017 |
|
Spain |
06-1991 / 09-2017 |
Czech Republic |
01-2004 / 09-2017 |
|
Indonesia |
01-1992 / 09-2017 |
Egypt |
04-2004 / 09-2017 |
|
UK |
07-1993 / 09-2017 |
Germany |
03-2005 / 10-2014 |
|
Philippines |
10-1994 / 09-2017 |
|
|
All the data were accessed from www.datastream.com, and Eviews 10 packaged software was used for the analyses. The GSADF test, developed by Phillips et al. (2015), was used to identify the financial bubbles. The minimum window size was calculated using the formula  . The method developed by Harvey et al. (2016), which processes data by taking all kinds of variance problems into account, has been followed in the determination of critical values. A bootstrap simulation was performed with 2000 repetitions. In addition, due to the trendy course in the prices, the analysis results were obtained on fixed and trendy model. The results of the GSADF test are presented in Table 3 and Figures 2–16.
Table 3. GSADF Test Results
|
Stock Market |
Test Statistics |
CV %1 |
CV %5 |
CV %10 |
|
Germany |
0.03 |
2.42 |
2.42 |
2.42 |
|
Czech Republic |
-0.23 |
2.60 |
1.57 |
1.16 |
|
Chile |
0.35 |
2.03 |
1.28 |
0.76 |
|
Korea |
0.61 |
2.01 |
1.23 |
0.92 |
|
China |
2.73 |
3.86 |
2.6 |
1.98 |
|
Jordan |
1.80 |
1.54 |
0.90 |
0.76 |
|
UK |
3.30 |
4.32 |
3.41 |
2.99 |
|
Spain |
3.75 |
2.19 |
1.33 |
0.85 |
|
Philippines |
-0.27 |
0.94 |
0.36 |
0.09 |
|
Indonesia |
-0.59 |
3.15 |
1.97 |
1.36 |
|
Egypt |
-0.16 |
2.79 |
1.62 |
1.15 |
|
Australia |
0.35 |
1.60 |
0.97 |
0.63 |
|
USA |
1.49 |
2.26 |
1.59 |
1.59 |
|
Turkey |
0.38 |
0.43 |
0.06 |
0.06 |
|
Egypt |
1.56 |
2.41 |
2.41 |
2.41 |

Figure 2. Germany

Figure 3. Czech Republic
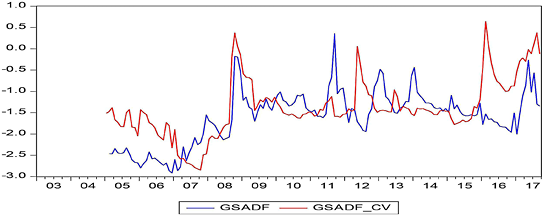
Figure 4. Chile
Figure 5. South Korea
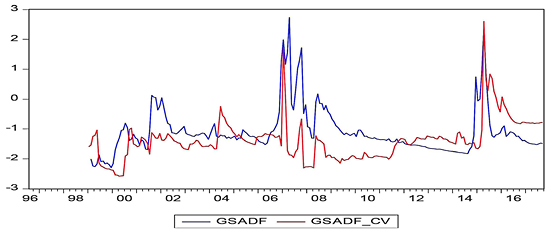
Figure 6. China
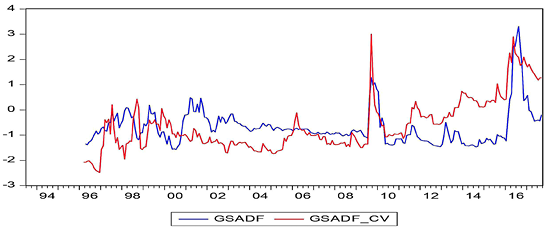
Figure 7. United Kingdom
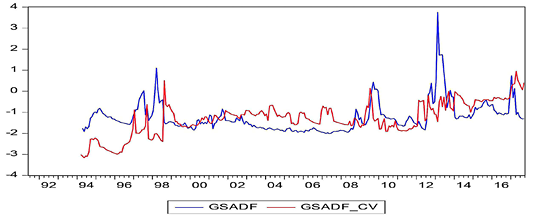
Figure 8. Spain
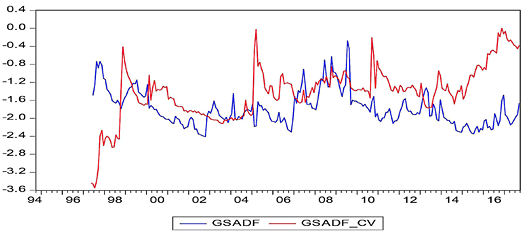
Figure 9. Philippines
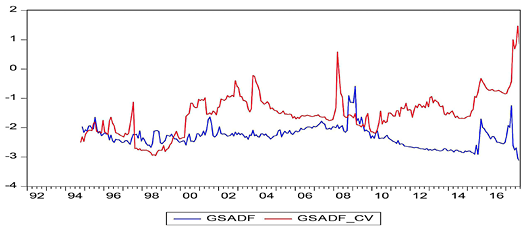
Figure 10. Indonesia
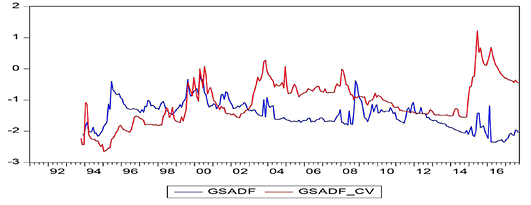
Figure 11. India

Figure 12. Egypt
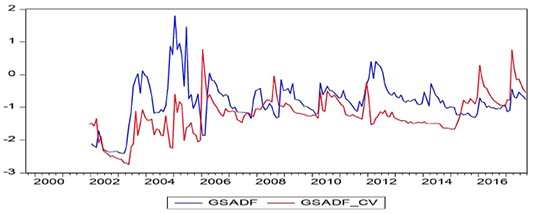
Figure 13. Jordan
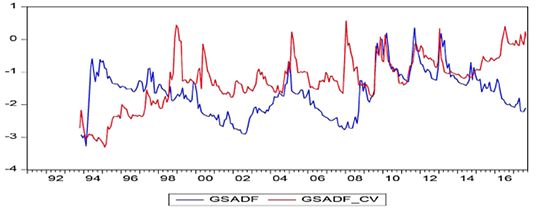
Figure 14. Australia
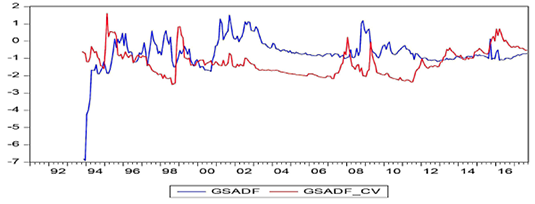
Figure 15. United States
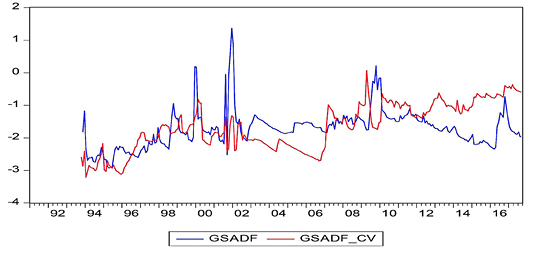
Figure 16. Turkey
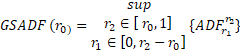
In these figures, while the GSADF values bigger than the GSADF Critical Values indicate the existence of bubbles, the GSADF values that appear less than the GSADF critical values show no existence of bubbles. According to the obtained results, it was determined that the bubbles occurred before economic and financial crisis periods for almost all countries. The best evidence for this result is the presence of a price bubble in nearly all countries before the 2008 economic crisis. The aforementioned bubble spanned more than three to four years in some countries in the aftermath of the mortgage crisis while being shorter for other countries. On the other hand, the bubbles were seen as appearing in the South Korean, Chinese, Philippine, and Indian stock markets before the 1997 East Asian Financial Crisis. The effects of the debt crisis, which had started in some EU member countries since the end of 2009, are also reflected in the findings of the Spanish stock market, as can be seen in Figure 8. On the other hand, Greece, Portugal, and Ireland, which are not able to pay their debts as part of the European debt crisis, are not included in this study as the respective price/earnings data cannot be accessed accurately.
Apart from this, price bubbles can be seen to occur in the context of local crises. For example, during the 2000–2001 period, which is known as the Twin Crises, serious price bubbles in the markets of Turkey can be clearly seen in Figure 16. Similarly, the Dot-Com crisis in the United States, which spanned the period of 2000 to 2002, is visibly reflected in Figure 15.
5. Concluding remarks
Financial bubbles have been an important research topic throughout history, starting with the well-known Tulip Mania to the devastating Mortgage Crisis. These bubbles are used to forecast financial crises, because the persistence of the financial bubbles results in financial crises. In this study, the presence of multiple price bubbles in the primary stock markets of 15 countries is examined using a generalized sub-ADF test that was introduced by Phillips et al. (2015). A method developed by Harvey et al. (2016), which processes data by taking all kinds of variance problems into account, has been followed in the determination of critical values. Using the GSADF test ,we can not only identify the multiple bubbles but also the starting and ending dates of the bubble periods. Our usage of the Harvey et al. (2016) method in particular emphasizes the specificity of this paper when compared to previous studies, because other papers use traditional methods in determining critical values.
The obtained results show that multiple price bubbles exist in the stock markets. The date ranges of these bubbles indicate the local and global financial crises, particularly the bubbles in almost all the stock markets before the 2008 Financial Crisis. On the other hand, our test results show the effect of bubbles in the stock markets of China, Egypt, the Philippines, and South Korea before the 1997 Asian financial crisis. When we focus on the effects of local financial crises, we are able to observe bubbles in the Turkish stock market before the Turkish 2000-01 Banking Crisis period and in the stock market of USA before the 2000–2002 Dot-Com Crisis period.
The close relationship shared between stock market bubbles and financial crises is based on severe price declines following the disappearance of price bubbles. According to the findings, bubbles are one of important estimators of financial crises. This is because bubbles cause financial and macroeconomic instability. Moreover, many financial crises arise after the bubbles have occurred. In this context, the newest bubble testing GSADF method, which can accurately determine multiple bubbles, may be among the earliest warning systems of an impending financial crisis. It is important for policymakers, governments, and investors to know these signs in order to ensure financial stability, take measures against any possible financial crises, and conduct profitable investments. In addition, it has been proved that in periods when stock price bubbles occur, the effective market hypothesis is proved to fall short.
The findings of this study are similar to those of Evans (1991), Charemze and Deadman (1995), which used different techniques, and Chang et al. (2015), which used the GSADF method. Future studies could provide investors with both firm- and sector-based ideas by using firm- and sector-based price/earnings data. Thus, investors may have the opportunity to create more optimal portfolios.
References
Ahmed, E. J., Rosser, B. and Uppal, J. Y. (2010). Emerging Markets and Stock Market Bubbles: Nonlinear Speculation?, Emerging Markets Finance and Trade, 46, 4, 23-40. https://doi.org/10.2753/REE1540-496X460402
Arshanapalli and Nelson (2016). Testing for Stock Price Bubbles: a Review of Econometric Tools, The International Journal of Business and Finance Research, 10, 4, 29-42.
Al-Anaswah, N. and Wilfling, B. (2011). Identification of Speculative Bubbles Using State-Space Models with Markov-Switching, Journal of Banking & Finance, 35, 1073-1086. https://doi.org/10.1016/j.jbankfin.2010.09.021
Anderson, K., Brooks, C. and Katsaris, A. (2010). Speculative Bubbles in the S&P 500: Was the Tech Bubble Confined to the Tech Sector, Journal of Empirical Finance, 17, 1-28. https://doi.org/10.1016/j.jempfin.2009.12.004
Balcılar, M., Gupta, R., Jooste, C. and Wohar, M. (2016). Periodically Collapsing Bubbles in the South African Stock Market, University of Pretoria Department of Economics Working Paper Series, 1 20.
Bozoklu, Ş., and Zeren, F. (2013). Türkiye Hisse Senedi Piyasasında Rasyonel Köpükler: Saklı Eş Bütünleşme Yaklaşımı, Finansal Araştırmalar ve Çalışmalar Dergisi, 5, 9, 17-31.
Capelle-Blancard, G. and Raymond, H. (2004). Empirical Evidence on Periodically Collapsing Stock Price Bubbles, Applied Economics Letters, 11, 1, 61-69. https://doi.org/10.1080/1350485042000187480
Chang, T., Chiub, C. C. and Nieh, C. C. (2007). Rational Bubbles in the US Stock Market? Further Evidence from a Nonparametric Cointegration Test, Applied Economics Letters, 14, 517-521. https://doi.org/10.1080/13504850601103221
Chang, T., Chia, F., Ranjbar, O., Aye, C. and Gupta, R. (2015). Testing for Multiple Bubbles in the BRICS Stock Markets, University of Pretoria Department of Economics Working Paper Series, 1-23.
Chang, T. and Cai, Y. (2016). Do Bubbles exist in Chinese Share Markets?, International Review of Accounting, Banking and Finance, 8, 43- 54.
Charemza, W. and Deadman, D. (1995). Speculative Bubbles with Stochastic Explosive Roots: The Failure of Unit Root Testing. Journal of Empirical Finance, 2, 2 153-163. https://doi.org/10.1016/0927-5398(94)00015-9
Chen, Y. H. and Quan, L. (2013). Rational Speculative Bubbles in the Asian Stock Markets: Tests on Deterministic Explosive Bubbles and Stochastic Explosive Root Bubbles, Journal of Asset Management, 14, 3, 195-208. https://doi.org/10.1057/jam.2013.13
Chen, S., Hsu, C. and Xie, Z. (2016). Are There Periodically Collapsing Bubbles in the Stock Markets? New International Evidence, Economic Modelling, 52, 442-451. https://doi.org/10.1016/j.econmod.2015.09.025
Çağlı, E. Ç. and Mandacı, P. E. (2017). Borsa İstanbul’da Rasyonel Balon Varlığı: Sektör Endeksleri Üzerine Bir Analiz, Finans Politik & Ekonomik Yorumlar, 54, 629, 63-76.
Diba, B. T. and Grossman, H. I. (1985). Rational Bubbles in Stock Prices? NBER Working Paper Series, No: 1779, 1-23.
Evans, G. W. (1991). Pitfalls in Testing for Explosive Bubbles in Asset Prices, The American Economic Review, 8, 4, 922-930.
Harvey, D. I., Leybourne, S. J., Sollis, R., and Taylor, A. R. (2016). Tests for Explosive Financial Bubbles in the Presence of Non-stationary Volatility. Journal of Empirical Finance, 38, 548–574. https://doi.org/10.1016/j.jempfin.2015.09.002
Hom, U. and Breitung, J. (2012). Testing for Speculative Bubbles in Stock Markets: a Comparison of Alternative Methods, Journal of Financial Econometrics, 10, 1, 1, 198-231
Hu, Y. and Oxley, Y. (2017). Do 18th Century ‘Bubbles’ Survive the Scrutiny of 21st Century Time Series Econometrics?, Economic Letters.
Juntilla, J. (2003). Detecting Speculative Bubbles in an IT-intensive Stock Market, Journal of Economics and Finance, 27, 2, 166-189. https://doi.org/10.1007/BF02827217
Liu, Z., Han, D. and Wang, S. (2016). Testing Bubbles: Exuberance and Collapse in the Shanghai A-share Stock Market, China’s New Sources of Economic Growth: Reform, Resources and Climate Change, Chapter 11. The Australian National University Press. 247-269.
Mokhtar, S. H., Nassir, A. M. and Hassan, T. (2006). Detecting Rational Speculative Bubbles in the Malaysian Stock Market, International Research Journal of Finance & Economics, 6, 102-115.
Phillips, P. C. B., Wu, Y. and Yu, J. (2011). Explosive Behavior in The 1990s Nasdaq: When Did Exuberance Escalate Asset Values?, International Economic Review, 52, 1, 201-226. https://doi.org/10.1111/j.1468-2354.2010.00625.x
Phillips, P. C. B., Shi, S. P., and Yu, J. (2015). Testing for Multiple Bubbles: Historical Episodes of Exuberance and Collapse in the S&P 500, International Economic Review, 56, 4, 1043-1078. https://doi.org/10.1111/iere.12132
Yuhn, K. H., Kim, S. B. and Nam, J. H. (2015). Bubbles and the Weibull Distribution: Was There an Explosive Bubble in US Stock Prices before the Global Economic Crisis?, Applied Economics, 47, 3, 255-271. Crisis?, Applied Economics, 47, 3, 255-271. https://doi.org/10.1080/00036846.2014.969824
Zeren F. and Ergüzel O. Ş. (2015). Testing for Bubbles in the Housing Market: Further Evidence from Turkey, Financial Studies, 19, 40-52.