Ekonomika ISSN 1392-1258 eISSN 2424-6166
2021, vol. 100(1), pp. 31–53 DOI: https://doi.org/10.15388/Ekon.2021.1.2
A First Glance at the Minimum Wage Incidence in Lithuania Using Social Security Data*
Jose Garcia-Louzao
Bank of Lithuania, Vilnius, Lithuania
Email: jgarcialouzao@lb.lt
Linas Tarasonis
Vilnius University and Bank of Lithuania, Vilnius, Lithuania
Email: linas.tarasonis@evaf.vu.lt
Abstract. This document explores the incidence of the minimum wage in Lithuania. The descriptive analysis exploits high-frequency data on monthly labor income coming from Social Security records between July 2013 and July 2020 to characterize (i) the evolution of the monthly minimum wage, (ii) the percentage of workers who earn the minimum wage, (iii) the bite of the minimum wage in the wage distribution, and (iv) the heterogeneity of the findings with respect to gender and age. The evidence shows that the minimum wage was raised 7 times with an average (real) increase of 7.3% and, on average, less than 10% of the workers earn at most the minimum wage but low-pay incidence is around 20%. In terms of the impact of the wage distribution, the minimum wage relative to the average wage in the economy fluctuates between 45 and 50 percent. Females and young workers exhibit a larger low-pay incidence and minimum wage bite.
Keywords: minimum wage legislation, labor market regulation
Received: 05/11/2020. Revised: 15/01/2021. Accepted: 07/02/2021
Copyright © 2021 Jose Garcia-Louzao, Linas Tarasonis. Published by Vilnius University Press
This is an Open Access article distributed under the terms of the Creative Commons Attribution License, which permits unrestricted use, distribution, and reproduction in any medium, provided the original author and source are credited.
1. Introduction
In terms of income distribution, Lithuania is one of the most unequal countries in the European Union.1 One of the main factors behind the observed inequality trends is the unequal growth of labor market returns (Cerniauskas et al., 2020). Unsurprisingly, the current policy debate has focused on minimum wage legislation as a means to tackle rising inequality.
While minimum wage legislation can be a powerful tool to raise pay at the bottom of the wage distribution (Freeman, 1996; Autor et al., 2016; Dube, 2019), the potential costs of imposing such a lower bound could offset the benefits (Neumark et al., 2004). The main negative consequence of minimum wage hikes arise from its potential impact on the employment of low-wage workers: employers may increase firing or reduce hiring, leading to fewer jobs for the group of workers targeted by the policy. The extent to which this is the case depends on the structure of the labor market (i.e. the degree of monopsony power), the sectoral composition of the market, which can affect the impact of automation or the ability to pass wage costs through to consumer prices, and the willingness of firms to compress profits. The ability of minimum wage legislation to help to increase wages at the bottom will depend on who ultimately pays the costs of the policy change: workers, consumers, or firms; although eventually a higher minimum wage will impact employment. Therefore, the question of how high the minimum wage can be set before employment losses become salient calls for a detailed empirical evaluation.
This document represents the first step towards an empirical evaluation of the impact of the minimum wage in Lithuania. The descriptive analysis exploits unique high-frequency data on monthly labor income coming from Social Security records between July 2013 and July 2020. Our goal is to describe the evolution of the minimum wage and its incidence in the labor market. To characterize the incidence, we use two complementary measures based on the proportion of workers who earn at most the minimum wage and the level of the minimum wage in relation to the average monthly wage in the economy. Using these definitions, we provide a broad picture of the incidence of the minimum wage and explore the heterogeneity of the incidence with respect to gender and age groups.
The descriptive exercise yields the following findings. Firstly, over the period under analysis, the monthly minimum wage was raised 7 times, with an average (real) increase of 7.3 percent. Secondly, on average, the incidence of low pay (monthly labor income at most the minimum wage) affects around 20 percent of the workforce between 2013 and 2020. There is, however, time heterogeneity: before 2017 slightly less than 25 percent of the workforce was at the minimum wage threshold, whereas by the end of period around 15 percent of the workers were paid no more than the minimum wage. However, under a full minimum wage compliance assumption, i.e. full-month full-time workers cannot earn less than the minimum wage by law, the evidence suggests that the level of the incidence of low pay is driven by part-time employment. In other words, when we discard workers whose monthly labor income is below the monthly minimum wage, only around 10 percent of workers are covered by the minimum wage, this level being less than 8 percent after 2017. Thirdly, the bite of the minimum wage with respect to the average wage in the economy fluctuates from 45 to 50 percent. Fourthly, both females and young workers (i.e. those younger than age 26) face a higher low-pay incidence and minimum wage bite but not coverage. Finally, exploratory calculations suggest that a 1 percent increase in the monthly minimum wage would translate into an increase in a low-pay incidence ranging between 0.25 and 0.51 percentage points, whereas the ranges for the implied semi-elasticities for the coverage and the bite of the minimum wage are 0.15 and 0.56 and between 0.47 and 0.6, respectively.
The rest of the document is organized as follows: Section 2 briefly summarizes the existing empirical literature. Section 3 introduces the Lithuanian minimum wage setting, whereas Section 4 describes the data. Section 5 presents and discusses the evidence, and Section 6 concludes.
2. Literature review
The most prominent strand of the literature on the effects of the minimum wage (MW) relates to its impact on employment (see Belman and Wolfson, 2014, for a recent review). This focus on the employment effect of MW is rooted in basic economic theory: all else being equal, agents purchase less of a good as its price rises. Thus, in this framework, employers will adjust employment (and likely reduce output and/or increase the utilization of other factors of production) as MW increases. Despite the volume of empirical work, the evidence is far from conclusive. The results range from studies which find small or null employment effects (Card and Krueger, 1995; Dube et al., 2010, 2016; Ferraro et al., 2018; Cengiz et al., 2019; Harasztosi and Lindner, 2019; Dustmann et al., 2019) to those that find negative effects (Neumark and Wascher, 2008; Neumark et al., 2014; Meer and West, 2016; Clemens and Wither, 2019) or that find negative effects only on employment flows, not stocks (Cardoso and Portugal, 2006; Brochu and Green, 2013; Dube et al., 2016). This mixed evidence can be explained by differences in groups of workers analyzed (Dube et al., 2010; Neumark et al., 2014; Clemens and Wither, 2019), time heterogeneity, which biases the research design (Allegretto et al., 2017), the size and temporal dimension of the shock used (Sorkin, 2015; Aaronson et al., 2018), or the fact that labor markets are far from competitive, i.e. the existence of monopsony or oligopsony power (Manning, 2003; Okudaira et al., 2019; Azar et al., 2019).
The second margin of adjustment investigated in the literature has to do with consumer prices. Again, the basic idea has its roots in economic theory: an increase in MW represents a direct increase in input costs, thereby increasing the prices of goods produced by low-wage workers. The ability of firms to pass through MW shocks onto consumers dates back to Stigler (1946). The size and sign of these price responses play a key role in understanding the relationship between employment response and minimum wage changes (Brown, 1999). Namely, if firms are able to pass the higher costs of MW shocks through to prices, employment need not be reduced. Recent evidence in this area suggests that an important share of the costs associated with MW increases are paid by consumers (Lemos, 2008; Aaronson et al., 2008; Harasztosi and Lindner, 2019). In industries where firms are able to pass through MW costs onto consumers, employment losses are close to zero. These results also have important implications for the role of MW as a redistributive tool, provided that the efficacy depends on the fraction of income spent by poor or rich families on goods produced by MW workers (MaCurdy, 2015; Harasztosi and Lindner, 2019).
Although economic theory does not suggest that firm profitability or revenues will be affected by MW hikes (Rebitzer and Taylor, 1995; Card and Krueger, 1995), this margin has gained attention in the literature since the work of Draca et al. (2011). They show that firm profitability significantly decreased with an increase in MW in the UK in 1999. More recent work in Hungary by Harasztosi and Lindner (2019) demonstrates that the amount of MW increase paid by firm owners was small (20% of the total increase). Drucker et al. (2019) investigate the impact of MW on firm profitability in Israel and show that MW hikes reduced profits, especially among MW-intensive firms. Mayneris et al. (2018), by contrast, uncover no effect on the profitability of Chinese firms after the minimum wage reform of 2004, as productivity significantly rose. In the same vein as output prices, the impact of MW hikes on firm profitability also helps to determine the role of MW in tackling increasing wage inequality.
3. Minimum wage in Lithuania
Ever since the re-establishment of the State, Lithuania has had minimum wage legislation. The minimum hourly pay and minimum monthly wage are set by the government following the recommendation of the Tripartite Council, a national institution for social dialogue that consists of trade unions, employers’ organizations, and the government. The Tripartite Council’s recommendation typically reflects negotiations between the representatives of trade unions, employers’ organizations, and the government, and takes into account the economic outlook of the country, the budget of the State and municipalities, and the ability of employers to pay higher minimum wages.
Minimum wage provisions are regulated by the Labour Code and governmental resolutions. Although the Labor Code allows for the possibility of minimum wage differentiation across sectors, regions, or categories of workers, in practice the minimum wage is set uniformly at the national level. Thus, given the prevailing low rates of trade union density and collective bargaining coverage, the minimum wage is one of the main wage-setting determinants.2 Importantly, since the introduction of the New Labor Code in July 2017, minimum wage can only be paid for unskilled labor, that is, work that does not require any special skills or professional expertise.
In October 2017, the Tripartite Council signed a national agreement to promote new reforms.3 One of the primary points was the development of social dialogue between employers and employees to encourage collective agreements at the industry or regional levels. The document stipulates that the national minimum wage has to lie between 45 and 50 percent of the national average monthly labor income, excluding bonuses, allowances and additional payment not paid every period. Additionally, the Tripartite Council agreed that the relative level of the minimum wage with respect to the average wage in the economy must be equal to the average ratio of the European Union countries in the top quartile of this measure in the past three years.
Figure 1 shows the evolution of the statutory national monthly minimum wage over the past 25 years. Over this period, Lithuania experienced a successful story of economic convergence with respect to European Union countries. Aligned with the rapid economic growth, the minimum wage was raised several times, ranging from roughly 30 euros in 1995 to 607 euros in 2020, with two notable exceptions: the Russian financial crisis of 1998 and the Great Recession of 2008, periods when the minimum wage remained constant for several years4.
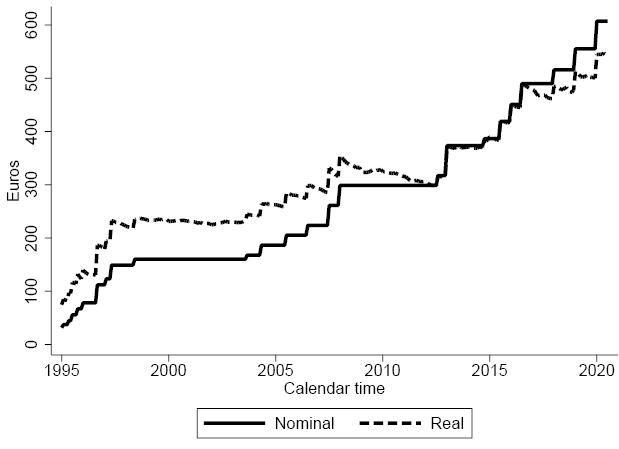
Figure 1: National monthly minimum wage, 1995-2020
Notes: The figure displays the evolution over time of the national monthly minimum wage in nominal and real terms between January 1995 and July 2020. Real values are in 2015 euros.
4. Data
4.1. Social Security records
Our main data source comes from administrative records provided by the State Social Insurance Fund Board (SoDra). The dataset is publicly available and updated on a monthly basis.5 It includes all insured workers who have been employed in private or public institutions for at least 30 days in a given month between July 2013 and July 2020 (self-employed workers are excluded).6 Unfortunately, the information available is not general: only total monthly labor income (pooling gross earnings, severance payments, bonuses, and other type of allowances), age, and sex are reported.
A key limitation of the dataset is that we cannot distinguish between part- and full-time workers. This is important to bear in mind as part-time workers represent around 8% of the total number of employees but roughly 80% of them earn the minimum wage over the observed period under analysis.7 Thus, in the full dataset, workers that we categorize as earning at most the minimum wage would be mostly part-time employees. Notice also that, given our income variable, the labor income distribution is shifted to the left, with the size of the shift positively correlated with the share of labor income corresponding to payments not directly linked to monthly work. This implies that our measures of the incidence of the minimum wage may undershoot both the proportion of minimum wage workers as well as the level of the minimum wage relative to the average monthly labor income.
Table 1 shows summary statistics for the variables at our disposal in October of selected years.8 In Lithuania, 52 percent of the workers aged 16-65 are women, highlighting the different gender composition compared to other developed countries. The average age of workers increases from 42 in 2013 to 43 in 2019, in line with the well-known phenomenon of population aging. Interestingly, females are two years older on average than their male counterparts. This is despite a higher retirement age of males and is most likely driven by higher mortality and emigration rates among males.
Table 1: Summary statistics
|
2013 |
2016 |
2019 |
||
|
Female |
0.52 |
0.52 |
0.51 |
|
|
Age |
All |
42.18 |
42.86 |
43.44 |
|
Male |
41.28 |
41.98 |
42.46 |
|
|
Female |
43.01 |
43.67 |
44.37 |
|
|
Real labor income |
Mean |
803.37 |
967.65 |
1188.83 |
|
Median |
599.08 |
755.70 |
937.07 |
|
|
Gender Wage gap |
At the mean |
14.95 |
15.78 |
13.88 |
|
At the median |
7.25 |
8.37 |
6.70 |
|
|
Number of observations |
1,042,988 |
1,065,523 |
1,078,774 |
|
Source: SoDra and authors’ calculations.
Notes: Statistics refer to October of each year. Labor income is in Euros of 2015. The gender wage gap is defined as the percentage difference between male and female real monthly wages.
Total monthly income is expressed in 2015 euros using the consumer price index. Both mean and median real wages portray significant growth as a consequence of a rapid economic expansion over the observed period. Mean monthly income has grown by almost 50 percent from 2013 to 2019, or an average of 6.75 percent each year. There are also differences in terms of income between females and males, with an average gap of 15 percent in 2013. The average gender gap we find is consistent with previous findings for Lithuania, but the median wage gap is twice smaller (see Christofides et al., 2013). Differences in working hours that we cannot account for may explain this discrepancy.
4.2. Comparison with Tripartite Council’s official data
In this section, we compare our labor income measure and the data used by the Tripartite Council in minimum wage negotiations (see Table 2). The official data comes from the Quarterly Survey on Earnings carried out by Statistics Lithuania.9 This data includes information on average monthly labor income, along with separate information on bonuses, allowances, and other payments that are not paid each period (column Survey Wage in Table 2). In addition, the survey provides information on the proportion of part-time versus full-time employees. The measure of labor income is then obtained as the full-time equivalent average monthly labor income, expressed as the average individual monthly labor income weighted by the share of part-time workers, net of non-recurrent payments. The policy target is the ratio of the minimum wage relative to this average monthly salary.
Table 2: Survey vs SoDra
|
Year |
Survey Wage |
SS Wage |
SS Re-scaled |
Official Ratio |
SS Ratio |
Official-SS |
|
2014 |
865.30 |
838.05 |
788.71 |
45.70 |
47.12 |
-1.424 |
|
2015 |
917.31 |
890.42 |
835.11 |
46.60 |
46.14 |
0.457 |
|
2016 |
979.47 |
948.20 |
887.36 |
50.30 |
49.81 |
0.488 |
|
2017 |
1026.55 |
990.88 |
925.57 |
48.20 |
49.90 |
-1.696 |
|
2018 |
1103.42 |
1088.07 |
1015.29 |
46.30 |
46.99 |
-0.689 |
|
2019 |
1151.87 |
1162.70 |
1088.99 |
45.70 |
45.91 |
-0.207 |
Sources: SS data comes from SoDra and authors’ calculations. Survey data comes from aggregate data downloaded from Statistics Lithuania.
Notes: Monetary variables are in Euros of 2015. ”SS Re-scaled” stands for the average monthly labor income coming from SS records after taking into account the share of income that corresponds to non-recurrent payments. ”Ratio” refers to the minimum wage policy target: monthly minimum wage relative to the average monthly labor income. ”SS ratio” is computed using the SS re-scaled wage. ”Official-SS column” refers to the difference between the official ratio and the SS ratio.
As discussed above, Social Security records exhibit some drawbacks relative to those used by the Tripartite Council. First of all, we are not able to differentiate part- from full-time workers; thus, our average labor income is an unweighted average among all workers employed at least 30 days in a month. Columns 2 and 3 of Table 2 show that the differences between the full-time equivalent average monthly labor income and our unweighted average monthly labor income are very close. These similarities are driven by the low incidence of part-time work in Lithuania, making part-time weighted and unweighted averages similar.
Another caveat is that our data does not allow us to disentangle gross earnings from additional remuneration not paid each month. This implies that our income measure is upward biased and, hence, our ratio of the minimum wage in relation to average monthly labor income would be underestimated relative to the Tripartite’s target. To address this challenge, we rely on information on the average share of total labor income that corresponds to extra payments each quarter.10 We then use this value to re-scale our average labor income measure. The last columns of Table 2 compare the policy target used by the Tripartite Council with our computations, where we use the ratio of minimum wage in relation to the re-scaled average monthly labor income. The comparison suggests that the adjustment does a good job, as we obtain similar figures for the policy target.
Despite its limitations, Social Security data has advantages for gaining new insights on the incidence of the minimum wage relative to earnings surveys. On the one hand, it allows us to adopt a high-frequency approach and look at the evolution of the incidence of the minimum wage monthly, compared to the quarterly frequency of the survey. On the other hand, administrative records do not suffer from the measurement error issues typically found in survey data.
5. The incidence of the minimum wage
5.1. Time-series evidence
This section presents the incidence of the minimum wage in the Lithuanian labor market. We focus on two margins: (i) the coverage of the minimum wage, i.e. how many workers earn at most the minimum wage, and (ii) the bite of the minimum wage, i.e. how deep is the impact of the minimum wage in the wage distribution. These two issues help to characterize the incidence of the minimum wage and set up a framework to understand the potential effects of minimum wage hikes.
Table 3 reports how minimum wage evolved in Lithuania over the period of our descriptive analysis. Between 2014 and 2020, the national minimum wage was increased seven times, with each increase ranging from 3.5 to 9.4 percent. Two of these changes took place in July, but most of the minimum wage increases enter into force in January.11 This implies that any observed change in the minimum wage incidence may be contaminated by compositional changes, as suggested by Figure A.1a in the Appendix. Therefore, seasonal effects along with tax reforms that enter into force in January simultaneously with minimum wage hikes may affect our results and, hence, must be borne in mind when interpreting the following results.
Table 3: Nominal minimum wage in Lithuania, 2013-2020
|
Year |
2013 |
2014 |
2015 |
2016 |
2016 |
2018 |
2019 |
2020 |
|
Month |
October |
July |
January |
July |
January |
January |
January |
|
|
Level |
373 |
386 |
419 |
451 |
490 |
516 |
555 |
607 |
|
Raise (%) |
- |
3.5 |
8.5 |
7.6 |
8.6 |
5.3 |
7.6 |
9.4 |
Source: Statistics Lithuania. Notes: From 1 January 2019, the rates of the state social insurance contributions paid by the employer and the employee were changed. Minimum wage is indexed by the rate change (1.289) before 2019.
We characterize the proportion of minimum wage workers using two complementary definitions. On the one hand, we define low-pay incidence as the percentage of workers whose monthly labor income is at most 2.5 percent above the national monthly minimum wage. Notice that this measure includes all workers observed in our data, which implies that a significant share of the workers included in this proportion are likely to be part-time employees. One the other hand, under a full-compliance assumption, i.e. full-time employees working 30 days in the month must legally earn at least the minimum wage, we exclude workers who earn less than the monthly minimum wage to mitigate the inclusion of part-time employment. Under this assumption, we define the coverage of the minimum wage as all the remaining workers whose monthly labor income is at most 2.5 percent above the national monthly minimum wage. Importantly, in this exercise, we do not re-scale our monthly labor income variable to account for non-recurrent payments. The main reason is that the distribution of non-recurrent payments is likely to be non-uniformly distributed across workers. Thus, we adopt a conservative approach and we use raw individual wages to categorize minimum wage workers, keeping in mind that we may overshoot the percentage of workers whose income is at most the minimum wage.
Figure 2 reports the evolution of the proportion of minimum wage workers between July 2013 and July 2020, and minimum wage hikes are portrayed as vertical lines. The figure shows that both definitions typically go up after each minimum wage hike. Notice, however, that the magnitude of the increase seems to be larger when the minimum wage hike takes place in January relative to July. This highlights our previous discussion and suggests that confounders due to seasonal effects and simultaneity of different policy changes may impact the correlation between minimum wage hikes and the workers covered.
Taking the whole period, the numbers indicate that 20 percent of the workforce falls under our definition of low pay, whereas roughly 8 percent of the workforce is covered by the minimum wage. The differences are mostly driven by part-time employment, which typically exhibits a larger incidence of minimum wage workers. The evidence also reveals time heterogeneity on the incidence of the minimum wage: the percentage of workers covered using either of our definitions halves from 2017 onward relative to its pre-2017 average. This fact can be related to the the new Labor Code that entered into force in July 2017 and established that only unskilled workers can earn the minimum wage. Thus, the new Labor Code could have de facto increased workers’ labor income, creating a wedge between minimum wage level and skilled workers’ pay. In addition, the COVID-19 pandemic seems to have had an impact on the minimum wage coverage in the short-run, as the sharp increase in our measures in the second quarter of 2020 suggests.
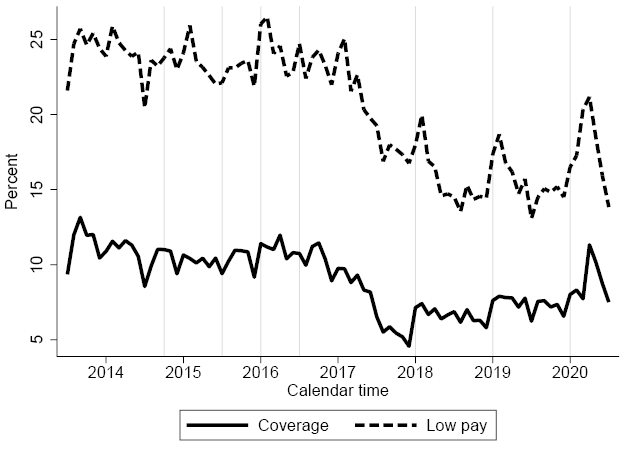
Figure 2: Minimum wage workers, 2013-2020
Source: SoDra and authors’ calculations.
Notes: The figure displays the evolution of the low-pay incidence and minimum wage coverage. Low-pay incidence includes all workers whose monthly labor income is at most 2.5 percent above the national monthly minimum wage. Coverage excludes workers who earn less than the minimum wage and refers to the percentage of workers covered by the minimum wage as those who earn at most 2.5 percent above the monthly minimum wage. Vertical lines correspond to minimum wage hikes.
An alternative way to look at the incidence of the minimum wage is to look at how deep it bites in the wage distribution; in other words, to measure the level of the minimum wage with respect to a relevant moment of the wage distribution, typically the mean or the median (Kaitz index). This is an appealing goal as it is based on the potential of the minimum wage to alter the wage distribution. However, the evolution of this indicator is not exclusively determined by changes caused by the minimum wage. Movements in other parts of the wage distribution also impact its development.
Figure 3 reports the bite of the minimum wage, also known as the Kaitz index, between July 2013 and July 2020.12 The data shows that minimum wage hikes shift up the minimum wage bite, expressed in terms of the re-scaled average wage, when the new minimum wage typically enters into force, to steadily fall until the next increase.13 This is most likely driven by the significant wage growth observed in the Lithuanian economy in recent years, which has been particularly acute since 2017. Importantly, this fluctuation is still within the policy target set in October 2017: it ranges within the 45 to 50 percent bands, being above the upper limit only between 2016 and mid-2017. The behavior of the index using the median as the reference moment of the wage distribution depicts a similar evolution, despite a higher bite. The higher bite is linked to a larger dispersion of the upper tail of the wage distribution relative to the bottom tail.
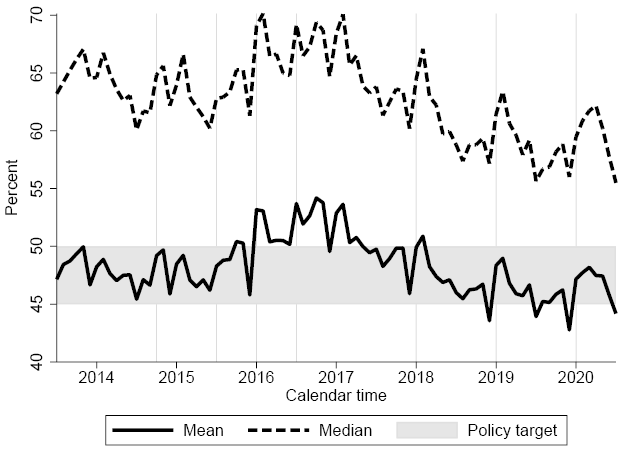
Figure 3: Minimum wage bite, 2013-2020
Source: SoDra and authors’ calculations.
Notes: The figure displays the evolution of the bite of the minimum wage between July 2013 and July 2020. The minimum wage bite refers to the ratio of the national monthly minimum wage over re-scaled average (median) monthly labor income. Vertical lines correspond to minimum wage hikes. The shaded area corresponds to the policy target set out by the Tripartite Council in October 2017.
In Figure 4, we explore the heterogeneity of the results with respect to gender and age. The findings point to differences across these two dimensions in terms of low-pay incidence. In other words, the percentage of workers who earn at most the minimum wage is higher among females and young workers. However, when looking at the coverage of the minimum wage, such differences mostly vanished. These two contrasting figures are driven by the heterogeneity in the part-time work across groups, which is more prevalent for females and young workers. With respect to the bite, the differences are more acute: the minimum wage relative to the average monthly labor income is markedly higher for females and youth. This evidence can be expected, as earnings are lower for these groups. Altogether, the unveiled differences suggest that how minimum wage hikes may impact low-pay incidence through part-time employment as well as how young workers may be disproportionately affected in the presence of uniform minimum wages should be taken into account in policy discussions.14
5.2. Basic projections
In this section, we exploit our data to provide evidence on the co-movement of minimum wage hikes and changes in the incidence of the minimum wage in terms of both coverage and bite. To document this correlation, we compute (unconditional) semi-elasticities by taking the ratio between the change in the incidence of the minimum wage (in percentage points, pp) to the change in the national minimum wage (in percent). It is important to keep in mind that this is a simplistic exercise and the outcomes may vary according to the evolution of the economy between the time periods compared and the labor demand response to alternative minimum wage hikes. Thus, the evidence should be taken as indicative only.
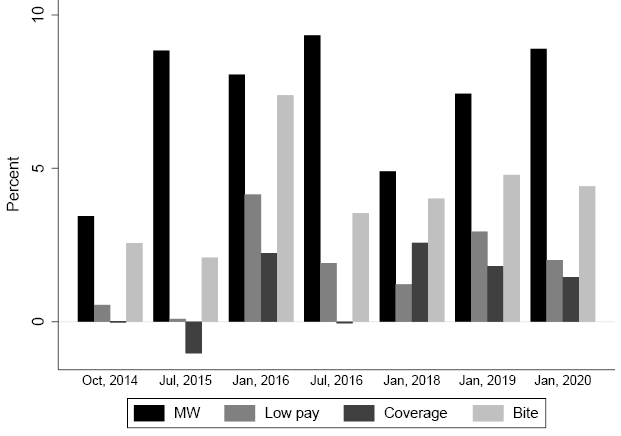
Figure 5: Change in the level and incidence of the minimum wage
Source: SoDra and authors’ calculations.
Notes: The figure displays the percentage change in the level of the minimum wage and in its incidence (low pay, coverage, and bite). Low-pay incidence includes all workers whose monthly labor income is at most 2.5 percent above the national monthly minimum wage. Coverage excludes workers who earn less than the minimum wage and refers to the percentage of workers covered by the minimum wage as those who earn at most 2.5 percent above the monthly minimum wage. The minimum wage bite refers to the ratio of the national monthly minimum wage over re-scaled average monthly labor income. Dates refer to the month when the minimum wage was increased. Percentage changes are computed between the month of the minimum hike and the previous month.
Figure 5 displays observed changes in the level of the minimum wage and the associated changes in the incidence of the minimum wage. Interestingly, the evidence stresses a fact already discussed: changes in the proportion of minimum wage workers seem to be notably affected by the moment when the minimum wage hike occurs due to seasonal labor market effects. To compute the implied semi-elasticities, we average out changes across all of the observed minimum wage hikes. The average (real) minimum wage increase was 7.3 percent, whereas the change in low pay, coverage, and bite was 1.8pp, 1pp, and 4.1pp, respectively. The implied semi-elasticity for low pay and coverage of the minimum wage is 0.25 and 0.15, respectively. In other words, a 1 percent increase in the national monthly minimum wage translated into an 0.25pp (0.15pp) increase in the proportion of minimum wage workers. The semi-elasticity for the bite implies that the ratio of the minimum wage to the average wage increased, on average, by 0.60pp for each 1% increase in the national minimum wage.
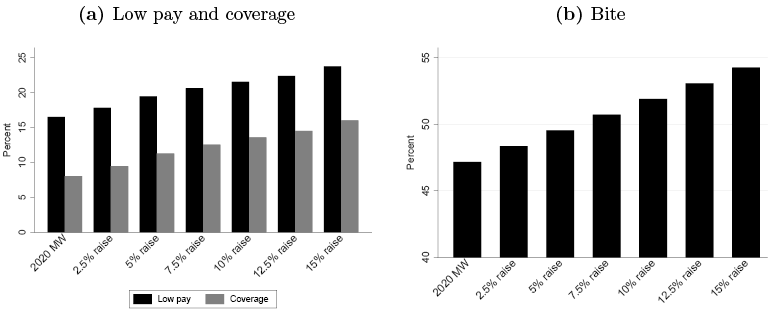
Figure 6: Minimum wage incidence under alternative levels
Source: SoDra and authors’ calculations.
Notes: The figure displays the percentage of workers covered by the minimum wage under alternative levels. Alternative minimum wage scenarios are based on January 2020 data and consider a MW increase in real terms. Low-pay incidence includes all workers whose monthly labor income is at most 2.5 percent above the national monthly minimum wage. Coverage excludes workers who earn less than the minimum wage and refers to the percentage of workers covered by the minimum wage as those who earn at most 2.5 percent above the monthly minimum wage. The minimum wage bite refers to the ratio of the national monthly minimum wage over re-scaled average monthly labor income.
Alternatively, we rely exclusively on January 2020 data to perform a similar exercise. Under the assumptions that workforce composition is representative of next January, there is no wage growth, and no spillover effects over the wage distribution, we seek to assess how different increases of the minimum wage (in real terms) would affect its incidence. We consider six alternative minimum wage scenarios, ranging from a 2.5 to a 15 percent increase with respect to the level in 2020. Figure 6a reports the percentage of workers who would be covered by the minimum wage under alternative levels, whereas Figure 6b displays the bite of alternative minimum wage schemes. The results imply an (unconditional) semi-elasticity of 0.51 and 0.56 in terms of low pay and coverage response to minimum wage hikes, respectively. In the case of the minimum wage bite, the corresponding semi-elasticity for the bite is 0.47.15 Differences between the experiments are likely driven by differences between the periods we use to compare the old and new minimum wage levels as well as the development of the economy.
6. Conclusions
This document exploits unique high-frequency data on monthly labor income coming from Social Security records between July 2013 and July 2020 to offer a first glance at the incidence of the minimum wage in Lithuania. The descriptive analysis shows that during the period under analysis, the minimum wage was increased seven times, with an average (real) increase of 7.3 percent. Over this period, on average, less than 10 percent of the workers in Lithuania earned at most the minimum wage. Relative to the wage distribution, the minimum wage fluctuates between 45 to 50 percent of the average wage in the economy, but this measure is higher for both female and younger workers.
Exploring the (unconditional) co-movement between minimum wage hikes and the change in the minimum wage incidence suggests that a 1 percent increase in the monthly minimum wage would translates into an increase in low-pay incidence ranging between 0.25 and 0.51 percentage points, between 0.15 and 0.56 for the coverage of the minimum wage, and between a 0.47 and a 0.60 percentage point rise in the bite in wage distribution. The latter bounds can be used by policy makers when setting the minimum wage as a result of a policy target expressed in terms of the bite of the minimum wage.
Notably, whether the level of the minimum wage is high or low is an empirical question, as economic theory does not give much guidance as to the optimal level of the minimum wage. Existing evidence indicates that labor markets are not always a textbook example of a simple, perfectly competitive supply and demand framework. In an imperfect labor market, when wages are below marginal productivity, as with monopsony, there is room for minimum wage increases that would not translate into employment losses. Similarly, higher minimum wages could reduce job vacancies and turnover instead of destroying jobs. Moreover, the costs are not necessarily borne only by low-paid workers; minimum wage hikes can be absorbed by firms through increasing consumer prices, compressing profits, or productivity gains. It is also important to bear in mind, however, that sufficiently large increases will eventually lead to a drop in employment levels.
Therefore, the potential of minimum wage policy to provide higher labor income for low-paid workers along with the associated reduced reliance on welfare benefits and increased perception of social fairness should be considered alongside the potential costs brought by minimum wage hikes: reduced employment or higher price levels. In other words, how high one can set the minimum wage before employment losses become pronounced is a question that demands a detailed empirical evaluation.
References
Aaronson, D., French, E., & MacDonald, J. (2008). The minimum wage, restaurant prices, and labor market structure. The Journal of Human Resources, 43 (3), 688–720. https://doi.org/10.3368/jhr.43.3.688
Aaronson, D., French, E., Sorkin, I., & To, T. (2018). Industry dynamics and the minimum wage: A putty-clay approach. International Economic Review, 59 (1), 51–84. https://doi.org/10.1111/iere.12262
Allegretto, S., Dube, A., Reich, M., & Zipperer, B. (2017). Credible research designs for minimum wage studies: A response to neumark, salas, and wascher. ILR Review, 70 (3), 559–592. https://doi.org/10.1177/0019793917692788
Autor, D. H., Manning, A., & Smith, C. L. (2016). The contribution of the minimum wage to us wage inequality over three decades: A reassessment. American Economic Journal: Applied Economics, 8 (1), 58–99. https://doi.org/10.1257/app.20140073
Azar, J., Huet-Vaughn, E., Marinescu, I., Taska, B., & Von Wachter, T. (2019). Minimum wage employment effects and labor market concentration. NBER Working Papers No. w26101 .
Belman, D., & Wolfson, P. J. (2014). What does the minimum wage do? WE Upjohn Institute.
Brochu, P., & Green, D. A. (2013). The impact of minimum wages on labour market transitions. The Economic Journal, 123 (573), 1203–1235. https://doi.org/10.1111/ecoj.12032
Brown, C. (1999). Minimum wages, employment, and the distribution of income. In O. C. Ashenfelter & D. Card (Eds.), Handbook of labor economics (Vol. 3, p. 2101–2163). Amsterdam: North-Holand: Elsevier. https://doi.org/10.1016/S1573-4463(99)30018-3
Card, D., & Krueger, A. B. (1995). Myth and measurement: The new economics of the minimum wage. Princeton University Press. https://doi.org/10.2307/ j.ctv7h0s52
Cardoso, A. R., & Portugal, P. (2006). Disentangling the minimum wage puzzle: An analysis of worker accessions and separations. Journal of the European Economic Association, 4 (5), 988–1013. https://doi.org/10.1162/JEEA.2006.4.5.988
Cengiz, D., Dube, A., Lindner, A., & Zipperer, B. (2019). The effect of minimum wages on low-wage jobs. The Quarterly Journal of Economics, 134 (3), 1405–1454. https://doi.org/10.1093/qje/qjz014
Cerniauskas, N., Sologon, D. M., O’Donoghue, C., & Tarasonis, L. (2020). Changes in income inequality in lithuania: The role of policy, labour market structure, returns and demographics. Bank of Lithuania WP 71/2020 .
Christofides, L. N., Polycarpou, A., & Vrachimis, K. (2013). Gender wage gaps, ‘sticky floors’ and ‘glass ceilings’ in europe. Labour Economics, 21, 86–102. https:// doi.org/10.1016/j.labeco.2013.01.003
Clemens, J., & Wither, M. (2019). The minimum wage and the great recession: Evidence of effects on the employment and income trajectories of low-skilled workers. Journal of Public Economics, 170, 53–67. https://doi.org/10.1016/j.jpubeco.2019.01.004
Draca, M., Machin, S., & Reenen, J. V. (2011). Minimum wages and firm profitability. American Economic Journal: Applied Economics, 3 (1), 129–151. https://doi.org/10.1257/app.3.1.129
Drucker, L., Mazirov, K., & Neumark, D. (2019). Who pays for and who benefits from minimum wage increases? evidence from israeli tax data on business owners and workers. NBER Working Papers No. w2657 .
Dube, A. (2019). Minimum wages and the distribution of family incomes. American Economic Journal: Applied Economics, 11 (4), 268–304. https://doi.org/10.1257/app.20170085
Dube, A., Lester, T. W., & Reich, M. (2010). Minimum wage effects across state borders: Estimates using contiguous counties. The Review of Economics and Statistics, 92 (4), 945–964. https://doi.org/10.1162/REST a 00039
Dube, A., Lester, T. W., & Reich, M. (2016). Minimum wage shocks, employment flows, and labor market frictions. Journal of Labor Economics, 34 (3), 663–704. https://doi.org/10.1086/685449
Dustmann, C., Lindner, A., Schoenberg, U., Umkehrer, M., & Vom Berge, P. (2019). Reallocation effects of the minimum wage: Evidence from germany. mimeo.
Ferraro, S., Hänilane, B., & Staehr, K. (2018). Minimum wages and employment retention: A microeconometric study for estonia. Baltic Journal of Economics, 18 (1), 51–67. https://doi.org/10.1080/1406099X.2018.1485422
Freeman, R. B. (1996). The minimum wage as a redistributive tool. The Economic Journal, 106 (436), 639–649. https://doi.org/10.2307/2235571
Harasztosi, P., & Lindner, A. (2019). Who pays for the minimum wage? American Economic Review, 109 (8), 2693–2727. https://doi.org/10.1257/aer.20171445
Lemos, S. (2008). A survey of the effects of the minimum wage on prices. Journal of Economic Surveys, 22 (1), 187–212. https://doi.org/10.1111/j.1467-6419.2007.00532.x
MaCurdy, T. (2015). How effective is the minimum wage at supporting the poor? Journal of Political Economy, 123 (2), 497–545. https://doi.org/10.1086/679626
Manning, A. (2003). Monopsony in motion: Imperfect competition in labor markets.Princeton University Press. https://doi.org/10.2307/j.ctt5hhpvk
Mayneris, F., Poncet, S., & Zhang, T. (2018). Improving or disappearing: Firm-level adjustments to minimum wages in china. Journal of Development Economics, 135, 20–42. https://doi.org/10.1016/j.jdeveco.2018.06.010
Meer, J., & West, J. (2016). Effects of the minimum wage on employment dynamics. Journal of Human Resources, 51 (2), 500–522. https://doi.org/10.3368/jhr.51.2.0414-6298R1
Neumark, D., Salas, J. I., & Wascher, W. (2014). Revisiting the minimum wage—employment debate: Throwing out the baby with the bathwater? ILR Review, 67 (3 suppl), 608–648. https://doi.org/10.1177/00197939140670S307
Neumark, D., Schweitzer, M., & Wascher, W. (2004). Minimum wage effects through- out the wage distribution. Journal of Human Resources, XXXIX (2), 425–450. https://doi.org/10.3368/jhr.XXXIX.2.425
Neumark, D., & Wascher, W. (2008). Minimum wages. MIT press. https://doi.org/10.7551/mitpress/9780262141024.001.0001
Okudaira, H., Takizawa, M., & Yamanouchi, K. (2019). Minimum wage effects across heterogeneous markets. Labour Economics, 59, 110–122. https://doi.org/10.1016/j.labeco.2019.03.004
Rebitzer, J. B., & Taylor, L. J. (1995). The consequences of minimum wage laws: Some new theoretical ideas. Journal of Public Economics, 56 (2), 245–255. https://doi.org/10.1016/0047-2727(93)01411-3
Sorkin, I. (2015). Are there long-run effects of the minimum wage? Review of Economic Dynamics, 18 (2), 306–333. https://dx.doi.org/10.1016/j.red.2014.05.003
Stigler, G. J. (1946). The economics of minimum wage legislation. American Economic Review , 36 (3), 358–365.
A. Supplementary figures
Table A.1: Part-time employment and minimum wage earners, 2014-2020
|
Year |
Part-time Employment |
Minimum wage earners |
|
|
Full-time |
Part-time |
||
|
2014 |
8.6 |
9.2 |
88.8 |
|
2015 |
7.6 |
8.8 |
89.8 |
|
2016 |
7.1 |
9.8 |
89.5 |
|
2017 |
7.6 |
3.3 |
85.4 |
|
2018 |
7.1 |
2.5 |
78.4 |
|
2019 |
6.4 |
2.6 |
73.4 |
Source: Part-time employment (Eurostat). Minimum wage earners (Statistics Lithuania).
Notes: Numbers in percent.
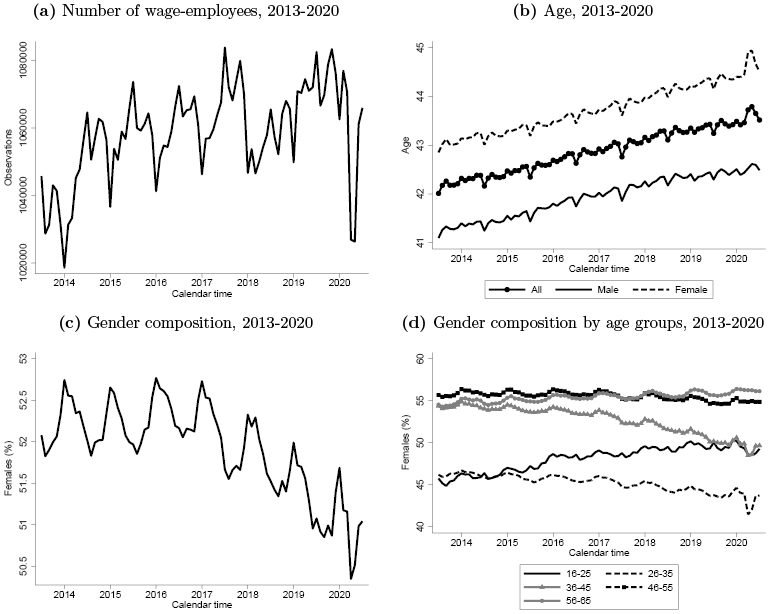
Figure A.1: Evolution of the main variables, 2013-2020
Source: SoDra and authors’ calculations.
Notes: The figure displays the evolution of the number of workers, the percentage of female workers (also within age groups), average age for male and female workers between July 2013 and July 2020.
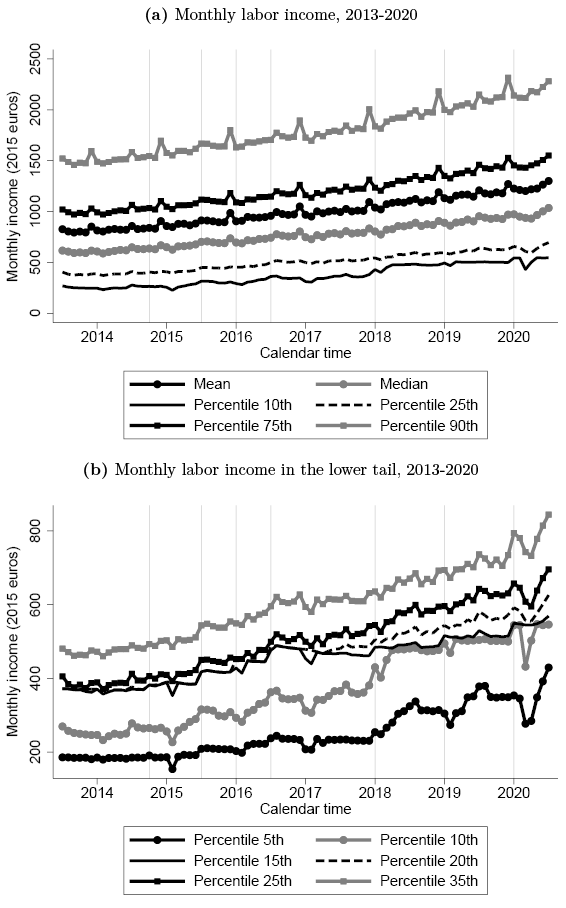
Figure A.2: Monthly labor income, 2013-2020
Source: SoDra and authors’ calculations.
Notes: The figure displays the evolution over time of selected moments of the cross-sectional monthly labor income distribution between July 2013 and July 2020. Vertical lines correspond to minimum wage hikes.
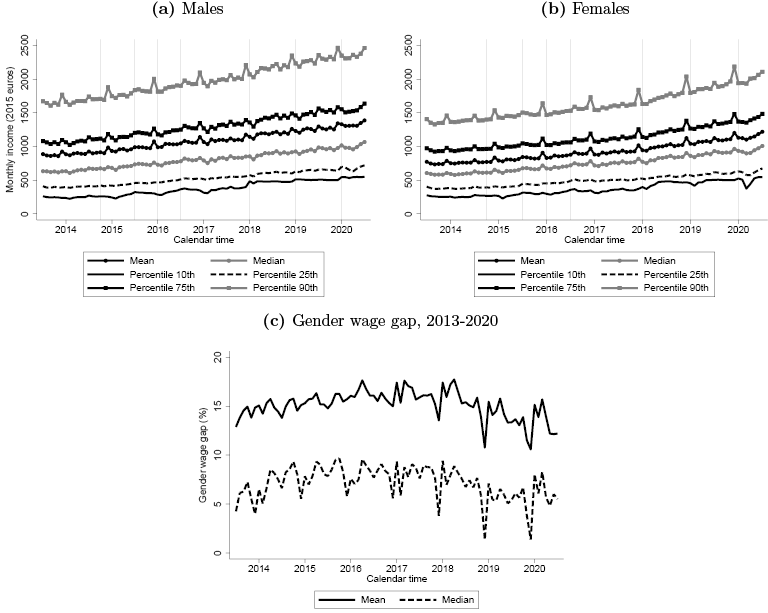
Figure A.3: Monthly labor income by gender, 2013-2020
Source: SoDra and authors’ calculations.
Notes: The figure displays the evolution over time of selected moments of the cross-sectional monthly labor income distribution between July 2013 and July 2020 for males and females in Panel (a) and (b), respectively. Panel (c) displays the evolution of the gender wage gap between July 2013 and July 2020. The gender wage gap is computed as the ratio of the monthly labor income of females over the monthly labor income of males.
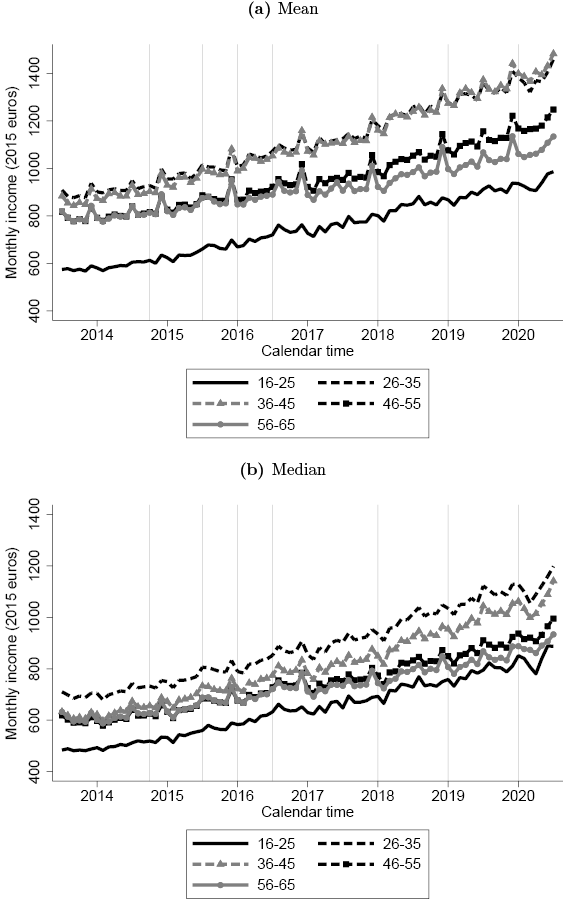
Figure A.4: Monthly labor income by age groups, 2013-2020
Source: SoDra and authors’ calculations.
Notes: The figure displays the evolution over time of mean and median monthly labor income distribution between July 2013 and July 2020 in Panel (a) and (b), respectively.
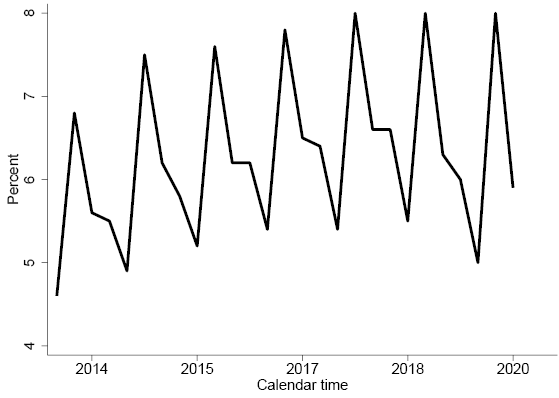
Figure A.5: Extra payments, 2013-2020
Source: Statistics Lithuania
Notes: The figure displays the evolution of bonuses, allowances, and other payments not paid every month to workers between July 2013 and July 2020.
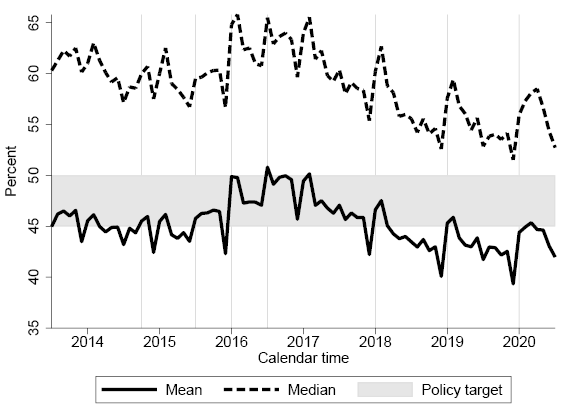
Figure A.6: Minimum wage bite (raw), 2013-2020
Source: SoDra and authors’ calculations.
Notes: The figure displays the evolution of the bite of the minimum wage between July 2013 and July 2020. The minimum wage bite refers to the ratio of the national monthly minimum wage over the mean (median) monthly labor income. Vertical lines correspond to minimum wage hikes. Shaded area corresponds to the policy target set out by the Tripartite Council in October 2017.
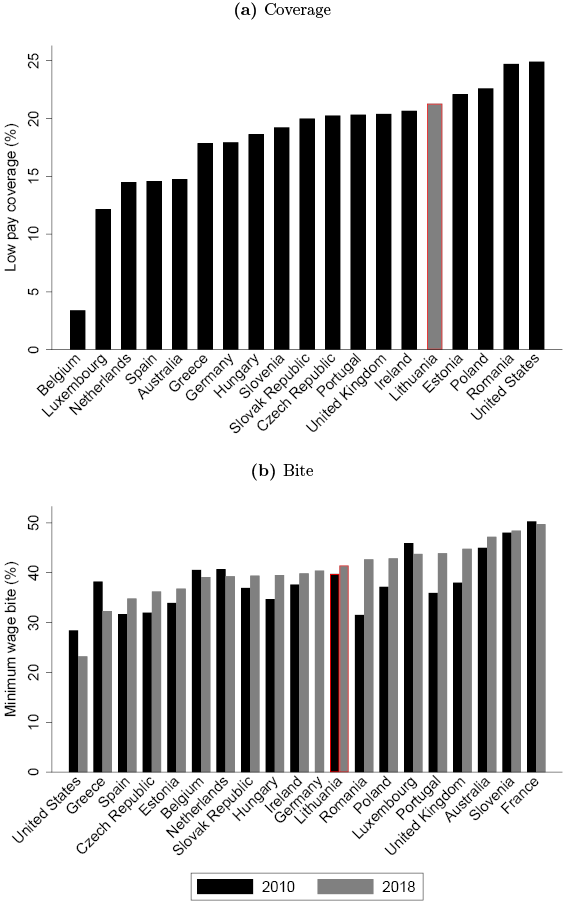
Figure A.7: Minimum wage incidence across OECD countries, 2014
Source: OECD and authors’ calculations.
Notes: The figure compares the incidence of the minimum wage in Lithuania with other OECD countries. Panel (a) reports the coverage of the minimum wage defined as the percentage of low-pay workers as individuals who earn less than 2/3 of the median salary in a given country. Panel (b) shows the bite of the minimum wage: ratio of the national monthly minimum wage over the median monthly labor income
1* The views expressed in this paper are those of the authors and do not necessarily reflect the position of the Bank of Lithuania or the Eurosystem. All errors are ours.
According to the European Union Statistics on Income and Living Conditions (EU-SILC), the Gini index of household equivalized disposable income was 37 Gini points in Lithuania in 2015, only surpassed by Bulgaria.
2 See OECD statistics on trade union membership here: https://stats.oecd.org/Index.aspx? DataSetCode=TUD.
3 The document addressed five main areas: improving public sector efficiency and quality of services, enhancing social dialogue, promoting excellence in scientific research, education and life-long learning, ensuring compatibility and stability of the tax system, and upgrading the country’s economic competi- tiveness.
4 The evolution of the national hourly minimum wage, relevant to part-time workers, is a rescaled version of this figure. It is set as a monthly minimum wage divided by normal monthly working hours and ranges from roughly 0,2 euros in 1995 to 3,72 euros in 2020.
5 See https://atvira.sodra.lt/en-eur/ (tab “The Insured”, section “Average Insured Earnings Analysis”) for the exact dataset. The website does not provide historical data (only current month data is available for download), but the time series has been collected by the Bank of Lithuania at a monthly frequency since July 2013.
6 Workers who hold more than one job lasting at least 30 days in the month will be counted as many times as jobs they have in that month. Thus, technically, the data contains the population of worker-firm matches lasting more than 30 days.
7 See Table A.1 for evidence on part-time employment and differences between full-time and part-time employees who earn the minimum wage.
8 Appendix A reports statistics at a monthly frequency of selected variables.
9 For a detailed description of the survey, see https://osp.stat.gov.lt/documents/10180/5118910/Darbo+u%C5%BEmokes%C4%8Dio+rodikliai+%28ketvirtiniai+ir+metiniai%29+%5BEN%5D+474.html.
10 Figure A.5 shows the quarterly evolution of extra payments over the period under analysis.
11 The change in October 2014 is the smallest in size. However, it may be affected by three main factors: (i) it took place after the Great Recession, (ii) the previous minimum wage increase was one year and a half before, and (iii) entered into force just 3 months before the introduction of the Euro.
12 Figure A.6 shows the evolution of the minimum wage bite using the average and median monthly income without using the re-scale factor to account for non-recurrent payments.
13 Notice that we re-scale monthly income after aggregating all individual incomes in a given month. Therefore, non-uniformly distributed extra payments across individuals do not introduce any bias, as we are averaging out heterogeneity in the distribution of the non-recurrent payments across workers.
14 For instance, transit from a uniform minimum wage to age-specific levels that align with the characteristics of the workers affected may mitigate the potentially larger negative impact of minimum wage increases on youth employment. Countries with specific minimum wage for youth typically set it as a fraction of the adult minimum wage, and they can be unique for workers below a certain age threshold (e.g. Greece, Ireland, Portugal, New Zealand) or step-wise functions of age (e.g. the UK, Australia, Denmark, Netherlands).
15 Notice that the level of the bite is upward biased, as our computations do not account for wage growth. This implies that the elasticity of the minimum wage bite with respect to minimum wage hikes is likely to be overestimated.