Ekonomika ISSN 1392-1258 eISSN 2424-6166
2020, vol. 99(2), pp. 6–19 DOI: https://doi.org/10.15388/Ekon.2020.2.1
Modeling of Economic Convergence Processes in Eastern Europe Countries
Assoc. prof. Stavytskyy Andriy V.
Taras Shevchenko National University of Kyiv, Ukraine
Email: a.stavytskyy@gmail.com
Kozub Maryna B.
Taras Shevchenko National University of Kyiv, Ukraine
Email: marina.kozub1208@gmail.com
Abstract. The article describes the features of the processes of economic convergence in the countries of Eastern Europe for the last 10 years. The analysis of β- and σ-convergence was carried out based on a system of macroeconomic indicators with 10 key parameters. The calculation of the direction and speed of convergence was performed using the econometric instruments in the region as a whole and pairwise analysis of the β-convergence index for all analyzed countries. The obtained results allowed to conclude the inequity development of Eastern European countries and the lack of a stable trend towards convergence of macroeconomic indicators. The resulting model is universal and can be applied to other world regions or to determine the processes of convergence of another system of macroeconomic indicators and choose main directions of reforming to bring national economies closer and achieve stronger external relations.
Keywords: convergence; divergence; beta-coefficient; macroeconomic indicators system; Eastern Europe countries.
Received: 26/07/2020. Revised: 11/08/2020. Accepted: 17/08/2020
Copyright © 2020 Stavytskyy Andriy V., Kozub Maryna B. Published by Vilnius University Press
This is an Open Access article distributed under the terms of the Creative Commons Attribution License, which permits unrestricted use, distribution, and reproduction in any medium, provided the original author and source are credited.
Introduction
An analysis of country development dynamics in historical terms allows us to conclude that there are constant fluctuations in macroeconomic indicators, which in turn lead to increasing structural imbalances within certain groups of countries and regions. Such a growth of regional inequality leads to several problems, in particular the slowing down of economic growth due to deteriorating international trade conditions, increasing social tensions due to the intensification of migration processes etc. Even though in the context of globalization, economies not only interact with each other but also influence the vector of development of their main trade and political partners, identifying the possible options for the integration of different countries through the convergence of their economies, as well as the accession of other countries to existing unions, is an actual issue.
The issue of convergence is becoming increasingly important in modern conditions of the coronavirus infection, which has disrupted the logistics and transport chains and dealt a crucial blow to certain sectors of the economy. As a result, trade between countries and the consumption of goods and services has decreased significantly, which has led to a certain or, at least, temporary restriction of cooperation between countries, reducing the level of globalization. Under such conditions, it becomes much more difficult to maintain stable convergence trends, so this study will help to evaluate the future losses in convergence processes in Europe due to the COVID-19 pandemic.
Bearing in mind the current trends of strengthening the integration processes of national economies within regional or international associations, there is a problem of assessing the direction and speed of such convergence, taking into account external and internal factors affecting the system. This determines the actuality for preliminary forecasting possible vectors of development in national economies within separate regions in the context of determining the strategic course for country development.
Therefore, the research aims to model the convergence processes in Eastern Europe by calculating the values of β- and σ-convergence.
In the article, the countries of Eastern Europe are understood as 10 states according to the United Nations` classification (Belarus, Bulgaria, Moldova, Poland, the Russian Federation, Romania, Slovakia, Ukraine, the Czech Republic, Hungary) (United Nations, 2012) The source of data for calculations is the data of the World Bank and the US research and educational institution Heritage Foundation.
The work is structured as follows. First, there is a review of the literature on economic convergence. Second, the next part describes the methodology of modelling and its evaluation. The following are the results of the model analysis. The article ends with conclusions and discussions, which presents the author’s proposals for overcoming the imbalances in economic convergence in countries of Eastern Europe.
Review of literature
An analysis of recent researches and publications shows that the problem occupies a significant place among other modern scientific works.
Basic researches of these processes began with the neoclassical Solow-Swan model, in which the convergence hypothesis is described by output per employee. That model was extended and empirically tested in the studies of G. Mankiw, D. Romer, D. Weil (Burlay, 2019). The formula for calculating the β-coefficient, which shows the direction and the rate of convergence processes, is given in the model of R. Barro and X. Sala-i-Martin, where the main parameter was determined by labour productivity (Barro, R., Sala-i-Martin, X., 1992).
Further part of studies was related to different econometric models in convergence process. Stavytskyy et al. (2019a) build a gravity model for European countries describing trade relation among them. The main finding has shown that countries that are close to each other have fewer opportunities for developing export potential. Convergence problems in digital sphere were analysed by Stavytskyy et al (2019b). This paper concluded that in some branches convergence problems cannot be fast; therefore, states have to provide special stimulus for faster equalization with neighbours.
Other investigations discussed convergence as an equalization process in income per capita. Havlat et al. (2018) stressed that countries with initially lower levels of economic development should grow faster than higher-income countries, which was supported by a simple model of “absolute beta convergence.” At the same time, investigation of provincial economic convergence in China depends very much on human capital across all its measures. Zhang et al. (2019) underlined that the positive “benefit of being backward” due to lower initial income is almost trumped by the negative impact of low levels of human capital among the poorest areas. It makes economic convergence more difficult even in one country.
According to the economic theory, the term “convergence” means bringing economic closer, the similarities of their institutional mechanisms and economic systems (Verteleva, 2014). By T. Burlay (2019), economic convergence is a process that characterizes the convergence of parameters of development of different geoeconomic entities, which occurs in the context of the movement of outside entities to higher standards and norms demonstrated by the leading entities. The opposite is the phenomenon of divergence, which, on the contrary, is described by the deepening gap in the macroeconomic indicators of the various entities under analysis.
According to Kondius (2014), convergence models must meet several requirements: completeness (taking into account all segments of the object), complexity (all components of the model are interconnected), self-organization (the model is a system of regression equations with different combinations of input and output data), synergy (convergence grows into integration processes), controllability (the model management through free exogenous variables and corrections and adjustments to the model are possible).
The following types of convergence are described in the scientific literature: σ-convergence and β-convergence. In the first case, convergence processes are characterized by a tendency to reducing the variance of regional development indicators, and in the second one, the regions with low levels of development have higher rates of economic growth than countries with high levels of development (β-convergence by R. Barro (1992)).
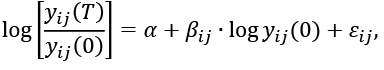
The basic model of convergence processes is the Baumol model (1986) (β-convergence), which is assumed that all countries in the long-term period come to one growth trajectory. The model was improved. Today it is given by the following formula:
 (1)
(1)
where y(T) is the value of the macroeconomic indicator in period T, y(0) is the value of the macroeconomic indicator in the base period (Abreu, M., Groot, H., Florax, R., 2005). The rate of convergence is determined by the β-coefficient: the smaller the value of β, the more intense the convergence processes
 (2)
(2)
The corresponding indicator of the speed of convergence of national economies of countries or particular regions is determined by the formula of X. Sala-i-Martin (Abreu, M., Groot, H., Florax, R., 2005):
 (3)
(3)
The speed of convergence corresponds to the average growth rate of the economy over a period of time and is determined by the rate of approach of the economy to the equilibrium state of β compared) with the initial level of productivity log y(0).
An improvement of the basic model is the adding of dummy variables that correspond to the development level of the individual units of the analysis object, or a matrix of spatial lags to take into account the external effects caused by the characteristics of neighbouring regions. Considering the level of average income per person or the indicator of inequality of their distribution, it should be talked about γ- and Δ-convergence.
Following the classification approach by T. Burlay (2019), the absolute convergence in terms of welfare and relative growth rate is distinguished. Absolute convergence is that countries with higher growth rates will catch up with countries with a higher initial capital level. Relative convergence means that the economy will grow faster the farther it is from its steady state. Relative convergence considers not only the growth rate of absolute indicators but also the quality of applied technologies.
In practice, models of convergence of indicators are built to assess the possibility and the speed of convergence of economies. To a greater extent, the processes of convergence of a separate country and the countries of a certain economic region are analyzed. However, the analysis is performed using a model that takes into account only the dynamics of GDP per capita (Verteleva, 2014) or the impact of processes on certain areas, in particular on the investment climate of the state (Kharlamova, 2009). For example, the analysis of convergence between Ukraine and the European Union not only in the economic but also in the social plane is considered in the work of T. Burlay (2019). D. Popko (2005) defines the models of convergence for trading, foreign direct investment in Ukraine and EU countries. R. Zvarych (2009) considers the processes of convergence in income distribution.
The processes of convergence and divergence for the countries of Central and Eastern Europe are considered by V. Kosedowski (2018), however, the article selects 11 members of EU as representatives of the region, and the comparison is made not through modelling but with the analysis of absolute data values and their relative increments. The researches of convergence processes in this region are also described in (Kocenda, 2001). The analysis was performed based on monthly data on the value of monetary aggregates, the consumer price index and the producer price index for the period 1991–1998.
In the context of the “Treaty of the Eurasian Economic Union” (WTO, 2011) the convergence of the level of revenues, prices and in the public sector (public debt, state budget deficit) are considered as separate indicators. In addition, convergence models can be used to characterize the development of separate sectors of the economy.
By J. Bruha, J. Podpiera (2007) the European Central Bank analyzes possible convergence processes on the example of two countries. The main objects of the model are households and firms. Separate indicators that will characterize the market structure, selected government strategy for economic development, and behaviour of households may be added (Barro, 1992).
To analyze the impact on the system of other factors, it is advisable to introduce appropriate coefficients that will characterize them. O. Onakoya (2012) adds a coefficient corresponding to the monetary or fiscal policy of the country as a separate parameter.
L. Guryanova and S. Prokopovych (2013). provide a generalized model for regulating imbalances in regional development, which should include four main blocks:
• part of valuation for the inequality and cyclical nature of social and economic development of territories;
• part for resource assessment unit;
• part of strategies formation of balanced development of regions;
• part of the control and monitoring of social and economic development of areas.
However, despite the significant contribution of these scientists in the study of inequalities of the development of countries, some aspects of the problem still remain little researched, but actual. Most of the works concerned the study of the convergence of a particular national economy and a particular economic region or the unification of a particular indicator. However, the models did not take into account the general trends that took place within such groups. Also, it should be noted that external factors that affect the processes of convergence and may be the basis for the design of the development strategies of national economies within a particular economic region, which is considered in this article.
Research methods
By I. Kondius (2014), the four basic stages of modelling convergence processes can be distinguished:
1) setting economic objectives, forming research goals;
2) development of a mathematical model;
3) development of a computer model;
4) analysis of results and use of the model to predict the level of convergence.
First of all, the choice of objects for analysis, if necessary, their division into groups or clusters according to certain criteria, if provided by the purpose of modelling (common approach is the use of panel data in modelling convergence processes) should be noted (Kocenda, 2001; Onakova, 2012; Verteleva, 2014). In our case, the modelling of convergence processes is considered on the example of Eastern European countries according to the UN classification.
An economic task in modelling convergence processes can be defined as an analysis of the speed of convergence of national economies within one region, an assessment of the opportunities and prospects for integration of countries into individual economic associations. Besides, convergence models are used to characterize the place of the state among others in the regional context and to determine the optimal development strategy to accelerate the pace of improvement of its position compared to other economic entities. The choice of mathematical models will depend on the set goal.
During modelling convergence processes in the countries of Eastern Europe, the aim was to investigate the rate of convergence of national economies in the region, in particular Ukraine, under the influence of various exogenous and endogenous factors. The result should be the development of the country’s integration strategy in the context of international economic relations.
For the development of convergence models, the first step is to select the optimal system of parameters for modelling the convergence processes. The indicators that will be used to record convergence or divergence separate economic entities through formulas should meet the goal.
It should be noted that there are no clearly defined requirements for the choice of basic parameters of the model. Each scientist or organization chooses its indicators during the analysis of the convergence and divergence processes. The classic set of parameters includes the level of GDP per capita, the consumer price index, the dynamics of the exchange rate (Lucian-Liviu, 2016; Burlay, 2019; Verteleva, 2014; Kondius, 2014).
In addition, a separate stage of modelling is to check the selected system of indicators for multicollinearity. If the result of the model testing is positive, you should choose another system of parameters. In this case, the simplest method of solving the problem is to exclude the variable from the multicollinear pair, replace it with another indicator, increase the number of observations or use another functional form. By E. Koсenda (2001), the constructed matrices of correlation coefficients can also be used to divide all countries into separate groups.
Taking into account these aspects, 10 key parameters were identified to characterize the various components of the economic system: GDP per capita, average household income, health expenditures per capita, expenditures per student, GDP per employee, index of political stability, income inequality index, defence expenditure per capita, level of environmental pollution, the level of economic freedom.
The analysis of the basic system of parameters for multicollinearity was carried out by checking the determinant equality to zero of the correlation matrix according to the Farrar-Glouber test. In the case of multicollinearity, it is necessary to use a new functional form and/or exclude certain parameters.
The modelling was carried out in two stages: the first is about the assessment of the presence of σ-convergence for all countries in the region, the second is about the evaluation of β-convergence in Eastern Europe and its value in the pairwise analysis of national economies.
To determine the imbalance in the development of regions was used σ-convergence, which is one of the most common methods of statistical analysis of economic growth and shows the dynamics of changes between different objects which analyzed over time by a selected indicator (in mathematical interpretation it is an analysis of variance or variability indicator) (Burlay, 2019). The definition of σ-convergence processes was calculated through the GDP per capita as the standard deviation of the natural logarithms of absolute values in a certain time period:
 (4)
(4)
where yit is the value of GDP per capita for the i-th country in time t, μt is the regional average value of natural logarithms of GDP per capita in time t. σ-convergence is observed if there is a decrease in the value of σt over time.
βij-coefficients, where i is the corresponding country, j is the macroeconomic indicator for comparison, were determined according to the results of regression analysis according to the formula from the Baumol’s model (2) (1986), which for the convergence of macroeconomic parameters looks like:
 (5)
(5)
where yij is the value of the corresponding j-th macroeconomic indicator for the i-th country in the base (y(0)) period of time or period T. The value of the coefficient β will allow to draw conclusions about the existence of convergence or divergence of national economies. The speed of β-convergence was calculated by the formula of X. Sala-i-Martin (3).
As the determined indicators of the rate of β- and/or σ-convergence are not constants and depend on many external conditions, to comprehensively analyze the convergence processes it is necessary to add parameters, that would correspond to factors that accelerate or slow down such changes, to the basic model that determines the real changes in macroeconomic indicators.
Three different scenarios have been identified to the modelling of convergence processes in Eastern Europe. The indicators, that characterize each of the scenarios, were the exchange rate of the national currency (exchange_rate), the real interest rate (real_rate), as well as the structure of exports, namely the share of raw materials in government exports (raw_percent).
To characterize the influence of each of these parameters as external factors, the intensity of their relationships with parameters of the model was calculated using regression analysis. Thus, the best in terms of characteristics is the model that shows the relationship between the logarithm of GDP growth per capita and the sum of the logarithms of exchange rate growth and the share of raw materials. The relationship between the values of the dynamics of the real interest rate and the base model is weak, so in the final version of the model, this parameter was not considered.
Once the values of the coefficients which show the influence of external factors on the model have been obtained, the next step is to forecast the possible ranges of change in GDP per capita for each country. According to the obtained parameters, a pairwise analysis of β-convergence was performed for each country of the region. The analysis consisted of studying the pairwise coefficient of convergence of the national economy with other countries in the case of changes in external factors.
Under the testing results, the selected parameters for all analyzed countries were multicollinear. In this regard, a new functional form (relative growth of variables in contrast to absolute data) was chosen, and some indicators that were collinear with each other were excluded. Thus, the final system of parameters is as follows: relative GDP growth per capita (gdp_per_capitat, US dollar/person), GDP per employee (gdp_per_workert, US dollar/person), income inequality (inequality, unit share), defence spending per capita (defense_per_capitat, US dollar/person), level of environmental pollution (pollution, unit share) and absolute values of the level of economic freedom (ec_freedomt, 100-point scale) over a period of time (year). It should be noted that for all considered macroeconomic indicators there are convergence processes in the period from 2009 to 2018.
According to the selected optimal system of macroeconomic indicators, the rate of convergence in Eastern Europe was determined.
Results
In general, Eastern Europe has not had a stable development trend over the last 10 years. Both convergence and divergence processes were observed in Eastern European countries, but the convergence trend prevailed to a greater extent, as evidenced by the results of verification of data for the presence of σ-convergence processes. During 2009–2013, Eastern European countries showed a converging trend in terms of GDP per capita (the value of σt changed from 0.7689 in 2009 to 0.6277 in 2013). That development trend after the signs of divergence that took place in 2014-2016 (σ2016 increased to 0.7189), resumed in 2017, but still has not reached its minimum value (σ2018=0.6702), which was observed in the analyzed period (Figure 1).
Another approach to the analysis of convergence processes was the assessment using the β-convergence model, which described the role of each of the above chosen macroeconomic parameters for all Eastern European countries.
Calculated according to the Baumol model (5) coefficient β is negative, which indicates the convergence of national economies over the past 10 years. At the same time, it should be noted that the highest rate of convergence of national economies, according to the obtained value of the parameter λ by the formula of X. Sala-i-Martin (3), are observed by the index of economic freedom (β = –0.3392; λ = 0.0414). Instead, the lowest values are characterized by convergence in terms of income inequality, where β = –0.0794 (Table 2). Also, taking into account the divergence of processes in 2014-2016 according to the σ-convergence model (Table 1), the value of β-convergence was calculated for each of the periods: 2009-2013, 2014-2016 and 2017-2018.
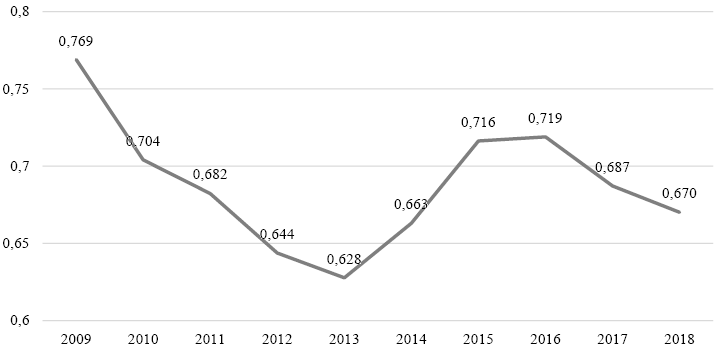
Figure 1. Value of σ-convergence for countries of Eastern Europe
Source: authors’ calculations.
Table 2. Value of β-convergence for countries of Eastern Europe
|
Indicator |
βі |
λі |
R2 |
p-value |
|
2009–2018 |
||||
|
GDP per capita |
-0.1440 |
0.0155 |
0.4351 |
0.03796 |
|
GDP per employee |
-0.0830 |
0.0087 |
0.2709 |
0.01230 |
|
Income inequality indicator |
-0.0794 |
0.0083 |
0.0076 |
0.04818 |
|
Defense costs per capita |
-0.0954 |
0.0100 |
0.1704 |
0.02358 |
|
Level of environmental pollution |
-0.1551 |
0.0169 |
0.2297 |
0.01610 |
|
Level of economic freedom |
-0.3392 |
0.0414 |
0.5929 |
0.05918 |
|
2009–2013 |
||||
|
GDP per capita |
-0.1873 |
0.0207 |
0.4637 |
0.03017 |
|
GDP per employee |
-0.0619 |
0.0064 |
0.4000 |
0.04974 |
|
Income inequality indicator |
0.0195 |
-0.0019 |
0.0020 |
0.04903 |
|
Defense costs per capita |
-0.0309 |
0.0031 |
0.0199 |
0.03672 |
|
Level of environmental pollution |
-0.0434 |
0.0044 |
0.0785 |
0.04330 |
|
Level of economic freedom |
0.0323 |
-0.0032 |
0.0564 |
0.05089 |
|
2014–2016 |
||||
|
GDP per capita |
0.0889 |
-0.0085 |
0.0590 |
0.04989 |
|
GDP per employee |
0.0256 |
-0.0025 |
0.0521 |
0.05061 |
|
Income inequality indicator |
0.0472 |
-0.0046 |
0.0386 |
0.04866 |
|
Defense costs per capita |
-0.0565 |
0.0058 |
0.1120 |
0.03445 |
|
Level of environmental pollution |
-0.0189 |
0.0019 |
0.0116 |
0.04767 |
|
Level of economic freedom |
-0.1775 |
0.0195 |
0.1943 |
0.02023 |
|
2017–2018 |
||||
|
GDP per capita |
-0.0255 |
0.0026 |
0.2919 |
0.01069 |
|
GDP per employee |
-0.0086 |
0.0009 |
0.2930 |
0.01061 |
|
Income inequality indicator |
0.0629 |
-0.0061 |
0.2467 |
0.01442 |
|
Defense costs per capita |
-0.0068 |
0.0007 |
0.0047 |
0.04850 |
|
Level of environmental pollution |
-0.0075 |
0.0007 |
0.0071 |
0.48168 |
|
Level of economic freedom |
0.0000 |
0.0000 |
NaN |
NaN |
Source: authors’ calculations.
In the post-crisis period during 2009–2013, most of the parameters of the countries of the Eastern European region were characterized by the convergence of economies. The fastest convergence processes were inherent GDP per capita (β = –0.1873). At the same time, despite the general convergence trend, the divergence process was observed in terms of the level of economic freedom and the value of income inequality (β = 0.0322; β = 0.0194, respectively).
During the period of general divergence of national economies, according to the σ-convergence model (2014-2016), the value of GDP per capita, GDP per employee, inequality per capita β exceeded 0.02 points. However, other parameters were characterized by a slight tendency to converge.
The last period is characterized by the least representativeness due to the small sample but fully corresponds to the tendency of the dynamics that were inherent in 2009–2013.
A pairwise analysis of β-convergence between individual countries is given in Table 3. It can be concluded that the greatest convergence was in Poland with Moldova (β = –0.22), Slovakia (β = –0.18) and Hungary (β = –0.18), which is confirmed by the dynamics absolute value of macroeconomic data. For example, the difference between the GDP per capita of Poland and Moldova has halved in ten years. Following the value of β, the convergence of the Polish economy also took place in Ukraine, the Russian Federation and Bulgaria.
Convergence processes have also been observed in Hungary with the Russian Federation, Romania, Bulgaria, Slovakia and Moldova. These results are explained by the slowdown in the economic growth of more developed countries (GDP per capita in Hungary in 2018 compared to 2009 increased by 23.9%, Slovakia – by 17.6%) and higher growth rates of the analyzed indicator in less developed countries (GDP per capita in Moldova increased during the analyzed period by 111.6%, Romania – by 43.9%, Bulgaria – by 33%), what β-convergence characterizes. On the other hand, Belarus is characterized by divergence processes in comparison with all countries in the region. GDP per capita has grown by only 17.5% over the last 10 years.
Ukraine shows convergent dynamics with Poland (β = –0.16), a slight convergence (β coefficient was more than –0.1 points) was observed with Bulgaria, the Russian Federation and the Czech Republic. Divergent processes are taking place with all other countries, which is explained by the worst GDP per capita in the region and the lowest value of economic growth (over the past 10 years, the figure has grown by 21.7%).
Table 3. Pairwise value of β-convergence for countries of Eastern Europe
|
Belarus |
Bulgaria |
Moldova |
Poland |
Russia |
Romania |
Slovakia |
Ukraine |
Czech Republic |
Hungary |
|
|
Belarus |
0,18 |
0,07 |
1,43 |
0,08 |
0,2 |
0,08 |
0,03 |
0,62 |
0,01 |
|
|
Bulgaria |
0,18 |
0,49 |
-0,13 |
0,06 |
0,45 |
0,2 |
-0,06 |
0,21 |
-0,09 |
|
|
Moldova |
0,07 |
0,49 |
-0,22 |
0,17 |
0,7 |
0,5 |
0 |
0,05 |
-0,05 |
|
|
Poland |
1,43 |
-0,13 |
-0,22 |
-0,14 |
-0,01 |
-0,18 |
-0,16 |
0,47 |
-0,18 |
|
|
Russia |
0,08 |
0,06 |
0,17 |
-0,14 |
0,69 |
0,34 |
-0,04 |
0,04 |
-0,17 |
|
|
Romania |
0,2 |
0,45 |
0,7 |
-0,01 |
0,69 |
1 |
0,02 |
0,2 |
-0,12 |
|
|
Slovakia |
0,08 |
0,2 |
0,5 |
-0,18 |
0,34 |
1 |
0,01 |
0,04 |
-0,05 |
|
|
Ukraine |
0,03 |
-0,06 |
0 |
-0,16 |
-0,04 |
0,02 |
0,01 |
-0,02 |
0,31 |
|
|
Czech Republic |
0,62 |
0,21 |
0,05 |
0,47 |
0,04 |
0,2 |
0,04 |
-0,02 |
-0,04 |
|
|
Hungary |
0,01 |
-0,09 |
-0,05 |
-0,18 |
-0,17 |
-0,12 |
-0,05 |
0,31 |
-0,04 |
Source: authors’ calculations.
Impact analysis of external factors (exchange rate and change in the structure of exports, namely the share of raw materials) under other constant conditions showed that the speed of convergence processes increases significantly for most countries in the region, except Hungary and Poland, where convergence processes are observed ( β-values are negative), but due to the influence of external factors, the convergence processes, on the contrary, were slowed down.
It should be noted that despite the unequal impact of external factors on GDP per capita in Eastern Europe, the generalization of the results shows the unidirectional effect. The greatest influence on the pairwise convergence coefficients of the change of external factors was observed in Belarus (even though the country without external factors is characterized by divergence in comparison with other Eastern European countries), Romania and the Czech Republic. There were almost no fluctuations in Hungary and Ukraine.
Focusing on Ukraine, the following aspects were identified. Ukraine is characterized by the latest positions in various macroeconomic parameters. According to the values of pairwise coefficients of β-convergence, it should be noted that this country has a tendency to converge GDP per capita with four of the other nine representatives of the region (Bulgaria, Poland, Russia, Czech Republic) (Table 3), but the speed of such convergence is insignificant (the coefficient β is greater than –0.2). However, at the same time, due to the influence of external factors, the results of the assessment of the convergence processes may change.
Conclusion and Discussion
The convergence of macroeconomic indicators and the convergence of national economies within individual regions is a way to increase the efficiency of country development in the context of globalization. Analysis of the macroeconomic situation in Eastern Europe over the past 10 years allows us to conclude the inequality of countries development.
The values of β- and σ-convergences were evaluated and consisted in calculating the direction and speed of convergence of national economies on individual indicators in comparison with the region as a whole and a pairwise comparison with each of its members.
An assessment of convergence processes in the region allows us to conclude about the ambiguous trend of convergence or divergence process. The value of σ-convergence shows the convergence of national economies in terms of GDP per capita during 2009–2013, when the calculated ratio decreased from 0.77 to 0.63, which is due to the joint exit of the region from the crisis. The period of 2014–2016 was characterized by the divergent trend, which is also explained by the change of stage in the economic cycle, instability in some countries in the region, but the last two years of analysis changed the divergence into convergence, but β did not reach 2013.
Our analysis of the β-coefficient for 2009–2018 makes it possible to conclude the general convergence processes of macroeconomic indicators, because the generalized value of β is negative in all cases. Given the inequality of development of convergence processes during the analyzed period, the β-convergence index was calculated separately for each of the periods determined by the value of the σ-coefficient. According to the obtained results, in general, it may be concluded that the β-coefficients calculated in these periods correspond to the general trends of the system.
In order to analyze the contribution of each country to the convergence process, the value of the pairwise coefficient of β-convergence for all countries in terms of GDP per capita was also calculated. As a result of the study, it was concluded that Poland and Hungary have the highest speed in the process of convergence of indicators in the analyzed region, which is explained by the fact that countries with a higher level of development have lower economic growth rates (absolute convergence). On the other hand, divergence with all other states is typical of Belarus.
In addition, possible scenarios for the convergence processes were identified, taking into account the influence of external factors. As a result of modelling the impact of exogenous factors on the system, it may be concluded that the convergence processes are accelerating for most countries.
Thus, the design of the development strategy should take into account trends in the convergence of its macroeconomic indicators with other representatives of the region. At the same time, it should be noted that for Ukraine such a strategy should start primarily with the legislation. In this context, there is a need to improve and adapt regulatory framework, which regulated international economic relations (including Customs Code), for international standards. This will improve the country’s position in the ranking of economic freedom and doing business index.
The next component is the economic sphere. As Ukraine is characterized by a slower pace of development than other countries in the region, the country’s development strategy should be as catching up and be aimed at increasing the pace of economic development in order to accelerate the reducing of existing inequality. Thus, the strategy of the state policy in Ukraine should be focused on increasing the pace of its development.
In this case, first of all, it is worth to point out the incentives to national producers, their protection from foreign competitors, unfair imports, the introduction of favourable conditions for the small and medium-sized businesses. Also, an important aspect is to support innovative development, investment in scientific and technological progress, which can be achieved through increased cooperation between higher education institutions, research institutions and the real sector of the economy, providing tax benefits for producers of high-tech products that can be competitive (Bezrukova, 2010). Thus, it is necessary to focus on the development of perspective innovative industries, which in the shortest period will lead to the improvement of macroeconomic indicators. Actions aimed at economic development will eventually lead to an increase in the level of economic development of the country, expressed using GDP per capita. At the same time, the use of the latest developments will help to switch to energy-efficient production technologies and reduce greenhouse gas emissions into the environment.
Besides, overcoming disparities in the development of the national economy of the country and the region should also include the convergence of relevant indicators at the local level, rationally using the social and economic potential of individual economic regions, which in turn will reduce income inequality.
However, it should be noted that all actions must be systematic and justified. On the other hand, it is impossible to avoid the fact that today in the conditions of the spread of the COVID-19 pandemic and its varying intensity in some countries, which has significantly affected foreign economic relations between states. The quarantine has partially stopped economic processes, caused their reorientation to new methods of production and processes of selling goods, and influenced the position of countries in the world community. Therefore, it is currently impossible to predict the features of the world’s convergence processes, as there are still constant daily changes due to the aggravation or weakening of the epidemiological situation.
Thus, the modelling of alignment processes is a complex process that must take into account both temporal and spatial aspects, as well as the influence of external factors.
References
Abreu, M., Groot, H., Florax, R.. (2005). A meta-analysis of beta-convergence: The legendary two-percent. Tinbergen Institute Discussion Paper, Vol. 001/3, 45 p.
Barro, Robert J., Sala-i-Martin, X.. (1992). Convergence. Journal of Political Economy 100(2): PP. 223-251.
Baumol, W. (1986). Productivity Growth, Convergence, and Welfare: What the Long-Run Data Show. The American Economic Review. Vol. 76, No 5, PP. 1072-1085.
Bazavluk, N., Bezrukova, N. (2010). Inequality of economic development: analysis of modern world trends. Scientific Bulletin of Poltava University of Economics and Trade, Vol. 5, PP. 22-28.
Bruha, J., Podpiera, J. (2007). Transition Economy Convergence in a Two-Country Model: Implications for Monetary Integration. European Central Bank. Vol. 750, 63 p. https://www.ecb.europa.eu/pub/pdf/scpwps/ecbwp740.pdf.
Burlay, T. (2019). Social and economic convergence: theory and practice. Kyiv: SI “Institute of Economics and Forecasting of NAS of Ukraine”, 343 p. Retrieved: nas.gov.ua/siaz/Ways_of_development_of_Ukrainian_science/article/19078.051.pdf
Guryanova, L., Prokopovych, S. (2013). The model estimates the impact of interregional interaction on the processes of convergence of the territories. Bisnessinform, Vol. 1, PP. 62-67.
Havlat, M., Havrlant, D., Kuenzel R., Monks, A. Economic Convergence in the Czech Republic and Slovakia. Luxembourg: Publications Office of the European Union, 2018. doi: 10.2765/988425. Retrieved from: https://ec.europa.eu/info/sites/info/files/economy-finance/eb034_en.pdf
Kharlamova, A. (2009). Effects of convergence / divergence on the regional investment climate of Ukraine. Investments: practice and experience, Vol. 4, PP. 4-7. http://nbuv.gov.ua/UJRN/ipd_2009_4_3.
Koсenda, E. (2001). Macroeconomic Convergence in Transition Countries. Journal of Comparative Economics, Vol. 29, PP. 1-23. https://www.sciencedirect.com/science/article/pii/S0147596700916962.
Kondius, I. (2014). Economic and mathematical principles of forecasting the level of convergence of regions. Financial space, Vol. 1, PP. 74-79.
Kosedowski, W. (2018). The issues of economic growth and convergence of Central and Eastern Europe regions. Economic Bulletin of the University, Vol. 37/1, PP. 303-311.
Lucian-Liviu, A. (2016). Trends in the relation between regional convergence and economic growth in EU. ECONSTOR: Congress of the European Regional Science Association: “Cities Regions: Smart, Sustainable, Inclusive?”. https://www.econstor.eu/bitstream/10419/174641/1/Paper0244_LLAlbu.pdf.
Onakoya, O., Oseni, I. (2012). Macroeconomic Convergence and Growth in ECOWAS Countries. INTERNET AFRREV, Vol. 1, PP. 79-82. https://publication.babcock.edu.ng/asset/docs/publications/ECON/9504/2073.pdf.
Popko D., Tkachuk, O. (2005). Modeling the convergence of Ukraine to the EU. http://www.kneu.kiev.ua/journal/ukr/article/2005_2_PopkoTkachuk_ukr.pdf.
United Nations. (1999). Standard country or area codes for statistical use (M49). https://unstats.un.org/unsd/methodology/m49/.
Stavytskyy, A., Kharlamova, G., Giedraitis, V., Sengul, E. (2019a) Gravity model analysis of globalization process in transition economies. Journal of International Studies. 12(2). PP. 322-341. https://doi.org/10.14254/2071-8330.2019/12-2/21.
Stavytskyy А., Kharlamova G., Stoica E.A. (2019b) The Analysis of the Digital Economy and Society Index in the EU. TalTech Journal of European Studies. Tallinn University of Technology (ISSN 2228-0588). Vol. 9, No. 3 (28). PP. 245-261. https://doi.org/10.1515/bjes-2019-0032.
World Trade Organisation (WTO). (2011). Treaty of the Eurasian Economic Union. 715 p. https://www.wto.org/english/thewto_e/acc_e/kaz_e/WTACCKAZ85_LEG_1.pdf.
Verteleva, O.O., Verteleva, O.V. (2014). Economic convergence of EU countries and prospects of European integration of Ukraine. Economy and State, Vol. 11, PP. 97-100. http://www.economy.in.ua/pdf/11_2014/23.pdf.
Zhang, X., Li, H., Wang, X., Fleisher B. M. (2019) Human Capital and the Economic Convergence Mechanism: Evidence from China. IZA DP No. 12224. http://ftp.iza.org/dp12224.pdf.
Zvarych, R. (2009). Transformation of income convergence policy in the enlargement process of European Union. Ternopil: Ternopil National Economic University, 300 p.