Ekonomika ISSN 1392-1258 eISSN 2424-6166
2020, vol. 99(2), pp. 39–58 DOI: https://doi.org/10.15388/Ekon.2020.2.3
An Assessment of House Loans Cointegration with Macro Variables in Selected Euro Zone Countries
Kazys Kupčinskas
Faculty of Economics
Vilnius University, Lithuania
E-mail: k.kupcinskas@gmail.com
Prof. dr. Arvydas Paškevičius
Faculty of Economics
Vilnius University, Lithuania
E-mail: arvydas@paskevicius.com
Abstract. This paper performs an empirical study on house loans, interest rates, unemployment, and house rent prices relationship in Germany, France, Spain and Italy from the year 2003 to 2018. We look for the cointegration and causality relationship between the house loans and macro variables with the help of the Vector error correction model (VECM) and Granger causality methods. We investigate whether variables with monthly data explain better the relationship and causal effects between the variables. We find a long term cointegrating relationship between the real house loans and interest rates, unemployment and house rent prices for France, Spain, and Italy, but not for Germany. On average the equilibrium in house loan development is reached from 4 to 8 years, meaning that long term equilibrium exists, but the variables reach it in a rather long time period. The ECB deposit facility rate included as an exogenous variable in four countries gained no significant power in explaining the short term changes of house loans in any of the country. We reveal a complex interaction between the bank’s credits and unemployment, interest rates, house rental prices in the paper.
Keywords: cointegration, vector error correction model, house loans
Received: 30/04/2020. Revised: 28/06/2020. Accepted: 29/06/2020
Copyright © 2020 Kazys Kupčinskas, Arvydas Paškevičius. Published by Vilnius University Press
This is an Open Access article distributed under the terms of the Creative Commons Attribution License, which permits unrestricted use, distribution, and reproduction in any medium, provided the original author and source are credited.
1. Introduction
The development of the private credit market during the last two decades is as of interesting study, because the period between 2003 and 2018 covers full business cycle – two expansions, one financial crisis, and one recovery period just before the COVID-19 crises.
We are interested in whether high-frequency data, like monthly time series, can establish more fruitful results throughout the business cycle for our research object – house loans to private individuals. We check if the hypothesis is valid across the four largest mortgage markets in Euro zone – Germany, France, Italy, and Spain. For that purpose, we have established a vector error correction model (VECM) to find the cointegrating relationships between house loans, cost of borrowing, unemployment and house rent prices. Most of the studies in the field are using either yearly or quarterly data. Annual and quarterly data used in modeling can produce different results for the same countries depending on the frequency of the data (Constantinescu and Lastauskas, 2018). As one of the main economic activity indicators – GDP is not available on monthly data. Hence, we have decided to omit the GDP and substitute it with a very lagged and inverse variable for economic development as - unemployment. Unemployment is measured and available in monthly frequency. It is widely used by other authors (Acemoglu, 2001; Dromel, Kolakez, and Lehmann, 2010; Petrosky, 2014; Bethune et al., 2015), who analyzed private credit or house loans. We have chosen VECM approach because of the non-stationary data, possible long term cointegration between variables and less strict restrictions over economic dependencies of variables in the model. Also in VECM analyses we have included ECB deposit facility rate as an exogenous variable in 4 countries to find out the short term effects of the ECB instrument impact upon the house loan development.
The credit availability due to technological information spread and access through online channels became much more available and affordable, thus we are particularly interested on how the interaction of the housing market and unemployment, interest rates and costs of the housing has emerged during the last decades in four largest European Union countries, in terms of total house loan portfolio. There is number of studies of the interaction between the credit market and the macroeconomic variables, covering long term periods of time since the last century, however the banking sector is gradually transforming and old theories and empirical results needs to be tested in the new environment.
The main objectives of the paper: a) explain how house loans are modeled based on existing economic models and ideas; b) classify key macroeconomic factors affecting private credit and house loans; c) present a methodology that is most suitable to investigate house loans with a high frequency of data; d) Explain short term and long term relationship between house loans, unemployment, interest rates and price of real estate e) measure Granger causality of the variables.
The paper is organized as follows: a review of the literature section, data and descriptive analyses section, methodology and finally results sections.
2. Literature review
2.1. Factors Affecting Housing Market
Mortgage market research is traditionally split into credit supply and demand models. Recent studies show that credit supply theory stands better than credit demand theory because private households tend to borrow extensively even if there are obvious signs of a downturn in the economy (Mian et al., 2016). The most noticeable channels are the wealth and the balance sheet. The wealth effect for households creates more borrowing and spending abilities due to increased collateral value when prices of real estate go up. The channel of balance sheet is a monetary policy transmission process through the bank’s balance sheet. When prices of real estate, which is the most common collateral for the bank, increases - the bank’s balance sheet becomes stronger and credit supply is not restricted due to lower collateral risk. The Interest rates channel – is a mechanism of monetary transmission policy, when depository institutions have to pay a certain deposit facility rate for funds held within ECB. Short term interest rates affect the long term interest rates that are the main determinants of the borrowing costs for households. Channels of wealth, balance sheet, and interest rates explain how market forces and regulatory institutions can influence credit supply and demand in the market.
One of the key functions of the central bank is to follow up on the development of the private credit. Since the last financial crises in the year 2008 economists and supervisory bodies have recognized the drawbacks of rapid housing market developments for the economy. There are a number of reasons why excessive borrowing is harmful for the economy - first of all, it creates house price booms, increases interest rates and debt burden for households, lowers affordability of housing for new low-income society members, increases rental costs, creates cycles in the economy and productivity shocks and slowdown of economic activity (Egert and Mihaljek, 2007). The main determinants of the housing market are considered the following: GDP growth, unemployment, interest rates, household’s income growth, GDP per capita, liquidity in the market for real estate sales; taxes; trust in the legal system and property rights; demographic factors, house market supply and demand trends and development. Further, we will discuss some of the determinants and their interactions with economic variables.
2.2. Unemployment
Openness of the credit channel for new technology and innovations is very important for credit growth and level of unemployment. Credit market difficulties do not necessarily lead to higher unemployment as found in an empirical study of post-World War II era. Acemoglu (2001) found that countries, like Belgium, Italy and Denmark, with low debt level industries on average had two times higher employment level when compared to USA. European industries with high credit level had on average 30% higher employment level then USA. Other studies show that asymmetric information results in business cycles between the capital and labour markets (with free floating labour costs and prices), when business firms strive for maximization of their profits (Greenwald and Stiglitz, 1986). However other studies (Dromel, Kolakez and Lehmann, 2010) show that credit constraints, such as market imperfections, do not necessary increase the level of unemployment rate, but significantly reduce unemployment persistence to change.
Besides the asymmetric information and openness of the credit channel, the unrestricted borrowing has also effect upon the unemployment. The maximum borrowing limits of the households depends on the complexity of the financial system, frequency of the liquidity shocks in the economy, and liquid household assets that serve as collateral. The theoretical model claims that unconstrained borrowing reduces the alternative costs of new hiring when market pressure for higher wages emerges. The elasticity of the job market improves when costs of financing for new hires are lower because it encourages recruitment by the firms. Unemployment, through the vacancy costs and wage channels, match the volatility and credit market persistence (Petrosky, 2014). Multiple steady states or equilibriums between the credit and labor markets exist, because both markets are sustaining each other. For example, in the USA during 1980 and 2008 the decline of the long term average unemployment rate jumped after 3 quarters of the rise in unsecured household lending (Bethune, Rocheteau and Rupert, 2015).
In other economic sectors, credit growth is related with real productivity increase, but this is not the case for the construction industry. Rapid growth in the financial sector usually coincides with a boom in the construction industry (Cecchetti and Kharroubi, 2015). It is because real estate and construction industries are rich in terms of collateral and low in productivity growths. Labor division between the skilled and unskilled workers creates pressure for the financial sector. The manufacturing industry is a lot dependent on the financial sector due to heavy need for R&D or external financing and sector’s heavy growth is at the expense of real economy growth. It leads to cycle development of the economy and ups and downs in the unemployment rate.
2.3. Cost of borrowing and interest rates
During the last decade the environment of decreasing interest rates in the Euro area did not allow to establish models that would account for a sharp increase in interest rates and consequently lower demand for credit. While in periods of volatile interest rates innovations of short-term interest rates were suppressing the development of bank credit and GDP. Hoffman (2001) found that house property prices established long-term relationships between the credit, short and long-term interest rates. Mian et al. (2016) found that lower interest rates spread encourage growth of debt to GDP ratio and afterwards higher debt to GDP ratio increased unemployment. Factors as exchange rate regime, monetary policy, share of foreign trade (current account minus or surplus) had effect on the household debt and consumption. When household debt increases due to increased debt burden the consumption decreases and imports decreases.
2.4. Prices of real estate and house rent
If rents for housing increases more than housing pricing, than in the long term there would be a upward pressure on house prices, if we believe a long term equilibrium exists. In such situation, it would be more favorable to buy a house instead of paying an increased rent. House rent index in the harmonized consumer price index is positively related with house rents (Jacobsen and Naug, 2005). Lagged shocks in the commercial real estate prices are the main contributors to the variation of the asset prices, while GDP and bank credit variables had less significant effects for the results (Davis and Zhu, 2011).
There is no common consensus on what variables and methods should be applied for modeling the demand for house loans also it is difficult to strictly differentiate which factors affect only the supply or the demand side. Apart from the macroeconomic, demographic and legal factors, there is a number of financial stability indicators used in the analyses of private credit development to relate to a number of macro prudential policy implications. When demand and supply for credit is in disequilibrium, there are additional costs for the economy (higher interest rates, higher prices). A mixture of ratio or level variables is used for the assessment of imbalances. Modeling sustainable credit development means identifying a credit gap or excess volume of credit. Excess of credit creates an additional need for credit provisions for the banking system. Shortage of credit increase interest rates and decrease house prices although the relationship between the credit prices and credit volume are complicated and in different directions.
2.5. Summary of econometric methods for the housing market
Overall, the dynamic stochastic general equilibrium (DSGE) models are based on fundamental economic principles. However, DSGE model has problems in explaining empirical case studies when it comes to house price dynamics and population growth, construction costs, interests and house rental costs (Diks and Wang, 2016, Shiller, 2015). The same falls for the consumption of households and industrial production levels that are unable to explain the instability of house prices (Davis and Heathcote, 2005). When the cointegrating coefficients are subject to possible non-linear relationship and cross-equation restrictions Long run structural modeling is a solution for modeling. Autoregressive distributed lag model was used by Constantinescu and Lastauskas (2018), Pesaran and Shin (1998), and other authors. An additional test of Granger causality is widely used to define the direction of the effect for structural models between the variables (Constantinescu and Lastauskas, 2018; Panagiotidis and Printzis, 2016).
Structural models for macro variables suffer from a number of endogeneity problems; thus vector error correction (VECM) model without such restrictions is an attractive choice. VECM models are very useful for the long-term relationship establishment, but the other benefit is the ability to include exogenous variables and estimate short-term effects (Panagiotidis and Printzis, 2016).
There are a number of authors (Anundsen et al., 2016; Arestis et al. 2014; Davis and Zhu, 2011; Hoffman, 2001) who performed cross country analyses for a large group of countries, to find out private credit interaction with aggregated macro variables. Panel vector error correction model for cross-country credit empirical analyses is advantageous of the single country analyses due to ability to aggregate the data when single country yearly data are too short for multivariate regression analyses.
3. Methodology
3.1. Data used in analyses
We have used a monthly time series data of four countries (Germany, France, Spain, Italy) covering period of from year 2003 to end of 2018. The variables (unemployment rate, costs of funding loans and costs of renting real estate) were selected based on credit demand and supply theories to recent empirical studies.
3.2. Short overview of the credit market and selected variables development
The largest house loan market in euro area was Germany with a 1231 trillion euro home loan portfolio; the second was France - 1046 trillion euro; third - Spain 517 trillion euro, and Italy 380 trillion euro. Since 2003 the average annual grow rate of house loan portfolio (in nominal values) was 2% in Germany, and 12% in France and Italy. The scenario for Spain was different - peak of house loan portfolio equal to 658 trillion euro was reached at the end of year 2008. Afterwards slow deleveraging happened and by the end of year 2018 house loans in Spain reached the lowest value of 517 trillion euro (See APPENDIX 2).
Home ownership rate at end of year 2018 in selected European countries varied across the countries: in Germany - 52%, in France 65%, in Italy – 72% and in Spain - 75%, while the rest of tenants rented the flat. In Germany, France and Spain about a half of home owners had house loans, while in Italy only 25% of tenants had a mortgage. Level of home ownership with mortgages corresponds to the average households debt ratios in the countries: In France 96%; In Spain 91%; In Germany 87% and in Italy 62%.
Table 1. Descriptive statistics of the variables in Germany and France
|
Country |
Germany |
France |
||||||
|
|
Log of real house Loans volume |
Households cost of borrowing,% |
Unemployment rate,% |
House rent price, % |
Log of real house Loans volume |
Households cost of borrowing,% |
Unemployment rate,% |
House rent price, % |
|
Mean |
7.178 |
3.53 |
6.82 |
1.94 |
7.126 |
3.41 |
9.21 |
2.63 |
|
Median |
7.180 |
3.77 |
6.44 |
2.00 |
7.143 |
3.67 |
9.15 |
2.70 |
|
Std. Dev. |
0.014 |
1.24 |
2.45 |
1.81 |
0.045 |
1.06 |
0.83 |
1.71 |
|
Variance |
0.000 |
1.55 |
5.98 |
3.26 |
0.002 |
1.12 |
0.68 |
2.93 |
|
Range |
0.061 |
3.87 |
7.99 |
7.60 |
0.188 |
3.86 |
3.31 |
7.60 |
|
Min. |
7.145 |
1.61 |
3.25 |
-1.80 |
7.001 |
1.48 |
7.24 |
-1.50 |
|
Max. |
7.206 |
5.48 |
11.24 |
5.80 |
7.190 |
5.34 |
10.55 |
6.10 |
|
Count |
192 |
192 |
192 |
192 |
192 |
192 |
192 |
192 |
Source: summary made by authors
Annual changes in house rent prices averaged: 1.94% in Germany, 2.63% in France, 2.99% in Spain, and 2.68% in Italy. Households cost of borrowing followed a downward trend due to the ECB low interest rate policy after 2008 financial crises. Average nominal interest rates for house loans were similar: in Germany - 3.5%, in France - 3.4%, in Spain - 3.20% and in Italy - 3.6%. Average unemployment rate was traditionally highest in Spain – 16.7%, than in Italy – 9.3%, France 9.2% and lowest in Germany 6.8% (see TABLE No.1 and No.2).
Table 2. Descriptive statistics of the variables in Spain and Italy
|
Country |
Spain |
Italy |
||||||
|
Log of real house Loans volume |
Households cost of borrowing,% |
Unemployment rate,% |
House rent price, % |
Log of real house Loans volume |
Households cost of borrowing,% |
Unemployment rate,% |
House rent price, % |
|
|
Mean |
7.123 |
3.20 |
16.77 |
2.99 |
6.977 |
3.55 |
9.32 |
2.68 |
|
Median |
7.135 |
3.10 |
17.71 |
3.45 |
6.997 |
3.68 |
8.49 |
2.75 |
|
Std. Dev. |
0.057 |
1.07 |
6.05 |
3.34 |
0.048 |
1.07 |
2.13 |
2.81 |
|
Variance |
0.003 |
1.14 |
36.56 |
11.14 |
0.002 |
1.15 |
4.55 |
7.87 |
|
Range |
0.232 |
4.23 |
18.38 |
15.60 |
0.194 |
4.12 |
7.22 |
11.20 |
|
Min. |
6.957 |
1.84 |
7.93 |
-7.20 |
6.831 |
1.79 |
5.83 |
-2.40 |
|
Max. |
7.190 |
6.07 |
26.31 |
8.40 |
7.025 |
5.91 |
13.05 |
8.80 |
|
Count |
192 |
192 |
192 |
192 |
192 |
192 |
192 |
192 |
Source: summary made by authors
3.3. Description of the variables:
• Log of Real House Loans volume (abbreviation: RHL) – describes loans to euro area households for house purchase, including all currencies and all maturities that are denominated in euro. The initial data was not seasonally adjusted. We have adjusted for seasonality component, used the Harmonized Index for Consumer prices to derive the real house loans and afterwards converted into logarithm values. Figure No.1 depicts the development of the real house loans after the adjustments. There are some authors who used nominal loan and interest values without the adjustment for the inflation because nominal interest rates are the actual rates paid for the actual/nominal value of mortgage. However, absolute majority of the studies prefer to use variables adjusted by the consumer price index because it better reflects the economic reality, real economic development and real prices of assets that serves as a collateral.
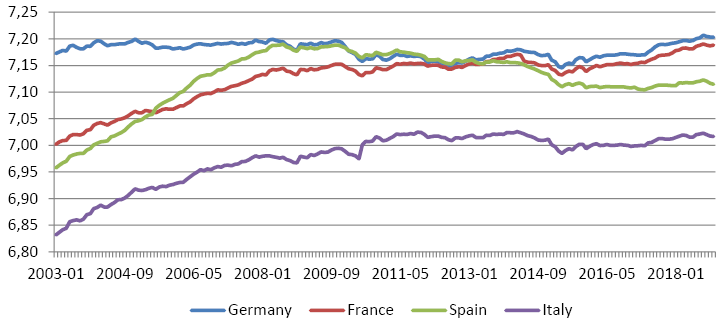
Fig. 1. Log of Real house loans volume in selected countries
Source: Prepared by authors, based on ECB data
• Households cost of borrowing (abbreviation: RR1) is equivalent to interest rates of new house loans. It is a total floating rate or an initial fixed rate to euro area households on euro-denominated loans for house purchase. Rates are in percentages per annum and reflect rates on new business. Again, we have adjusted the cost of borrowing for Harmonized Index for Consumer prices changes for every respective country. We expect a negative relation in the long term equation with the house loans. Although a negative interest rates environment and low variation in real rate might neglect the fundamental principle in demand curve between the credit and interest rates.
• Unemployment (abbreviation: U) – harmonized unemployment rate (as a percentage of total labor force), standardized across countries, all ages, male and female, seasonally adjusted, not working day-adjusted. We expect a negative sign in the long term equation of the real house loan demand.
• House rent price (abbreviation: P) – is a subgroup of the harmonized index of consumer prices (HICP) for housing, including rents and other housing related costs from Eurostat. It measures the average change of prices paid by households for house rents. Housing rent costs increase the demand for acquisition of the real estate and demand for mortgages. Based on the wealth channel for the house prices we expect a positive relation to the real house loan variable in the long term.
• ECB Dummy (abbreviation: dum_ecb1) – interest rates on the EUR deposit facility; it is one of the three interest rates that helps ECB to implement monetary policy. Deposit facility rate reflects the overnight interest rate received (in positive interest rates environment) or paid (in negative interest environment) for the placed deposits within the central bank. We have selected the variable to measure the policy effect for the real house loans. Due to the deposit costs or no return for the euro deposits in a bank, we expect that negative interest rates will encourage households to spend or invest the excess funds.
3.4. Time series tests for stationary
While performing any regression analyses on the macroeconomic time series the key importance is to check for the stationary of the variables. We ran the Augmented Dickey-Fuller test and the Phillips-Perron test, to investigate if unit roots are present in the variables or checking if data are non-stationary. Dickey-Fuller test results are in Table No. 3. The more negative values are the stronger rejection of the null hypothesis of the tests. The results indicate that values in levels of log real house loans, real interest rates, unemployment rate are non-stationary in all of the countries. The first-order differences became stationary - were not increasing over time and, had no trend or drift. The only exception is the log of real house loans in Spain where we rejected the null hypothesis of the test with the 10 pct confidence level and confirmed I(1). Tests confirmed that coefficients of the variables with first differences became consistent and had no unit roots.
Table 3. Results for Augmented Dickey-Fuller (ADF) Unit roots Test
|
Variables |
Null hypothesis |
Alternative hypothesis |
Germany |
France |
Spain |
Italy |
|
RHL |
I (1) |
Stationary |
0.12 |
1.95 |
0.06 |
1.17 |
|
I (2) |
I (1) |
-4.44* |
-3.15* |
-1.89*** |
-2.02** |
|
|
RR1 |
I (1) |
Stationary |
-1.65 |
-1.39 |
-0.92 |
-0.79 |
|
I (2) |
I (1) |
-3.23* |
-2.75* |
-3.27* |
-2.59* |
|
|
U |
I (1) |
Stationary |
-1.80 |
0.05 |
-0.50 |
0.13 |
|
I (2) |
I (1) |
-3.04* |
-3.68* |
-1.91*** |
-2.64** |
|
|
P |
I (1) |
Stationary |
-1.16 |
-0.74 |
-1.04 |
-0.78 |
|
I (2) |
I (1) |
-5.16* |
-5.57* |
-5.02* |
-5.68* |
Note: ADF test with no intercept and no trend with lags = BIC criteria. Critical values for test statistics: 1pct -2.58; 5pct -1.95; 10pct -1.62; Signs *,**, and *** indicate the significance at 1%, 5%, and 10% levels of significance respectively. Source: Authors’ calculations
In addition, we have checked for the structural brakes of the data series with the help of Zivot-Andrews Unit Root Test (1992). Zivot-Andrews test is another unit root test; however, it also measures potential structural breaks in the data. There are studies (Nunes, Newbold and Kuan (1997), Baum (2015)) claiming that Zivot-Andrews test does not count more than one true structural break and in this way may bias the results. Different lag selection may cause a false rejection of the unit root null hypothesis: in Spain unemployment I(1) become stationary only with second lag, other variables with lag 6; in Italy interest rates I(1) become stationary only with second lag. The test results for the data suggest that there are no critical breaks in the time series integrated of order 1 and we can further use it for modeling, except for Germany, where unemployment and house rent prices have significant structural breaks on May 2009 and August 2013. Spain time series data suggests structural breaks in March 2008 for log of real house loans and interest rates in June 2008 (see APPENDIX 3).
3.5. Estimation of vector auto regression (VAR) model
Each equation in the VAR model reflects a liner combination of multiple time series and is a simplified autoregressive distributed lag model. Fundamental vector auto regression (VAR) model:
Yt =A1Yt–1 + A2Yt–2 + . . . + Ap Yt–p + Ut,
Where Yt – vector matrix of variables; p – number of lags in the equation; Ap is a time-invariant (k × k)-matrix of endogenous variable; Ut is a k-vector of error terms satisfying a white noise criteria. The model can also have a constant.
To establish a VAR model the variables needs to be integrated of the same order and be a stationary time series. The first thing is to determine the number of parameters to be included in order not to decrease the degrees of the freedom in the model. Second, determine interval for lags for endogenous variables. In the paper we have selected to determine lag length interval for endogenous variables with BIC lag length selection criteria, when lowest value was selected (see APPENDIX 4). The lag length selection criteria in suggested different lags: For Germany – lag 2; For France – lag 4, for Spain and Italy – lag 3. To support the decision for interval selection the variables were inspected by visual graphs and histograms and correlograms. ACF and PAC diagrams were used to test for cross and auto correlation at every additional lag of each variable. Stationarity of VAR model is tested by inverse roots of autoregressive characteristic polynomial - the mod of reciprocal must be less that modulus of 1. Before we establish a VAR model we need to check for possible long term cointegration between the variables.
3.6. Cointegration testing
If two or more time series are independently integrated of the same order, but their linear combination has a lower order of integration then time series are cointegrated. That means that there exist a linear combinations of non-stationary data that form a stationary time series system. Cointegration means that there is long term equilibrium, but in short term the variables are in disequilibrium. There are 3 types of cointegration tests: Unrestricted cointegration Rank test (Trace); Unrestricted cointegration Rank test (Maximum Eigenvalue); Phillips–Ouliaris cointegration test (1990). Cointegration relationships:
• If the rank of the matrix is zero, than the largest eigenvalue is zero and there is no cointegration;
• if the rank of the matrix is equal or less than zero, than there is at least 1 cointegration relationship.
• If matrix has a full rank, that there is no cointegration and variables in the system are stationary.
Results of Co-integration. For a VAR system of time series the results are the following – we reject the null hypothesis that rank is zero for France, Italy and Spain, however we did not reject for Germany (see TABLE No. 4.). The same test results of the matrix rank were received both by maximum eigenvalue and trace tests. In case of Germany, because the variables are I(1) and there is no cointegration, a VAR model for the first differences is the appropriate. For the rest of the countries VECM model can be established.
Table 4. Johansen test for testing cointegration relationship rank = P
|
Country / Maximum eigenvalue test-statistic |
P = 0 |
P ≤ 1 |
P ≤ 2 |
P ≤ 3 |
Number of cointegration equations |
|
Germany |
42.39** |
15.62 |
6.56 |
1.23 |
None |
|
France |
62.74 |
27.27** |
11.02 |
3.07 |
At least 1 |
|
Spain |
73.65 |
32.66** |
11.88 |
5.24 |
At least 1 |
|
Italy |
67.99 |
34.07** |
17.6 |
7.06 |
At least 1 |
|
95% critical values |
53.12 |
34.91 |
19.96 |
9.24 |
Note: **Denotes the rejection of the null hypothesis of contintegration rank P, at 5% significance level. Source: Authors’ calculations
3.7. Short term imbalances and VECM model
There are two fundamental strategies for establishing a cointegration vectors and analyses. One is the Engle–Granger (1987) method and the other is the Johansen and Juselius (1990) procedure. Engle–Granger method is suitable for the cointegration analyses of single equations between two variables with the second variable preconditioned to be weakly exogenous, while the Johansen procedure can be extended to multiple variables. Moreover, there are certain weaknesses of the Engle–Granger method, like restricting number of cointegrating relationships, no preconditions for variables that are weakly exogenous, because all the variables are treated as strictly exogenous. Therefore, in the paper we prefer using Johansen and Juselius (1990) procedure over the Engle-Granger. Short term error correction features of VECM model makes it different over the basic vector autoregression model VAR. VECM allows to make analyses possible when variables are non stationary in levels unless there is a cointegrating relationships among the system of variables. Pre conditions for the test: variables should be strictly integrated of the same order either I(O) or I(1) and testing for unit roots in different methods is crucial.
In VECM we are looking for a long run stochastic trend between groups of four variables. This relationship is called the cointegrating relationship. The error correction term ECT measures the speed of adjustments of the short term imbalances of the model to the long term relationship between the variables in the system.
Fundamental VECM model:
∆Yt =B1∆Yt–1 + Bp–1∆Yt–p+1+ ΠYt–p + C + Ut
Where Π = αβ': is a matrix of parameters containing long run information;
β – is a matrix of long run relationship.
α – contains the parameters of error correction and measures the speed of the variables adjust to the long run equilibrium.
C – a vector of constants; Ut a vector of error terms;
β'Yt–p – a mean reverting weighted sums of cointegrating vectors and variables data at moment (t – p). This an error correction term (ECT).
3.8. Modeling private credit
Suppose the demand function for the house loans for house purchase purposes has a simple form:
RHL =α+β1RR1 + β2U + β3 P + ε , where
RHL – stands for the logarithm of the real house loans to private sector, RR1 – stands for the real interest rates for the new loans for house purchases, U – stands for the unemployment rate and P stands for the house rent prices measured by housing costs in harmonized consumer price index, α is the constant and ε is the error term.
VECM model for the house loans with one cointegrating relation and 3 lags will have a form of:
∆Yt = C + B1∆Yt–1 + B2∆Yt–2 + ΠYt–3 + Ut
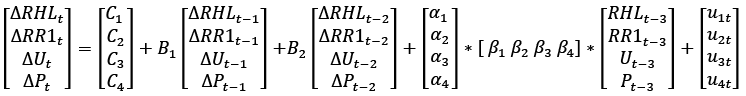
where RHL stands for the logarithm of the real house loans to private sector, RR1 stands for the real interest rates for the new loans for house purchases, U stands for the unemployment rate and P stands for the house rent prices, α is the constant and ε is the error term.
4. Results of the VECM model
4.1. Short Run causality
In France, only cost of borrowing rates had significant effect for log of real house loans in lag 1, lag 2, and lag 3 in the short term equations. In Spain, short term fluctuations at lag 1 were driven by change of log of real house loans itself, change of unemployment and prices of rent, but the effect disappeared in the second lag. Similarly in Italy, the short term fluctuations of log of real house loans at lag 1 were driven by interest rates and in second lag by the change of log of real house loans itself. (see TABLE No. 5). Results indicate that in short term disequilibrium were driven by different variables in all of the countries analyzed, change of log of real house loans and change of interest rates were the most common. We have tried to capture how short term interest rates of ECB deposit facility rate have affected the long term interest rates through the interest rates and wealth channels. In any of the country model, where we have includes ECB deposit facility rate as an exogenous variable, we did not find any short term effects for the log of real house loans.
Table 5. Coefficients of single cointegration equations
|
Coefficients/Estimate |
FRANCE |
SPAIN |
ITALY |
|
ect1 |
-0.0196* (0.004) |
-0.0101* (0.0017) |
-0.0231* (0.0048) |
|
dum_ecb1 |
-0.0008 (0.0007) |
-0.0003 (0.0006) |
-0.0002 (0.0008) |
|
rhl.dl1 |
0.2425** (0.0796) |
||
|
rr1.dl1 |
0.0101*** (0.0051) |
-0.007*** (0.004) |
|
|
u.dl1 |
-0.0037*** (0.0017) |
||
|
p.dl1 |
-0.0004*** (0.0002) |
||
|
rhl.dl2 |
-0.1303*** (0.0777) |
||
|
rr1.dl2 |
-0.0102 (0.0055) |
||
|
rr1.dl3 |
0.0123*** (0.0047) |
||
|
Multiple R-squared: |
0.29 |
0.46 |
0.19 |
|
F-statistic: |
2.641 on 25 and 163 DF |
6.725 on 21 and 168 DF |
1.82 on 21 and 168 DF |
|
p-value: |
0.001 |
0.001 |
0.020 |
Note: Standard errors in (); Signs *,**, and *** indicate the significance at 1%, 5%, and 10% levels of significance respectively; Source: Authors’ calculations
4.2. The error correction term (ECT) values tell the adjustment/speed of parameters for each equation. ECT should be a negative number and if positive value means explosive and not reasonable for modeling. ECT should range between 0 ~ 1 but not more than 2. For all of the countries we have received a negative error correction term. ECT tells the adjustment speed from short term imbalances to reach the long term equilibrium in the model. The parameter of adjustment in monthly data was highest for Italy (-0.023) meaning that in annual terms the adjustment happens in 3.6 years. Similar value of the adjustment coefficient was found for France (–0.020), meaning a 4.2 years adjustment of the log of real house loans to the long term equilibrium. Spain was found to have the lowest value of the coefficient (-0.010), meaning an 8.3 years period of adjustment.
Table 6. Comparison of results of Error correction term (ECT)
|
Country |
Error correction term (ECT) |
How many years? |
|||||
|
Our results (monthly) |
Our results (quarterly) |
Constantinescu and Lastauskas (2018) |
Hofmann (2009) |
Our results |
Constantinescu and Lastauskas (2018) |
Hofmann (2009) |
|
|
Germany |
– |
– |
-0.094 |
-0.034 |
– |
2.7 |
7.4 |
|
France |
-0.020* |
-0.059 |
-0.530 |
-0.530 |
4.2 |
0.5 |
0.5 |
|
Spain |
-0.010* |
-0.030 |
-0.042 |
-0.049 |
8.3 |
6.0 |
5.1 |
|
Italy |
-0.023* |
-0.031 |
-0.074 |
-0.079 |
3.6 |
3.4 |
3.2 |
Note: Signs * indicate the significance at 1% level
Adjustment coefficient values and significance for house loans varies dependent on the time interval, data frequency and selected endogenous variables, also there are more differences between the countries than similarities. We did not find another study that had exactly the same variables and time frame; however there are few studies for the credit and house prices where results are comparable. For example, Constantinescu and Lastauskas (2018) found that Germany error correction term was (-0.094); France (-.053); Italy (-0.042); Spain ( -0.074); While for other industrialized countries they found that credit speed of adjustment ranges from 2.5 years to 9 years worldwide. Hofmann (2009) found similar to Constantinescu and Lastauskas (2018) research results that are summarized in TABLE No. 6. To conclude we have found similar correction speed parameters in Italy (~ 3 years), 1.5 times larger in Spain (~8 years) and 8 times longer for France ~ 4 years. Correction period until the estimated equilibrium was found in rather long term, thus impulse response functions were not generated to represent the short term imbalances.
4.3. Long run causality
As for all the countries we have found significant and negative error correction terms we can establish the long term cointegration equations in three out of four countries. Below we have established cointegration equations. The long term equations are country-specific and do not impose a common structure for all country. We can notice similarity in sign of unemployment in all three countries long term equations (2-4). Negative coefficient value of unemployment was highest for France. The coefficients of interest rates in Italy had negative values while in France and Spain had positive signs.
Germany log RHL = no cointegration relationship (1)
For Germany we found zero rank cointegration matrix and concluded no cointegration relationship between the variables, thus a VAR model with time series integrated of the first order could be used for further modelling.
France log RHL = 7.551 + 0.029R1 – 0.025U – 0.013P (2)
In France, a 1% change of real interest rates had 2.9% effect on the log of real house loans in the long term equation. A 1% of increase in unemployment will result in 2.5% decrease in log of real house loans volume and a 1% increase in prices will lead to decrease of 1.3% in log of real house loans volume.
Spain log RHL = 7.248 + 0.035R1 – 0.013U + 0.013P (3)
In Spain, an increase of 1% real interest rates will change positively by 3.5% increase the log of real house loans in the long term. A 1% of increase in unemployment will result in 1.3% decrease in log of real house loans volume and a 1% increase in prices will lead to increase of 1.3% in log of real house loans volume.
Italy log RHL = 7.299 – 0.032R1 – 0.017U – 0.005P (4)
In Italy, an increase of 1% real interest rates will change negatively by 3.2% log of real house loans in the long term. A 1% of increase in unemployment will result in 0.17% decrease in log of real house loans volume and a 1% increase in prices will lead to decrease of 0.5% in log of real house loans volume.
4.4. VECM stability tests
We have tested the residuals of every equation in the VECM model for Durbin-Watson test for autocorrelation. The null hypothesis for Durbin-Watson test if residuals after the first lag from an OLS regression are not auto-correlated. The Durbin-Watson statistic values are between 0 to 4. Values less than 2 indicate positive autocorrelation and values higher than 2 indicate a negative autocorrelation. In our case for all the countries the null hypothesis was accepted and all the residuals in the equations had no autocorrelation. Box-Ljung test for autocorrelation gave similar results hinting that model errors are white noise, and the autocorrelations of the residuals are at the acceptable level.
Tabble 7. Durbin-Watson test for residuals stability
|
Countries / Variables |
Italy |
Spain |
France |
|
rhl |
DW = 1.99, p-value = 0.47 |
DW = 1.96, p-value = 0.38 |
DW = 2.01, p-value = 0.53 |
|
rr1 |
DW = 2.04, p-value = 0.59 |
DW = 2.04, p-value = 0.63 |
DW = 1.98, p-value = 0.46 |
|
u |
DW = 2.04, p-value = 0.60 |
DW = 2.01, p-value = 0.55 |
DW = 2.06, p-value = 0.67 |
|
p |
DW = 2.07, p-value = 0.68 |
DW = 1.92, p-value = 0.30 |
DW = 2.02, p-value = 0.56 |
Source: Authors’ calculation
4.5. Granger causality tests
Even though the VECM relationships with cointegrating vectors have been found for France, Spain and Italy equations, further analyses is needed on the direction of the causal effects between the variables. Granger causality does not imply/require cointegration as two or more series can have Granger causality among themselves if they are both integrated of the same order I(0) or I(1) or cointegrated. However, the presence of the cointegration suggests that there must be a Granger causality in at least one direction between the variables. Based on Lütkepohl (2013) the results of the Granger causality can depend on the frequency of the data chosen for the analyses. Granger causality does not reflect the real causality relationship of the variables, but indicate the direction.
4.6. Results of Granger causality for single equations
We have found that none of the first differences of variables (interest rates, unemployment, house rent prices and ECB dummy) in analyses did not have Granger causality towards the log of real house loans in any of the four countries (see APPENDIX 5). However, the opposite Granger causality effect of real house loans towards the variables was found in France with a 10% significance level only and in Spain with a 5% significance level. France real house loans had Granger causality for Interest rates (p=0.09), unemployment (p=0.09) and for exogenous variable ECB deposit facility rate (p=0.08). In Spain real house loans had Granger causality for interest rates (p=0.03) and for exogenous variable ECB deposit facility rate (p=0.009).
We can conclude that only one way Granger causality effects were found and no bi-directional or two-way Granger causality effects were found for any of the country. Interest rates, unemployment and ECB deposit facility rate had the Granger causality with the house loans. Results suggest that house rent prices did not contribute for better forecasts of real house loans in any of the country model. Log of real house loans variable in France and Spain improves the prediction capabilities of the singular equations of interest rates, unemployment and ECB deposit facility rate.
4.7. Results of instantaneous causality for multivariate VAR system
Granger causality and instantaneous causality helps to explain the prediction capabilities of a multivariate VAR system, if adding certain argument can improve the prediction capabilities of the whole system. The Granger causality in multivariate systems rejected the null hypothesis of no Granger causality for unemployment in France (p=0.0005), for real interest rates in Spain (p=0.08) and in Italy (p=0.02), meaning that the named variables contributed for a better forecasting of the combined variables in the VAR models (see APPENDIX 6). Unemployment variable in all VAR system equations did not reject the null hypothesis of the instantaneous causality effect for the variables across all the countries.
5. Conclusions
Vector error correction (VECM) models are widely used in economic literature to model non-stationary, integrated of the same order and cointegrated economic variables. We have found that log of real house loans, real interest rates, unemployment and house rental costs were non-stationary in levels and integrated of the same first order. Also and we have rejected the structural breaks in the time series data of 2003 until 2018.
Empirical results suggests that in France, Spain and Italy there is a long term cointegrating relationship between the real house loans and interest rates, unemployment and house rent costs. On average the equilibrium is reached in 4 to 8 years, meaning that long term equilibrium exists, but the variables reach it in rather long term period. We did not find any cointegration relationship for Germany house loans and selected variables.
High-frequency monthly data did not show any significant co-movements of the variables in the short run. Correction speed to equilibrium house loans was estimated for a long period, thus quarterly and annual data of variables are better choices for the analyses of the variables.
The ECB deposit facility rate included as an exogenous variable in four countries gained no significant power in explaining the short term changes of house loans in any of the country.
Results of short-term equations indicate that log of real house loans in disequilibrium were driven by different factors: most significant for the short- term variation were lagged values of the log of real house loans and change of interest rates.
We found no bi-directional and only one-way Granger causality effects for the countries analyzed. Log of real house loans variable in France and Spain improved the prediction capabilities of the singular equations of interest rates, unemployment, and ECB deposit facility rate. While in opposite direction interest rate for mortgages, unemployment rate and house rent prices did not Granger cause the log of the house loans in any country’s model.
The Granger causality in multivariate VAR systems rejected the null hypothesis of no Granger causality for unemployment in France, in Spain, and in Italy, meaning that unemployment contributed for better forecasting of the combined variables in the VAR models.
Additional research on house loans may cover more euro zone countries and tools for better short term prediction of the demand for house loans and related variables.
References
Acemoglu, D. (2001). Credit market imperfections and persistent unemployment. European Economic Review, 45(4-6), 665-679. https://doi.org/10.1016/s0014-2921(01)00107-6.
Anundsen, A. K., Gerdrup, K., Hansen, F., & Kragh-Sørensen, K. (2016). Bubbles and crises: The role of house prices and credit. Journal of Applied Econometrics, 31(7), 1291-1311. https://doi.org/10.1002/jae.2503.
Arestis, P., & González, A. R. (2014). Modelling the housing market in OECD countries. International Review of Applied Economics, 28(2), 131-153. https://doi.org/10.1080/02692171.2013.828683.
Baum, C. (2015). ZANDREWS: Stata module to calculate Zivot-Andrews unit root test in presence of structural break.
Bethune, Z., Rocheteau, G., & Rupert, P. (2015). Aggregate unemployment and household unsecured debt. Review of Economic Dynamics, 18(1), 77-100. https://doi.org/10.1016/j.red.2014.08.002.
Cecchetti, S. G., & Kharroubi, E. (2015). Why does financial sector growth crowd out real economic growth?.
Constantinescu, M., & Lastauskas, P. (2018). The knotty interplay between credit and housing. The Quarterly Review of Economics and Finance, 70, 241-266. https://doi.org/10.1016/j.qref.2018.05.013.
Davis, E. P., & Zhu, H. (2011). Bank lending and commercial property cycles: some cross-country evidence. Journal of International Money and Finance, 30(1), 1-21. https://doi.org/10.1016/j.jimonfin.2010.06.005.
Davis, M. A., & Heathcote, J. (2005). Housing and the business cycle. International Economic Review, 46(3), 751-784. https://doi.org/10.1111/j.1468-2354.2005.00345.x.
Diks, C., & Wang, J. (2016). Can a stochastic cusp catastrophe model explain housing market crashes?. Journal of Economic Dynamics and Control, 69, 68-88. https://doi.org/10.1016/j.jedc.2016.05.008.
Dromel, N. L., Kolakez, E., & Lehmann, E. (2010). Credit constraints and the persistence of unemployment. Labour Economics, 17(5), 823-834. https://doi.org/10.1016/j.labeco.2010.04.005.
Egert, B., & Mihaljek, D. (2007). Determinants of house prices in central and eastern Europe. Comparative economic studies, 49(3), 367-388. https://doi.org/10.1057/palgrave.ces.8100221.
Greenwald, B. C., & Stiglitz, J. E. (1986). Externalities in economies with imperfect information and incomplete markets. The quarterly journal of economics, 101(2), 229-264. https://doi.org/10.2307/1891114.
Greenwald, B. C., & Stiglitz, J. E. (1986). Imperfect information, credit markets and unemployment (No. 2093). National Bureau of Economic Research.
Hofmann, B . 2001: The determinants of private sector credit in industrialised countries: do property prices matter? BIS Working Paper No. 108.
Jacobsen, D. H., & Naug, B. E. (2005). What drives house prices?.
Lütkepohl, H. (2013). Introduction to multiple time series analysis. Springer Science & Business Media.
Mian, A., Sufi, A., Verner, E. (2016) Household Debt and Business Cycles Worldwide Kreisman Working Paper Series in Housing Law and Policy
Nunes, L. C., Newbold, P., & Kuan, C. M. (1997). Testing for unit roots with breaks: evidence on the great crash and the unit root hypothesis reconsidered. Oxford Bulletin of Economics and Statistics, 59(4), 435-448. https://doi.org/10.1111/1468-0084.00076.
Panagiotidis, T., & Printzis, P. (2016). On the macroeconomic determinants of the housing market in Greece: A VECM approach. International Economics and Economic Policy, 13(3), 387-409. https://doi.org/10.1007/s10368-016-0345-3.
Pesaran, M. H., & Shin, Y. (1998). An autoregressive distributed-lag modelling approach to cointegration analysis. Econometric Society Monographs, 31, 371-413.
Petrosky-Nadeau, N. (2014). Credit, vacancies and unemployment fluctuations. Review of Economic Dynamics, 17(2), 191-205. https://doi.org/10.1016/j.red.2013.10.001.
Shiller, R. J. (2015). Irrational exuberance: Revised and expanded third edition. Princeton university press.
Appendix 1. Germany, France, Spain and Italy dynamics of key model’s variables over time, %
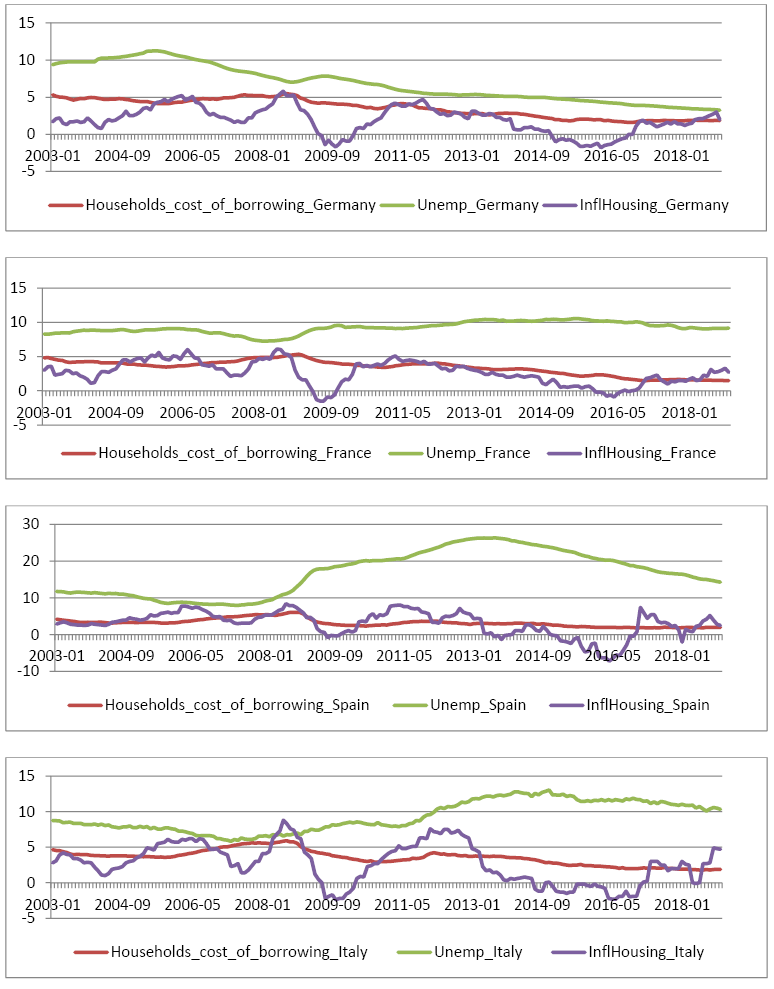
Source: European Central Bank (ECB)
Appendix 2. Descriptive statistics of nominal house loans, in billion euro
|
House loans |
Germany |
France |
Spain |
Italy |
|
Mean |
1010 |
726 |
544 |
299 |
|
Median |
973 |
776 |
575 |
353 |
|
Standard Deviation |
79 |
195 |
122 |
78 |
|
Range |
318 |
695 |
426 |
247 |
|
Minimum |
913 |
351 |
239 |
132 |
|
Maximum |
1231 |
1046 |
665 |
380 |
|
Count |
192 |
192 |
192 |
192 |
Source: Prepared by authors, based on European Central Bank (ECB) data
Appendix 3. Zivot-Andrews Unit Root Test (1992) with a single structural break
|
Country |
Germany |
France |
Spain |
Italy |
||||||
|
Variables |
Null hypothesis |
Alternative hypothesis |
t-stat |
PSB |
t-stat |
PSB |
t-stat |
PSB |
t-stat |
PSB |
|
RHL |
I (1) |
Stationary |
-3.06 |
2009/9 |
-3.25 |
2006/1 |
-3.91 |
2005/4 |
-3.39 |
2010/4 |
|
I (2) |
I (1) |
-5.32 |
2008/3 |
-5.10 |
2016/9 |
-4.32 |
2008/3 |
-5.22 |
2014/3 |
|
|
RR1 |
I (1) |
Stationary |
-3.42 |
2011/4 |
-4.16 |
2007/1 |
-4.78 |
2005/9 |
-3.90 |
2008/7 |
|
I (2) |
I (1) |
-5.55 |
2008/5 |
-5.82 |
2008/9 |
-4.75 |
2008/6 |
-6.00 |
2008/5 |
|
|
U |
I (1) |
Stationary |
-5.36 |
2009/5 |
-3.25 |
2010/1 |
-2.97 |
2008/3 |
-3.38 |
2011/7 |
|
I (2) |
I (1) |
-6.24 |
2005/3 |
-5.24 |
2008/1 |
-5.12 |
2007/3 |
-5.22 |
2011/4 |
|
|
P |
I (1) |
Stationary |
-3.39 |
2013/8 |
-3.17 |
2010/8 |
-3.10 |
2012/8 |
-2.54 |
2014/3 |
|
I (2) |
I (1) |
-5.68 |
2016/1 |
-6.05 |
2006/3 |
-5.99 |
2016/3 |
-6.63 |
2012/8 |
|
Note: PSB (Potential break point at position); Lag=12; Intercept only; Critical values for test statistics: 1 pct -5.34; 5 pct -5.08, and 10pct = -4.82; Source: Authors’ calculations
Appendix 4. Lag selection criteria for VAR systems for different countries
|
Country / Lag |
1 |
2 |
3 |
4 |
5 |
6 |
7 |
8 |
9 |
10 |
11 |
12 |
|
Germany |
||||||||||||
|
AIC |
-23.7 |
-25.2 |
-25.2 |
-25.2 |
-25.2 |
-25.1 |
-25 |
-25 |
-25 |
-25 |
-24.9 |
-24.9 |
|
HQ |
-23.2 |
-24.7 |
-24.5 |
-24.4 |
-24.2 |
-24.1 |
-23.9 |
-23.7 |
-23.6 |
-23.5 |
-23.3 |
-23.1 |
|
BIC |
-22.6 |
-23.8 |
-23.5 |
-23.2 |
-22.9 |
-22.5 |
-22.2 |
-21.9 |
-21.6 |
-21.3 |
-20.9 |
-20.6 |
|
France |
||||||||||||
|
AIC |
-24 |
-24.9 |
-24.8 |
-24.9 |
-24.9 |
-24.9 |
-24.9 |
-24.7 |
-24.7 |
-24.7 |
-24.6 |
-24.6 |
|
HQ |
-23.5 |
-24.3 |
-24.1 |
-24.1 |
-24 |
-23.9 |
-23.7 |
-23.5 |
-23.3 |
-23.2 |
-23 |
-22.9 |
|
BIC |
-22.9 |
-23.5 |
-23.1 |
-22.9 |
-22.7 |
-22.4 |
-22 |
-21.6 |
-21.3 |
-21 |
-20.7 |
-20.4 |
|
Spain |
||||||||||||
|
AIC |
-19.2 |
-20.6 |
-20.5 |
-20.6 |
-20.5 |
-20.5 |
-20.4 |
-20.4 |
-20.3 |
-20.2 |
-20.1 |
-20.1 |
|
HQ |
-18.7 |
-19.8 |
-20 |
-19.8 |
-19.6 |
-19.4 |
-19.2 |
-19.1 |
-19 |
-18.7 |
-18.5 |
-18.4 |
|
BIC |
-18 |
-18.8 |
-19.1 |
-18.6 |
-18.2 |
-17.9 |
-17.6 |
-17.3 |
-16.9 |
-16.5 |
-16.2 |
-15.8 |
|
Italy |
||||||||||||
|
AIC |
-19.8 |
-20.3 |
-20.3 |
-20.3 |
-20.3 |
-20.3 |
-20.2 |
-20.1 |
-20 |
-19.9 |
-19.8 |
-19.8 |
|
HQ |
-19.4 |
-19.6 |
-19.6 |
-19.5 |
-19.4 |
-19.2 |
-19 |
-18.8 |
-18.6 |
-18.4 |
-18.2 |
-18.1 |
|
BIC |
-18.7 |
-18.7 |
-18.8 |
-18.3 |
-18 |
-17.7 |
-17.3 |
-17 |
-16.6 |
-16.2 |
-15.8 |
-15.5 |
Note: Bold font denotes the lowest value of lag selection criteria. Akaike’s Information Criterion (AIC). Hannan-Quinn Criterion (HQ); Schwarz Criterion (SC)/ BIC; Source: Authors’ calculations
Appendix 5. Singular Granger causality tests
|
Variables |
F-test |
Variables |
F-test |
One way |
|
Germany |
||||
|
∆rhl~∆rr1 |
1.0625 {0.3956} |
∆rr1~∆rhl |
1.2450 {0.2574} |
No |
|
∆rhl~∆u |
0.6463 {0.7999} |
∆u~ ∆rhl |
1.3848 {0.1785} |
No |
|
∆rhl~∆p |
1.1186 {0.3489} |
∆p~ ∆rhl |
0.7748 {0.6756} |
No |
|
∆rhl~∆r_ecb |
0.4848 {0.9213} |
∆r_ecb~∆rhl |
1.0664 {0.3922} |
No |
|
France |
||||
|
∆rhl~∆rr1 |
1.4515 {0.1484} |
∆rr1~∆rhl |
1.6261 ***{0.08945} |
Yes |
|
∆rhl~∆u |
0.9319 {0.5168} |
∆u~ ∆rhl |
1.6358 ***{0.08688} |
Yes |
|
∆rhl~∆p |
0.6331 {0.8116} |
∆p~ ∆rhl |
0.8557 {0.5932} |
No |
|
∆rhl~∆r_ecb |
0.2333 {0.9964} |
∆r_ecb~∆rhl |
1.6675 ***{0.07896} |
Yes |
|
Spain |
||||
|
∆rhl~∆rr1 |
1.2941 {0.2270} |
∆rr1~∆rhl |
1.9712 ** {0.03028} |
Yes |
|
∆rhl~∆u |
1.3378 {0.2025} |
∆u~ ∆rhl |
1.2651 {0.2445} |
No |
|
∆rhl~∆p |
1.1699 {0.3093} |
∆p~ ∆rhl |
1.0179 {0.4352} |
No |
|
∆rhl~∆r_ecb |
0.4889 {0.919} |
∆r_ecb~∆rhl |
2.3260* {0.0092} |
Yes |
|
Italy |
||||
|
∆rhl~∆rr1 |
0.5147 {0.903} |
∆rr1~∆rhl |
0.7769 {0.6735} |
No |
|
∆rhl~∆u |
1.0533 {0.4035} |
∆u~ ∆rhl |
0.9733 {0.4768} |
No |
|
∆rhl~∆p |
0.7108 {0.7394} |
∆p~ ∆rhl |
1.2465 {0.2564} |
No |
|
∆rhl~∆r_ecb |
0.3996 {0.9621} |
∆r_ecb~∆rhl |
0.9416 {0.5073} |
No |
Note: Signs *,**, and *** indicate the significance at 1%, 5%, and 10% levels respectively; p-values are reported in {}; ∆ denotes first difference of the variables; Source: Authors’ calculations
Appendix 6. Multivariate Granger causality test for VAR system
|
H0: selected variable does not Granger-cause variables in brackets |
F-Test |
p-value |
H0: No instantaneous causality between variables |
Chi-squared |
p-value |
|
Germany |
|||||
|
∆rhl ~ ∆ (rr1, u, p) |
1.1081 |
0.3095 |
∆rhl and ∆(rr1, u, p) |
31.613* |
0.0001 |
|
∆rr1 ~ ∆ (rhl, u, p) |
1.0529 |
0.3884 |
∆rr1 and ∆(rhl, u, p) |
35.384* |
0.0000 |
|
∆u ~ ∆ (rhl, rr1, p) |
1.0281 |
0.4268 |
∆u and ∆(rhl, rr1, p) |
4.098 |
0.2511 |
|
∆p ~ ∆ (rhl, rr1, u) |
1.0342 |
0.4172 |
∆p and ∆(rhl, rr1, u) |
8.765** |
0.0326 |
|
France |
|||||
|
∆rhl ~ ∆ (rr1, u, p) |
0.1385 |
0.2703 |
∆rhl and ∆(rr1, u, p) |
35.738* |
0.0000 |
|
∆rr1 ~ ∆ (rhl, u, p) |
1.2074 |
0.1938 |
∆rr1 and ∆(rhl, u, p) |
34.864* |
0.0000 |
|
∆u ~ ∆ (rhl, rr1, p) |
5.9699* |
0.0005 |
∆u and ∆(rhl, rr1, p) |
7.7631 |
0.0512 |
|
∆p ~ ∆ (rhl, rr1, u) |
1.0827 |
0.3556 |
∆p and ∆(rhl, rr1, u) |
10.27 ** |
0.0164 |
|
Spain |
|||||
|
∆rhl ~ ∆ (rr1, u, p) |
1.1019 |
0.3179 |
∆rhl and ∆(rr1, u, p) |
10.697** |
0.0135 |
|
∆rr1 ~ ∆ (rhl, u, p) |
1.3652*** |
0.0800 |
∆rr1 and ∆(rhl, u, p) |
7.1998*** |
0.0658 |
|
∆u ~ ∆ (rhl, rr1, p) |
1.2391 |
0.1644 |
∆u and ∆(rhl, rr1, p) |
4.899 |
0.1793 |
|
∆p ~ ∆ (rhl, rr1, u) |
1.0046 |
0.4643 |
∆p and ∆(rhl, rr1, u) |
11.073** |
0.0113 |
|
Italy |
|||||
|
∆rhl ~ ∆ (rr1, u, p) |
0.8407 |
0.7331 |
∆rhl and ∆(rr1, u, p) |
5.9961 |
0.1118 |
|
∆rr1 ~ ∆ (rhl, u, p) |
0.7063 |
0.9004 |
∆rr1 and ∆(rhl, u, p) |
9.9973** |
0.0185 |
|
∆u ~ ∆ (rhl, rr1, p) |
1.5586** |
0.0222 |
∆u and ∆(rhl, rr1, p) |
3.7272 |
0.2925 |
|
∆p ~ ∆ (rhl, rr1, u) |
1.0643 |
0.3714 |
∆p and ∆(rhl, rr1, u) |
7.1489*** |
0.0673 |