Ekonomika ISSN 1392-1258 eISSN 2424-6166
2022, vol. 101(1), pp. 142–161 DOI: https://doi.org/10.15388/Ekon.2022.101.1.8
Foreign Exchange Volatility and the Bubble Formation in Financial Markets: Evidence From The COVID-19 Pandemic
Onur Özdemi̇r
Istanbul Gelisim University, Department of International Trade and Finance (English)
E-mail: onozdemir@gelisim.edu.tr
ORCID ID: 0000-0002-3804-0062
Abstract. This paper applies recursive right-tailed unit root tests to detect bubble activity for Turkish Lira against financially most-traded five currencies (i.e., the US Dollar (USD/TRY), the British pound (GBP/TRY), the Euro (EUR/TRY), the Chinese Yuan (CNY/TRY) and the Russian Ruble (RUB/TRY)) over January 2, 2015 to February 12, 2021. It can be identified from the Supremum Augmented Dickey–Fuller (SADF) and the Generalized Supremum Augmented Dickey-Fuller (GSADF) tests statistics that there is a high degree of evidence of bubble activity which characterizes all five exchange rates both in the full-sample period and in the sub-periods, including the pre-COVID-19 era (January 2, 2015 to November 15, 2019) and the COVID-19 era (November 18, 2019 to February 12, 2021). The empirical results also indicate that positive bubbles are common for each selected exchange rate and the multiple bubbles were intensified during the COVID-19 period, referring that forex markets became relatively more inefficient compared to the pre-COVID-19 period.
Keywords: Exchange Rate, Bubble Formation, Forex Market, COVID-19, Right-Tailed Unit Root Test
___________
Received: 20/02/2021. Revised: 03/07/2021. Accepted: 04/03/2022
Copyright © 2022 Onur Özdemir. Published by Vilnius University Press
This is an Open Access article distributed under the terms of the Creative Commons Attribution License, which permits unrestricted use, distribution, and reproduction in any medium, provided the original author and source are credited.
1. Introduction
The volatility and the bubble type behavior in the financial markets, and particularly in the asset prices, caused a critical interest over the recent years. The latest studies have largely mentioned the importance of the explosiveness of bubbles to detect the financial market instability (Phillips et al., 2011; Bettendorf and Chen, 2013; Phillips et al., 2015; Hu and Oxley, 2017; Phillips and Shi, 2018, 2020). The crisis-led potential of bubbles is rooted at the center of the debate in the current literature in which the unexpected downturns in the socio-economic framework strengthen the bubble behavior. Indeed, any bubble practice in prices leads investors to assume that the markets are inefficient and thus they mainly have to get away from that problematic market. For instance, the alternative investment theories are stimulated by different perspectives in the context of noisy market hypothesis, adaptive market hypothesis, and fractal market hypothesis to analyze investor behavior throughout a market cycle, including booms and busts, which allow to test of the efficient market hypothesis.
In this regard, one can see that the prices in financial markets can move in fractals, which have been motivated by extreme events or crises. The period that started with the COVID-19 pandemic points to such a process, where the prices have jumped to a high level. One of the major examples can be deduced by looking at the cryptocurrency markets. For instance, the dollar price of Bitcoin has been quadrupled (see CoinDesk or CoinMarketCap) at the COVID-19 outbreak. Also, major stock prices in NASDAQ or Dow Jones have been skyrocketed. However, this issue is not limited to only the financial markets but also core macroeconomic indicators have been deviated from their normal values. Hence, the subject of this paper discusses the problems that may occur due to the extreme volatility of exchange rates. Inspired by the research on pandemic (Sha and Sharma, 2019), we investigate whether there is an explosive bubble in the exchange rates towards time-varying volatility in the COVID-19 pandemic in Turkey. We use recursive right-tailed unit root tests developed by Phillips et al. (2011) and Phillips et al. (2015) (described in Section 3) to detect whether there is bubble type behavior in five exchange rates, namely, the US Dollar (USD/TRY), the British pound (GBP/TRY), the Euro (EUR/TRY), the Chinese Yuan (CNY/TRY) and the Russian Ruble (RUB/TRY) over January 2, 2015 to February 12, 2021. We also split the time dimension into three categories as pre-COVID-19 period (i.e., January 2, 2015 to November 15, 2019), COVID-19 period (i.e., November 18, 2019 to February 12, 2021), and the full-sample period (i.e., January 2, 2015 to February 12, 2021).
As an initial outlook, the findings show that the overall bubble activity has been intensified at the COVID-19 outbreak, even though the explosiveness still appeared before the pandemic. In other words, our main finding is that each period is characterized by explosive behavior. However, the weights of bubble-type behaviors were changed among the selected exchange rates. On the one hand, the full-sample period and the pre-COVID-19 period revealed the fact that the EUR/TRY exchange rate heavily exhibited a strong pattern of an occurring bubble. On the other hand, this condition was changed towards the CNY/TRY exchange rate at the COVID-19 pandemic where the number of days of bubbles and the longest continuous days of bubbles shows that the CNY/TRY exchange rate had been relatively much speculative in the sense of bubble explosiveness. The only exception is the RUB/TRY exchange rate in the COVID-19 period in which the SADF statistics indicated that the bubble activity did not intensify during COVID-19. However, the GSADF statistics for the RUB/TRY exchange rate is still statistically significant, suggesting that RUB/TRY is characterized by explosive behavior.
This is the point that leads us to go further for future studies to investigate other themes of the same topic. However, considering the nature of our research and its limitations along with several constraints such as time dimension and frequency of data, the empirical results also provide some crucial insights to grasp the potential for the occurrence of a bubble burst in the exchange rate markets. First, we use two different kinds of unit root tests to check whether the bubble activity in exchange rate markets exists or not. Second, given the empirical strategies, we utilize both single and multiple bubbles tests, such as supremum Augmented Dickey–Fuller (SADF) and generalized supremum Augmented Dickey–Fuller (GSADF) tests, which are essentially used to detect and date-stamp different bubble types in the financial sector (see Phillips et al., 2011; Phillips et al., 2015). In this regard, by the implementation of those methods, we can also verify the robustness of empirical specifications which consider the case that the two-bubble test can be statistically more reliable if the one-bubble activity is intense in the COVID-19 outbreak and thus the findings can be coherently compared with each other. Third, the theoretical structure of this study is rooted in the fractal market hypothesis, which dictates that financial markets follow a cyclical and repeatable pattern. Therefore, we argue that the existence of greater panics in financial markets implies that exchange rate markets may become inefficient during the COVID-19 pandemic. In that vein, we directly assume that any kind of bubble-type activity in the exchange rate markets may lead to outstanding negative results in the financial sector by transmitting bubble-type activities to different financial market segments.
At a quick glance of the current literature, it can be deduced that the studies are scarce on the nexus between exchange rate and COVID-19, whereas the other topics have been largely investigated in the presence of different indicators such as volatility spillovers, value formation, speculative bubble, herding behavior, lottery-like demand, and forecasts on returns (see Bohte and Rossini, 2019; Bolt and van Oordt, 2019; Derbentsev et al., 2019; Nasir et al., 2019; Al-Awadhi et al., 2020; Cohen, 2020; Devpura and Narayan, 2020; Gu et al., 2020; Haroon and Rizvi, 2020; Liu et al., 2020; Mudassir et al., 2020; Qin et al., 2020; Salisu et al., 2020; Zaremba et al., 2020; Zhang et al., 2020; Grobys and Junttila, 2021). However, as mentioned above, we encounter a few studies which examine the bubble-led dynamics of exchange rates in parallel to an ongoing downturn movement in productive activities. For instance, Narayan et al. (2020) show that the Yen predicted the stock market returns in Japan more strongly at the COVID-19 outbreak, implying that the information band of the Yen was much flexible during the pandemic. Therefore, the authors argue that greater bubble activity in exchange rates can be estimated as a source of information during the COVID-19 period. Narayan (2020) also investigates the bubble type behavior of four exchange rate data (i.e., Japanese Yen, Canadian dollar, European Euro, and the British pound) during the COVID-19 pandemic. The empirical findings imply that bubble activity intensified in parallel to an increasing inefficiency in financial markets at the COVID-19 outbreak, compared to the pre-COVID-19 period. Besides, Iyke (2020) indicates that the exchange rates can be readily predicted during the COVID-19 pandemic in which two phenomena have a direct linkage and high correlation between each other. Meanwhile, Devpura (2021) investigates the relationship between the EUR/USD exchange rate and oil futures price using intra-day data and finds that the COVID-19 pandemic had some effect on the exchange rate during March 2020 while the evidence of oil price effect on EUR/USD exchange rate was limited.
The current paper provides some initial findings that are statistically reliable and consistent with those on exchange rate bubbles, which are produced for Turkish Lira (TRY) against the United States dollar (USD), the European Euro (EUR), the British pound (GBP), the Chinese Yuan (CNY), and the Russian Ruble (RUB). In this regard, whereas Bettendorf and Chen (2013) find explosive behavior in the GBP exacerbated by relative prices of traded goods, Hu and Oxley (2017) explore that a large number of currencies exhibit a mixed structure for the occurrence of bubbles. The unique difference of this study from the others depends on three aspects: first, we use high-frequency data (i.e., 5-day weeks daily); second, we use multiscale methods to detect bubble-type behavior in exchange rates; and third, we compare the changing dynamics of exchange rates by looking at pre-COVID-19 and COVID-19 periods. The remainder of the paper is structured as follows: Section 2 describes the data, section 3 discusses the theoretical background, section 4 summarizes the empirical findings, and section 5 concludes with some remarks.
2. Data Description
The dataset of this study is sampled daily (i.e., 5-day weeks) and covers the closing rate of USD/TRY (EUSD/TRY), EUR/TRY (EEUR/TRY), GBR/TRY (EGBR/TRY), CNY/TRY (ECNY/TRY), and RUB/TRY (ERUB/TRY) during the period from January 2, 2015 to February 12, 2021 as extracted from Statistical Data (EVDS) of Central Bank of the Republic of Turkey. In that vein, the data is obtained for all available days and corresponds to a total of T = 1539. In essence, the selected exchange rates are estimated in their natural forms. Table 1 reports the core summary statistics for the closing rate of exchanges. Also, the pre-COVID-19 period covers dates between January 2, 2015 and November 15, 2019 and the COVID-19 period covers dates between November 18, 2019 and February 12, 2021. While the TRY depreciated against selected five currencies, the fundamental change can be seen in EUR/TRY where the TRY depreciated 73.84% relative to EUR. However, the other values are also close to that percentage. For instance, TRY depreciated 73.08% relative to USD, 71.02% relative to CNY, 68.99% relative to GBP, and 68.01% relative to RUB over the sample period. All the exchange rate series are positively but moderately skewed throughout time. Besides, the kurtosis values of exchange rates are lower than 3, indicating that they are platykurtic and the dataset has lighter tails than a normal distribution (i.e., less in the tails). In other words, the distribution produces fewer extreme outliers. As expected, the Jarque–Bera normality tests for each series are rejected against the null hypothesis for the Gaussian distribution at a significance level of 1%.
Table 1. Descriptive Statistics
|
Minimum |
Maximum |
Mean |
Median |
Skewness |
Kurtosis |
Jarque–Bera |
|
|
USD/TRY |
2.2778 |
8.4613 |
4.5322 |
3.8223 |
0.5052 |
1.9740 |
132.97 |
|
EUR/TRY |
2.6234 |
10.027 |
5.1556 |
4.6547 |
0.5872 |
2.2658 |
123.01 |
|
GBP/TRY |
3.4412 |
11.097 |
5.9980 |
5.2473 |
0.6756 |
2.3022 |
148.29 |
|
CNY/TRY |
0.3654 |
1.2713 |
0.6701 |
0.5905 |
0.6279 |
2.2962 |
132.92 |
|
RUB/TRY |
0.0343 |
0.1087 |
0.0691 |
0.0657 |
0.0519 |
1.6143 |
123.82 |
Meanwhile, Figure 1 depicts that the fluctuations of exchange rates in given samples introduce the possibility of bubble-type activities. Each graph shows that the exchange rate series are not stationary and have a trend effect. Also, as anticipated, the null hypothesis of nonstationarity is rejected for the augmented Dickey–Fuller (ADF) test, meaning that the series have order one I(1) process. The unit-root test results are presented in Table 2 in detail.
Table 2. Unit-Root Test Results
|
Level |
1st difference |
||||||||
|
ADF test |
Critical values |
ADF test |
Critical values |
||||||
|
1% |
5% |
10% |
1% |
5% |
10% |
||||
|
USD/TRY |
-1.402 |
-3.967 |
-3.414 |
-3.129 |
USD/TRY |
-5.215*** |
-3.967 |
-3.414 |
-3.129 |
|
EUR/TRY |
-1.670 |
-3.969 |
-3.416 |
-3.130 |
EUR/TRY |
-4.041*** |
-3.969 |
-3.416 |
-3.130 |
|
GBP/TRY |
-3.116 |
-3.965 |
-3.413 |
-3.129 |
GBP/TRY |
-12.53*** |
-3.965 |
-3.413 |
-3.129 |
|
CNY/TRY |
-2.936 |
-3.966 |
-3.413 |
-3.128 |
CNY/TRY |
-12.03*** |
-3.966 |
-3.413 |
-3.128 |
|
RUB/TRY |
-2.698 |
-3.965 |
-3.413 |
-3.128 |
RUB/TRY |
-12.93*** |
-3.965 |
-3.413 |
-3.128 |
Note: *** denotes the significance at the 1% level.
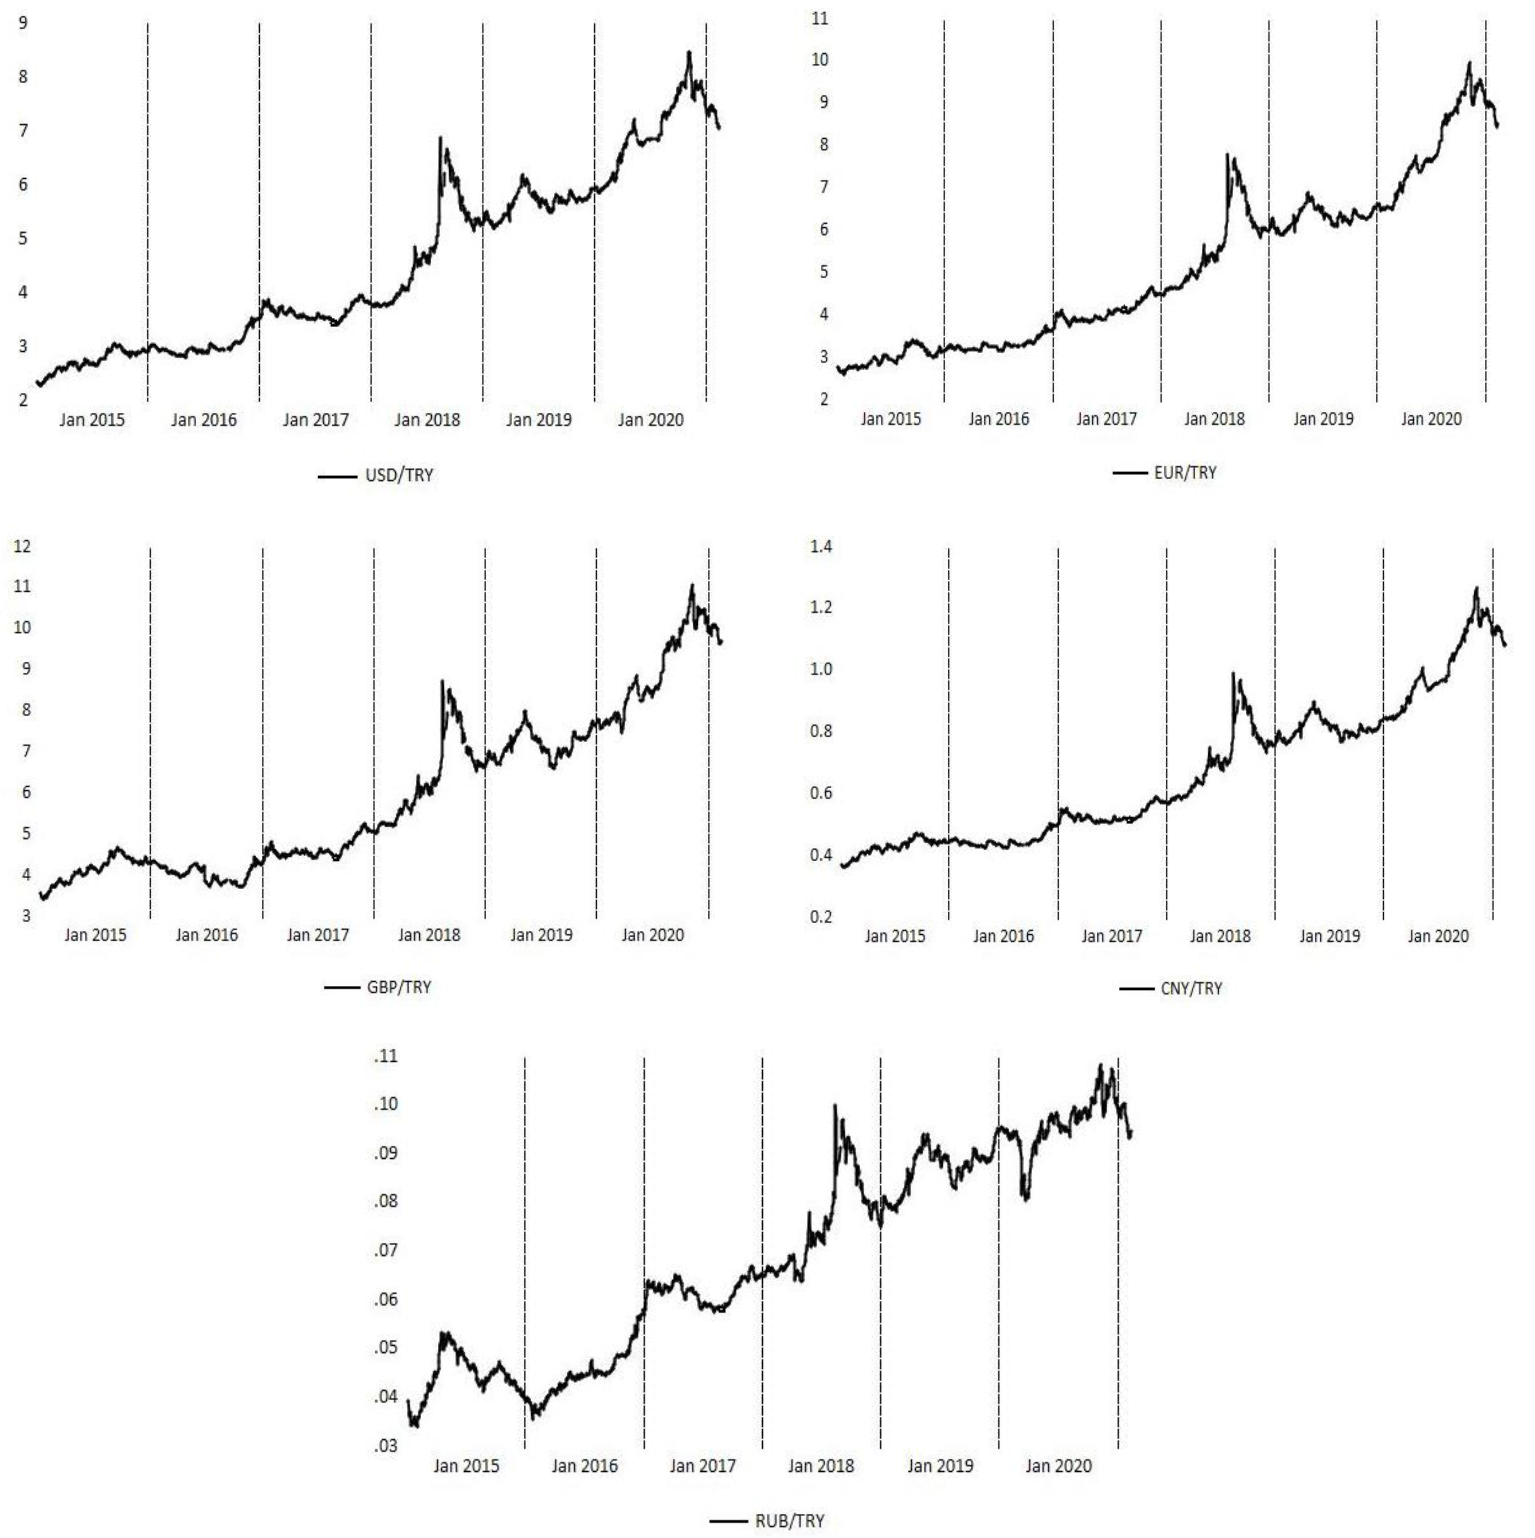
Figure 1. The Time Trend of Exchange Rates
Source: EVDS, Author’s Calculation
3. Theoretical Underpinning
The methodological structure, on which the testing procedure is based in the paper, is produced by Phillips et al. (2011; PWY hereafter). This is essentially originated as the right-tailed version of the traditional ADF test with parameter δ. The presence of unit root of explosiveness in series is tested by the hypotheses H0: δ=1 and Ha: δ≠1. The rejection of null hypothesis (H0) against its alternative (Ha) implies that the series have explosive root. In this regard, if the H0 is rejected against the Ha, this refers that the presence of bubbles is statistically prevailing.
In theory, the PWY procedure has two types of statistics: (i) a supremum ADF (SADF) and (ii) a generalized supremum ADF (GSADF). The methodological structure of those statistics can be represented by Equations (1) and (2), respectively, as follows:
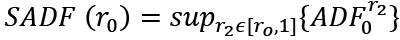 (1)
(1)
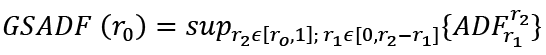 (2)
(2)
where r1, r2 ∈ [0,1] are the series of sub-samples. In comparison between the SADF and the GSADF tests, the latter provides more efficient and robust statistics due to the reason that the window widths are more flexible to select and thereby include more fractions of the overall sample.
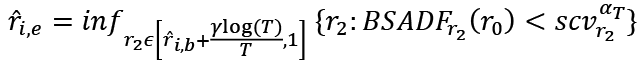
In particular, the SADF test is restricted to one bubble period. However, the explosive root can be detected by the extension through the use of multiple bubble periods. This further strategy is produced by Phillips et al. (2015; PSY hereafter), which is grounded on a backward supremum ADF (BSADF) test and represents the double recursive method. Equation (3) shows the BSADF test:
 (3)
(3)
One of the core features of the BSADF testing procedure is the combination of the SADF and the GSADF statistics. This new method divides the series into two different periods in which the bubble-type activities start at  and end in
  , which are given in Equations (4) and (5), respectively, as follows:
 (4)
(4)
 (5)
(5)
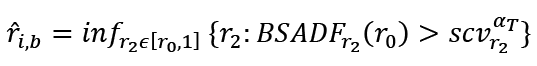
The recursive rolling window method was also further developed by Phillips and Shi (2018, 2020) to detect the existence of multiple bubbles. The range of an interval for each observation in the sample covers the interval between r0 and 1 to test the PSY method, where  . Regarding the H0 of ρ=0, Equation (6) represents the estimation from the following regression analysis:
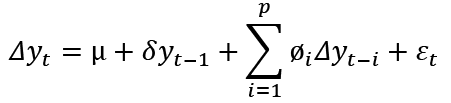 (6)
(6)
One of the core advantages of the use of the regression analysis based on Equation (6) is the determination of multiple bubbles by way of the evaluation of two dates called as the exuberance date and the collapse date. While the exuberance date shows that the first episode comes across to an end if the PSY test statistics is initially higher than its critical value, the collapse date refers to the end of the second episode where the supremum test statistic drops below its essential value. Considering that the whole sample episode is unitary along with the occurrence of re and rf, the newly developed testing procedure of Phillips and Shi (2018, 2020) can be conducted for the determination of estimated periods and termination dates as follows:
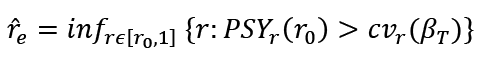 (7)
(7)
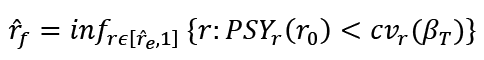 (8)
(8)
where  denotes the distribution quantile of the
  . In this regard, the next section summarizes the empirical findings based on SADF and GSADF testing procedures.
4. Empirical Findings
Tables 3–7 report the values of SADF and GSADF test statistics for the USD/TRY, EUR/TRY, GBP/TRY, CNY/TRY, and RUB/TRY daily (i.e., 5-day weeks) exchange rates with 90%, 95%, and 99% critical values, respectively, obtained by the Monte Carlo simulation with 2000 replications, using the RStudio software. The empirical findings are based on three sub-categories as pre-COVID-19 period (i.e., January 2, 2015 to November 15, 2019), COVID-19 period (i.e., November 18, 2019 to February 12, 2021), and the full-sample period (i.e., January 2, 2015 to February 12, 2021). Following Phillips et al. (2015), first, the corresponding initial window width for the full-sample period is measured as 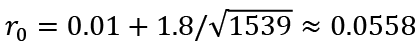 in Panel A, which yields 0.0558*1539 ≈ 87. Second, the corresponding initial window width for the pre-COVID-19 period is measured as
  in Panel B, which yields 0.0604*1271 ≈ 76. Third, the corresponding initial window width for the COVID-19 period is measured as
 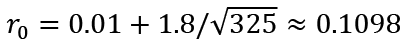 in Panel C, which yields 0.1098*325 ≈ 35. The right-tailed unit-root test statistics indicate that the null hypothesis of no bubble-activities is rejected at the 1% significance level for each series (except for the SADF test of RUB/TRY) in terms of SADF and GSADF methods. This implicitly means that the series have at least one explosive unit root. Therefore, bubble-type behavior in at least one sub-period of the exchange rate series can be indicated for three periods.
First, the results for the USD/TRY exchange rate are summarized in Table 3. We refer to Panel A where full-sample evidence is represented. Over the full-sample period of data, the null hypothesis of a unit-root is rejected for the SADF test and GSADF test, suggesting that the USD/TRY exchange rate is characterized by explosive behavior. In consideration of full-sample period results, the explosiveness of the USD/TRY exchange rate can also be tested through the division in two sub-periods, namely the pre-COVID-19 (i.e., in Panel B) and COVID-19 samples (i.e., in Panel C). On the one hand, it is found that in the pre-COVID-19 period, the USD/TRY exchange rate still displays evidence of bubble-type behavior. That is, the null hypothesis of a unit root is rejected at the 1% significance level. On the other hand, the same evidence also holds for the COVID-19 period, i.e. the null hypothesis is rejected at the 1% significance level in favor of explosiveness for USD/TRY exchange rate, implying that the series expose an evidence of bubble-type behavior.
Table 3. Bubbles Tests Results (USD/TRY)
|
Panel A: Full-sample period (02/01/2015 to 12/02/2021), T=1596, |
||||||
|
SADF test |
GSADF test |
|||||
|
No. of days of bubbles |
Longest continuous days of bubbles |
SADF test |
No. of days of bubbles |
Longest continuous days of bubbles |
GSADF test |
|
|
USD/TRY |
381 |
125 |
5.95*** |
161 |
40 |
7.15*** |
|
Critical Values: |
Critical Values: |
|||||
|
Panel B: Pre-COVID-19 period (02/01/2015 to 15/11/2019), T=1271, |
||||||
|
SADF test |
GSADF test |
|||||
|
No. of days of bubbles |
Longest continuous days of bubbles |
SADF test |
No. of days of bubbles |
Longest continuous days of bubbles |
GSADF test |
|
|
USD/TRY |
181 |
125 |
5.97*** |
101 |
33 |
7.13*** |
|
Critical Values: |
Critical Values: |
|||||
|
Panel C: COVID-19 period (18/11/2019 to 12/02/2021), T=325, |
||||||
|
SADF test |
GSADF test |
|||||
|
No. of days of bubbles |
Longest continuous days of bubbles |
SADF test |
No. of days of bubbles |
Longest continuous days of bubbles |
GSADF test |
|
|
USD/TRY |
113 |
48 |
2.49*** |
64 |
14 |
5.51*** |
|
Critical Values: |
Critical Values: |
|||||
Note: The critical values for SADF and GSADF test methods are provided by 2000 replications of the Monte Carlo simulation. The lag length is selected through the Akaike Information Criterion (AIC). The constant and trend are included in the test equation. *** means that the test statistics are significant at %99 confidence level. The results are obtained by the RStudio and the “exuber” package.
The next issue is to detect the intensity of explosiveness for the USD/TRY exchange rate, which is represented in Figure 2. It estimates the number of days of bubbles for each period. While the pre-COVID-19 period indicates that there were 181 days in which bubble activity was determined, the COVID-19 period shows that the bubble-type behavior is characterized through 113 days. Although the number of days is reduced in the COVID-19 era, the latter period has a great effect in terms of the bubble activity and the sample size. In other words, the explosiveness of bubble formation emerged in one-third of the total sample from November 18, 2019 to February 12, 2021. Furthermore, the number of continuous days of bubble activity has been relatively high in which the SADF test statistics provide more longest period bubbles than the GSADF test statistics.
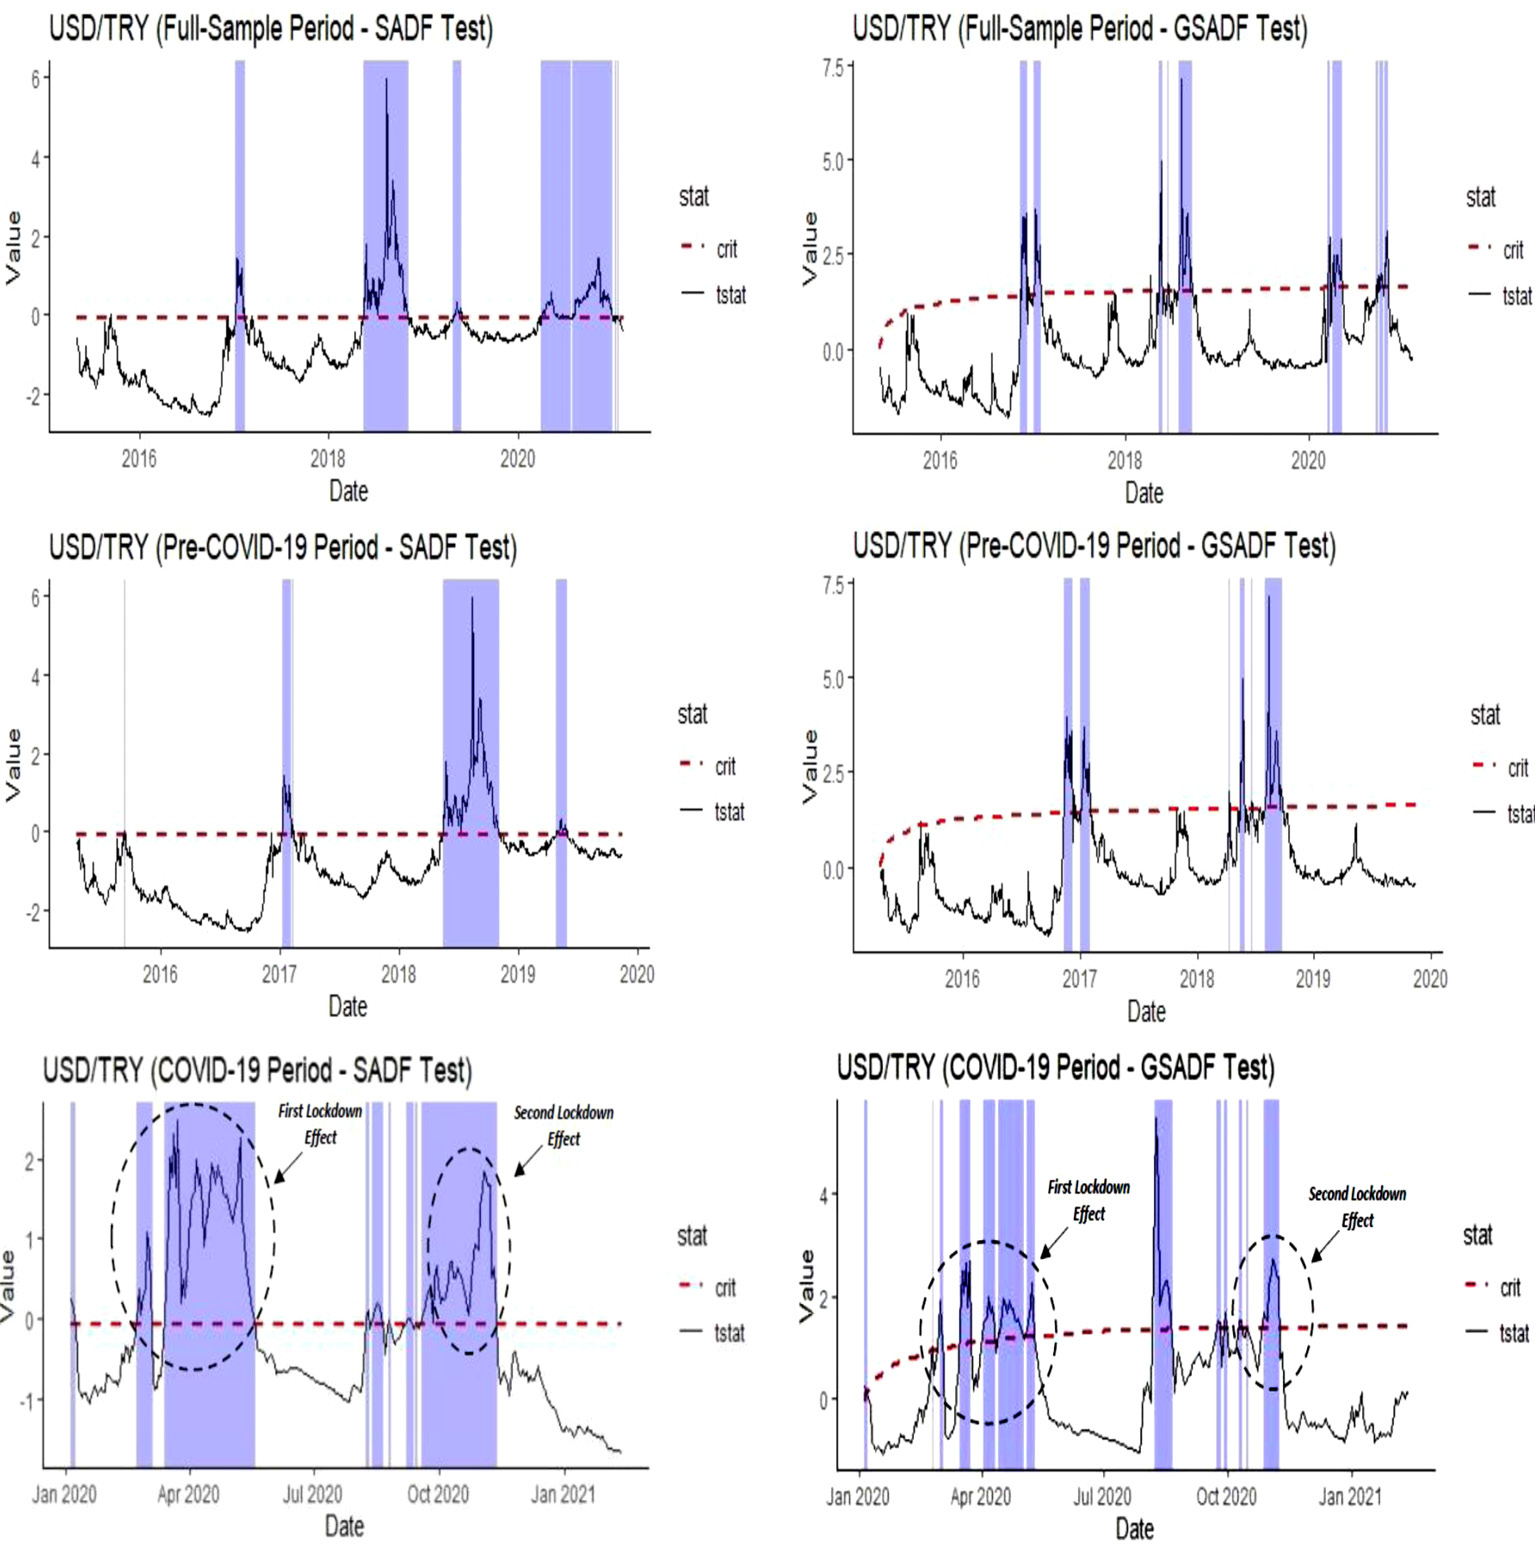
Figure 2. Date-Stamping Bubble Periods in the USD/TRY Exchange Rate
Second, the results for the EUR/TRY exchange rate are represented in Table 4. We refer to Panel A where full-sample evidence is represented. Over the full-sample period of data, the null hypothesis of a unit-root is rejected for the SADF test and GSADF test, suggesting that the EUR/TRY exchange rate also indicates an explosive behavior. In consideration of full-sample period results, the explosiveness of the EUR/TRY exchange rate is then tested by two sub-periods, namely the pre-COVID-19 (i.e., in Panel B) and the COVID-19 samples (i.e., in Panel C). On the one hand, it is found that in the pre-COVID-19 period, the EUR/TRY exchange rate still provides evidence of bubble-type behavior where the null hypothesis of a unit root is rejected at the 1% significance level. On the other hand, the same evidence also holds for the COVID-19 period that the null hypothesis is rejected at the 1% significance level in favor of explosiveness for EUR/TRY exchange rate, suggesting that the series exhibit an evidence of bubble activity.
Table 4. Bubbles Tests Results (EUR/TRY)
|
Panel A: Full-sample period (02/01/2015 to 12/02/2021), T=1596, Window Width=87, Monte Carlo Rep=2000 |
||||||
|
SADF test |
GSADF test |
|||||
|
No. of days of bubbles |
Longest continuous days of bubbles |
SADF test |
No. of days of bubbles |
Longest continuous days of bubbles |
GSADF test |
|
|
EUR/TRY |
615 |
283 |
5.78*** |
197 |
71 |
5.98*** |
|
Critical Values: |
Critical Values: |
|||||
|
Panel B: Pre-COVID-19 period (02/01/2015 to 15/11/2019), T=1271, |
||||||
|
SADF test |
GSADF test |
|||||
|
No. of days of bubbles |
Longest continuous days of bubbles |
SADF test |
No. of days of bubbles |
Longest continuous days of bubbles |
GSADF test |
|
|
EUR/TRY |
389 |
283 |
5.78*** |
110 |
47 |
5.98*** |
|
Critical Values: |
Critical Values: |
|||||
|
Panel C: COVID-19 period (18/11/2019 to 12/02/2021), T=325, |
||||||
|
SADF test |
GSADF test |
|||||
|
No. of days of bubbles |
Longest continuous days of bubbles |
SADF test |
No. of days of bubbles |
Longest continuous days of bubbles |
GSADF test |
|
|
EUR/TRY |
141 |
78 |
2.27*** |
36 |
11 |
4.13*** |
|
Critical Values: |
Critical Values: |
|||||
Note: The critical values for SADF and GSADF test methods are provided by 2000 replications of the Monte Carlo simulation. The lag length is selected through the Akaike Information Criterion (AIC). The constant and trend are included in the test equation. *** means that the test statistics are significant at %99 confidence level. The results are obtained by the RStudio and the “exuber” package.
Figure 3 detects the intensity of explosiveness for EUR/TRY exchange rate and shows estimates of the number of days of bubbles for three different periods. While the pre-COVID-19 period indicates that there were 389 days for which bubble activity was detected, the COVID-19 period shows that the bubble-type behavior is found through 141 days. Although the number of days is reduced in the COVID-19 era, the latter period has a greate effect in terms of the bubble activity and the sample size. Similar to the USD/TRY exchange rate results, the explosiveness of bubble formation occurred approximately in one-third of the total sample. Furthermore, the number of continuous days of bubble activity has still been relatively high in which the SADF test statistics provide more longest period bubbles than the GSADF test statistics.
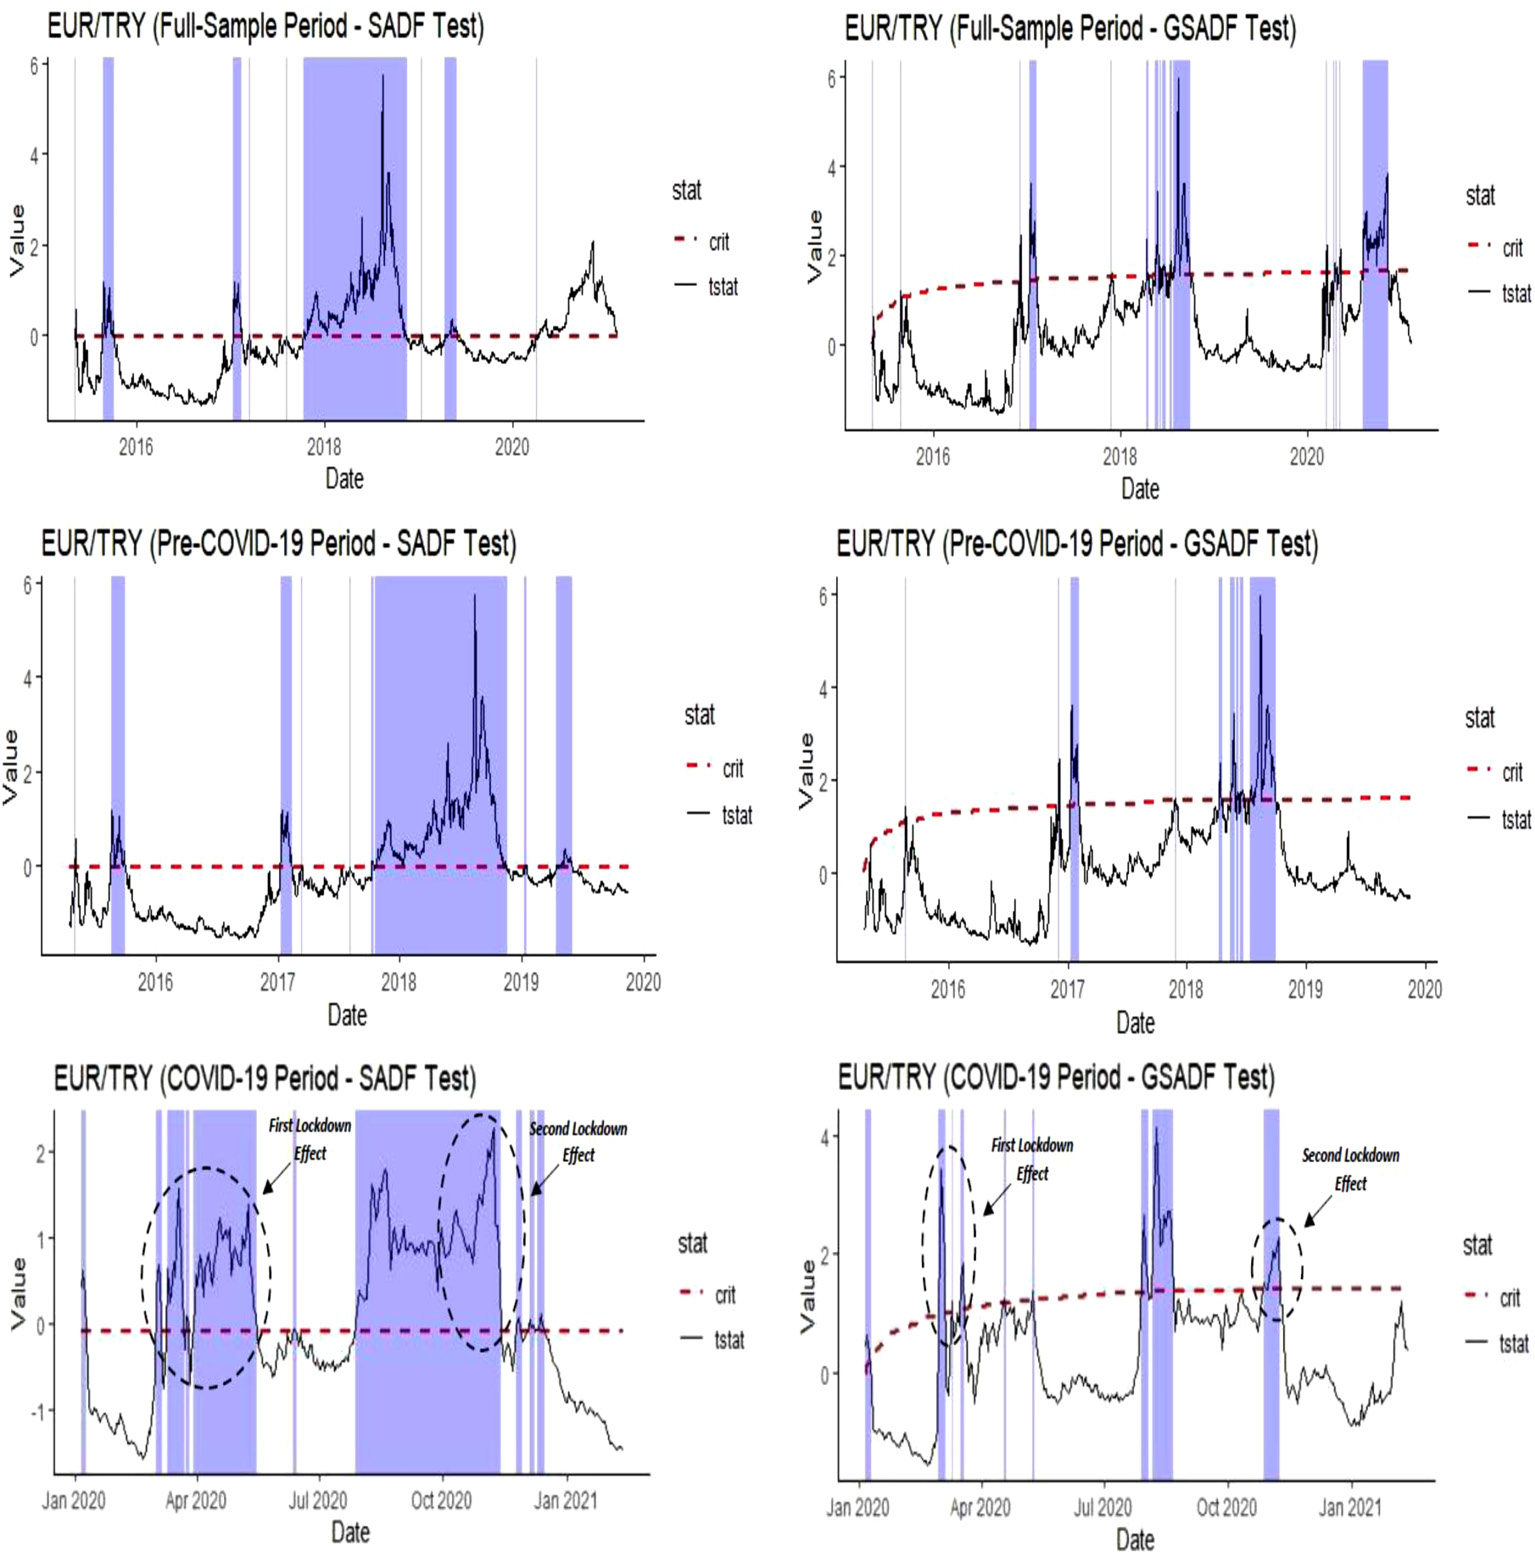
Figure 3. Date-Stamping Bubble Periods in the EUR/TRY Exchange Rate
Third, the results on explosive bubbles for the GBP/TRY exchange rate are summarized in Table 5. Considering the full-sample results, two sets of tests describe that bubble-type activity was prevailing for each period, even if their weights were different from each other. In that vein, the null hypothesis of a unit root is rejected at the 1% significant level both for the SADF test and GSADF test over the full-sample period of data, suggesting that the GBP/TRY exchange rate is characterized by explosive behavior. Also, the division of the whole sample into two parts as the pre-COVID-19 period and the COVID-19 period reveals the fact that the rejection of null hypothesis of bubble-type activity in the GBP/TRY exchange rate is still significant at the 99% confidence level. Therefore, the comparison of the two periods only differs from each other in terms of their potential to emerge an explosive bubble behavior although both periods were relatively stable as regards the USD/TRY and EUR/TRY exchange rates.
Table 5. Bubbles Tests Results (GBP/TRY)
|
Panel A: Full-sample period (02/01/2015 to 12/02/2021), T=1596, |
||||||
|
SADF test |
GSADF test |
|||||
|
No. of days of bubbles |
Longest continuous days of bubbles |
SADF test |
No. of days of bubbles |
Longest continuous days of bubbles |
GSADF test |
|
|
GBP/TRY |
363 |
144 |
5.64*** |
95 |
29 |
5.89*** |
|
Critical Values: |
Critical Values: |
|||||
|
Panel B: Pre-COVID-19 period (02/01/2015 to 15/11/2019), T=1271, |
||||||
|
SADF test |
GSADF test |
|||||
|
No. of days of bubbles |
Longest continuous days of bubbles |
SADF test |
No. of days of bubbles |
Longest continuous days of bubbles |
GSADF test |
|
|
GBP/TRY |
206 |
128 |
5.64*** |
62 |
23 |
5.89*** |
|
Critical Values: |
Critical Values: |
|||||
|
Panel C: COVID-19 period (18/11/2019 to 12/02/2021), T=325, |
||||||
|
SADF test |
GSADF test |
|||||
|
No. of days of bubbles |
Longest continuous days of bubbles |
SADF test |
No. of days of bubbles |
Longest continuous days of bubbles |
GSADF test |
|
|
GBP/TRY |
91 |
33 |
1.99** |
18 |
11 |
3.37*** |
|
Critical Values: |
Critical Values: |
|||||
Note: The critical values for SADF and GSADF test methods are provided by 2000 replications of the Monte Carlo simulation. The lag length is selected through the Akaike Information Criterion (AIC). The constant and trend are included in the test equation. *** and ** mean that the test statistics are significant at %99 and %95 confidence levels, respectively. The results are obtained by the RStudio and the “exuber” package.
The next set of results is about the detection of bubble intensity based on date limits, which is represented in Figure 4. The date-stamping bubble periods in estimating the number of days of bubbles provide significant outcomes to handle the explosive bubbles for the sample periods. First, it is found that there were 363 days for the SADF test and 95 days for the GSADF test over which bubble activity was determined from January 2, 2015 to February 12, 2021. Second, in the COVD-19 sample, the number of bubble activities was 91 days for the SADF test and 18 days for the GSADF test. Especially, when the GBP/TRY exchange rate is compared with the USD/TRY and EUR/TRY exchange rates in terms of the number of days of bubbles, the GBP/TRY exchange rate was relatively mild although the explosiveness of bubbles in the forex market was still prevailing. Finally, the same attitude in the GBP/TRY exchange rate for bubble-type activity was still significant for the pre-COVID-19 era and thus the results show that the GBP/TRY exchange rate amounted to 206 days of bubbles for the SADF test and 62 days of bubbles for the GSADF test.
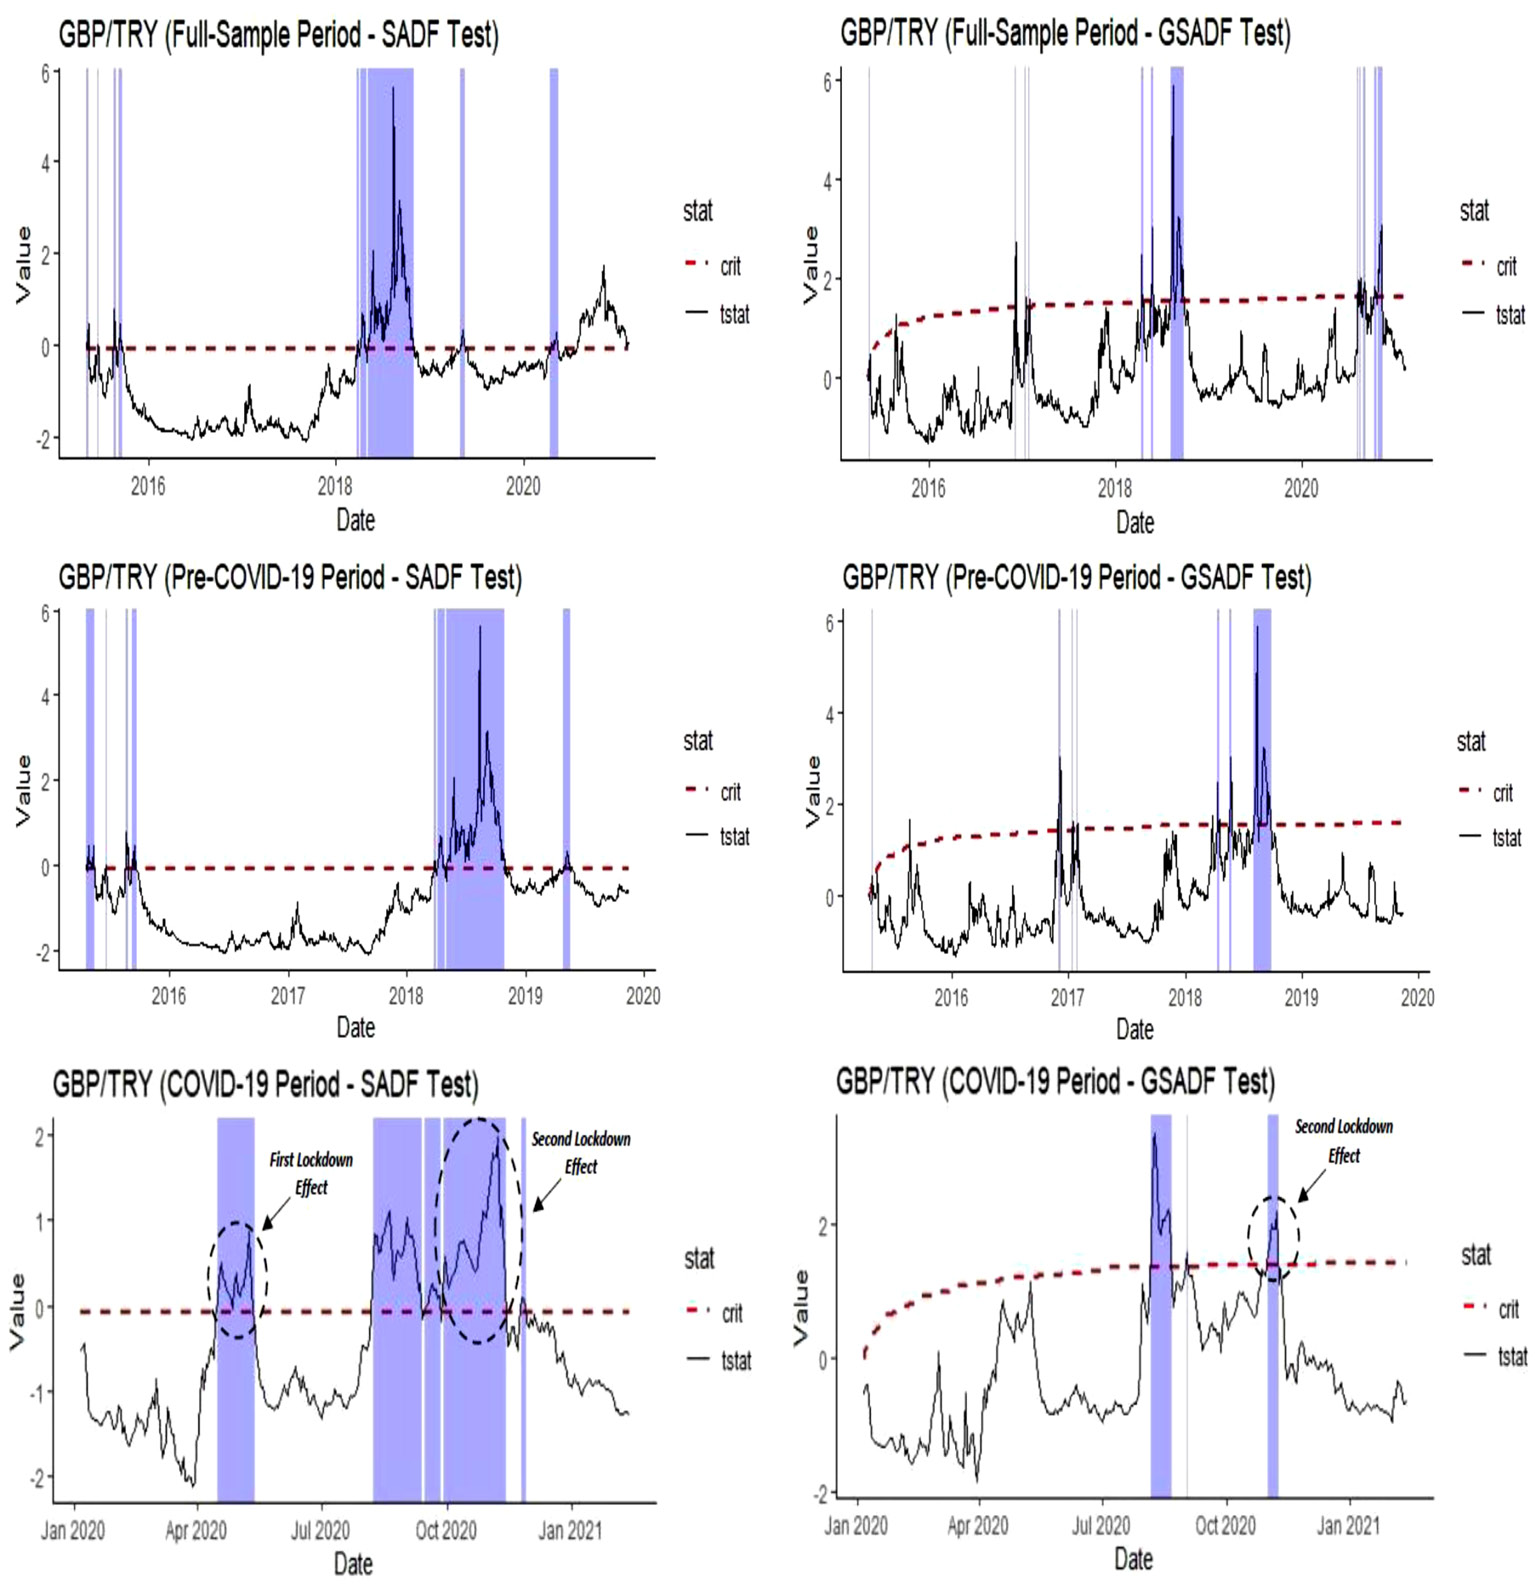
Figure 4. Date-Stamping Bubble Periods in the GBP/TRY Exchange Rate
Fourth, the CNY/TRY exchange rate represented in Table 6 also exhibits a bubble behavior over the full-sample period, and the other two sub-periods, as expected. The crucial feature of that bubble behavior can be seen from the test statistics of SADF and GSADF methods. The results imply that the bubble-type activity is as significant as the other three exchange rates, namely USD/TRY, EUR/TRY, and GBP/TRY. One of the major reasons behind this ever-growing importance of the Chinese Yuan is an increasing scale of trade between China and Turkey, especially after the financial crisis of 2007/2008. Therefore, any kind of a rise in trade-based activity among those countries indirectly affects the CNY/TRY exchange rate and thus leads to a potential of bubble occurrence in forex markets. In particular, based on the COVID-19 period results of both statistics, the financial investors overwhelmingly intended to transact between China and Turkey. Therefore, this type of behavior exacerbated the bubble formation in the CNY/TRY exchange rate and was characterized by explosiveness.
Table 6. Bubbles Tests Results (CNY/TRY)
|
Panel A: Full-sample period (02/01/2015 to 12/02/2021), T=1596, |
||||||
|
SADF test |
GSADF test |
|||||
|
No. of days of bubbles |
Longest continuous days of bubbles |
SADF test |
No. of days of bubbles |
Longest continuous days of bubbles |
GSADF test |
|
|
CNY/TRY |
358 |
149 |
5.40*** |
197 |
53 |
5.72*** |
|
Critical Values: |
Critical Values: |
|||||
|
Panel B: Pre-COVID-19 period (02/01/2015 to 15/11/2019), T=1271, |
||||||
|
SADF test |
GSADF test |
|||||
|
No. of days of bubbles |
Longest continuous days of bubbles |
SADF test |
No. of days of bubbles |
Longest continuous days of bubbles |
GSADF test |
|
|
CNY/TRY |
202 |
149 |
5.40*** |
114 |
25 |
5.72*** |
|
Critical Values: |
Critical Values: |
|||||
|
Panel C: COVID-19 period (18/11/2019 to 12/02/2021), T=325, |
||||||
|
SADF test |
GSADF test |
|||||
|
No. of days of bubbles |
Longest continuous days of bubbles |
SADF test |
No. of days of bubbles |
Longest continuous days of bubbles |
GSADF test |
|
|
CNY/TRY |
141 |
71 |
3.10*** |
97 |
20 |
4.60*** |
|
Critical Values: |
Critical Values: |
|||||
Note: The critical values for SADF and GSADF test methods are provided by 2000 replications of the Monte Carlo simulation. The lag length is selected through the Akaike Information Criterion (AIC). The constant and trend are included in the test equation. *** means that the test statistics are significant at %99 confidence level. The results are obtained by the RStudio and the “exuber” package.
The above-mentioned results on the explosive behavior in the CNY/TRY exchange rate can be easily understood by looking at date-stamping bubble periods, represented in Figure 5. As the full-sample period results show that the number of days of bubbles is 358 for the SADF test and is 197 for the GSADF test, it corresponds to that one-fifth and one-seventh of the total sample exhibits a bubble-type behavior in the CNY/TRY exchange rate, respectively. Moreover, a similar pattern of bubble formation can be seen from the two sub-periods, i.e., pre-COVID-19 and COVID-19 period. The crucial point among the statistics is the number of days of bubbles in the COVID-19 period in which a very long process of explosive bubbles in the CNY/TRY exchange rate is exhibited. Especially the lockdowns produce a huge effect on fluctuations occurring in the CNY/TRY exchange rate and thereby directly leads to the emergence of bubble-type behavior. Actually, this correlation can be thought of as mutual since the bubble-type activities can also exacerbate the fluctuations over the sample period. Also, the estimation of the number of continuous days of bubbles shows that the CNY/TRY exchange rate sees one of the largest jumps in bubble activity in the COVID-19 era as compared to other exchange rates, which is 71 continuous days of bubbles for the SADF test and is 20 continuous days of bubbles for the GSADF test, represented in Panel C.
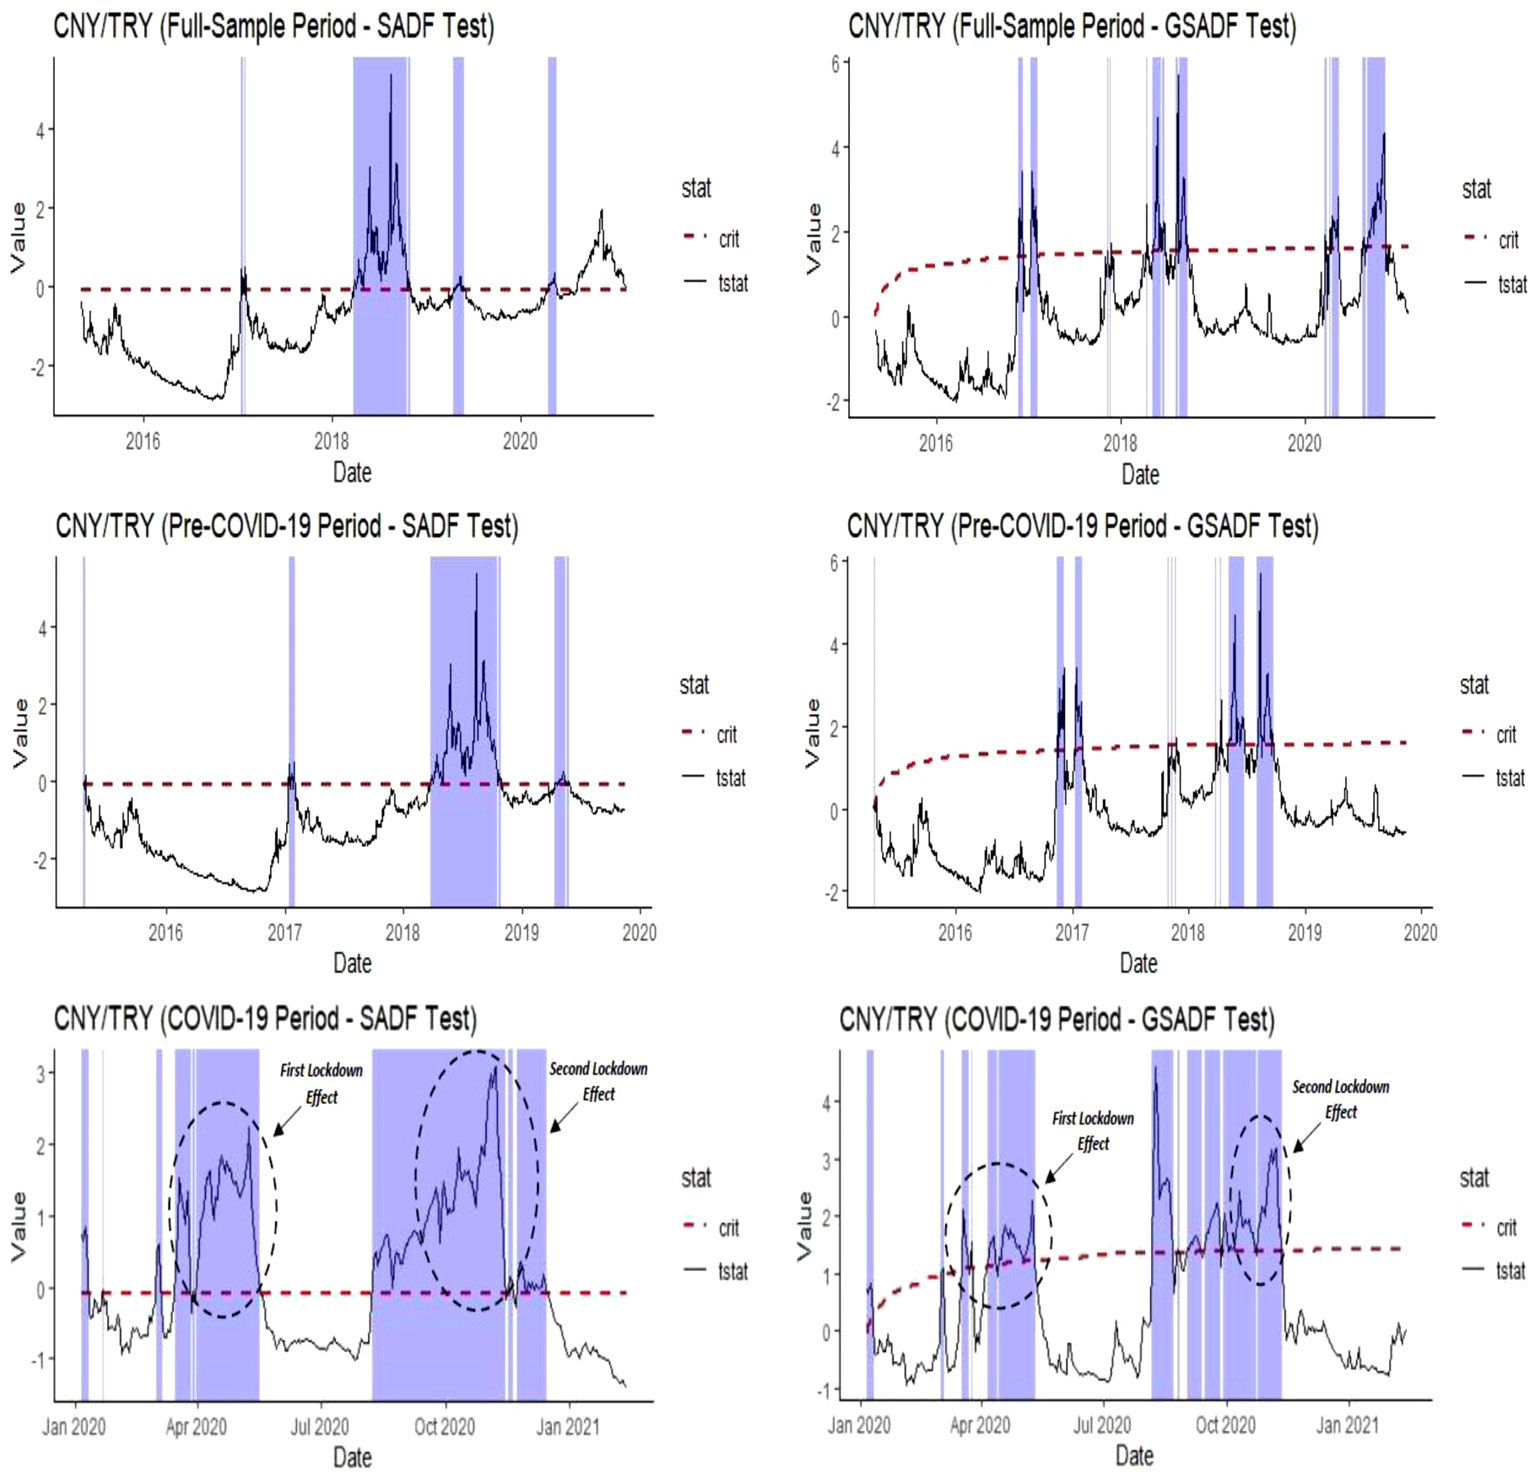
Figure 5. Date-Stamping Bubble Periods in the CNY/TRY Exchange Rate
The final point of note is about the implementation of recursive right-tailed unit root tests for the detecting of explosiveness in the RUB/TRY exchange rate over the sample period along with its two sub-periods, represented in Table 7. The most crucial difference which is obtained from the SADF and GSADF test statistics is that the RUB/TRY exchange rate performs an insignificant pattern of bubble-type activity in the COVID-19 period in terms of the sub-ADF test. However, according to the GSADF test statistics, the presence of bubbles was still in consideration at the COVID-19 outbreak. One of the main reasons behind the relatively mild behavior of the RUB/TRY exchange rate can be deduced from the volume of financial transactions between Russia and Turkey, which is relatively much lower than that for the other currencies. Therefore, the bubble formation of the RUB/TRY exchange rate could be postponed for the COVID-19 period. While the evidence of explosive behavior for the RUB/TRY exchange rate was heavily indicating much lighter conditions at the COVID-19 pandemic, the same conclusion is not true for the other periods covering Panels A and B. Hence, over the full-sample period and the pre-COVID-19 period of data, the null hypothesis of a unit root is rejected for the RUB/TRY exchange rate, suggesting that it is characterized by explosive behavior.
Table 7. Bubbles Tests Results (RUB/TRY)
|
Panel A: Full-sample period (02/01/2015 to 12/02/2021), T=1596, |
||||||
|
SADF test |
GSADF test |
|||||
|
No. of days of bubbles |
Longest continuous days of bubbles |
SADF test |
No. of days of bubbles |
Longest continuous days of bubbles |
GSADF test |
|
|
RUB/TRY |
185 |
80 |
2.78*** |
78 |
28 |
4.89*** |
|
Critical Values: |
Critical Values: |
|||||
|
Panel B: Pre-COVID-19 period (02/01/2015 to 15/11/2019), T=1271, |
||||||
|
SADF test |
GSADF test |
|||||
|
No. of days of bubbles |
Longest continuous days of bubbles |
SADF test |
No. of days of bubbles |
Longest continuous days of bubbles |
GSADF test |
|
|
RUB/TRY |
196 |
80 |
2.78*** |
83 |
28 |
4.89*** |
|
Critical Values: |
Critical Values: |
|||||
|
Panel C: COVID-19 period (18/11/2019 to 12/02/2021), T=325, |
||||||
|
SADF test |
GSADF test |
|||||
|
No. of days of bubbles |
Longest continuous days of bubbles |
SADF test |
No. of days of bubbles |
Longest continuous days of bubbles |
GSADF test |
|
|
RUB/TRY |
None |
None |
0.929 |
5 |
3 |
5.09*** |
|
Critical Values: |
Critical Values: |
|||||
Note: The critical values for SADF and GSADF test methods are provided by 2000 replications of the Monte Carlo simulation. The lag length is selected through the Akaike Information Criterion (AIC). The constant and trend are included in the test equation. *** means that the test statistics are significant at %99 confidence level. The results are obtained by the RStudio and the “exuber” package.
The set of results for the case of the volume of bubble intensity in the RUB/TRY exchange rate is represented by Figure 6. The comparison of date-stamping bubble periods in Figure 6 implies that the explosive bubble behavior is only relevant to the full-sample and pre-COVID-19 periods along with a much lesser number of days of bubbles. Also, the graphical representation of bubble formation for the COVID-19 era shows that the lockdowns were only influential in the first period and thus the second lockdown touched slightly the RUB/TRY exchange rate. Therefore, it can be argued that the RUB/TRY exchange rate was relatively more stable at a given sample period than the other selected exchange rates.
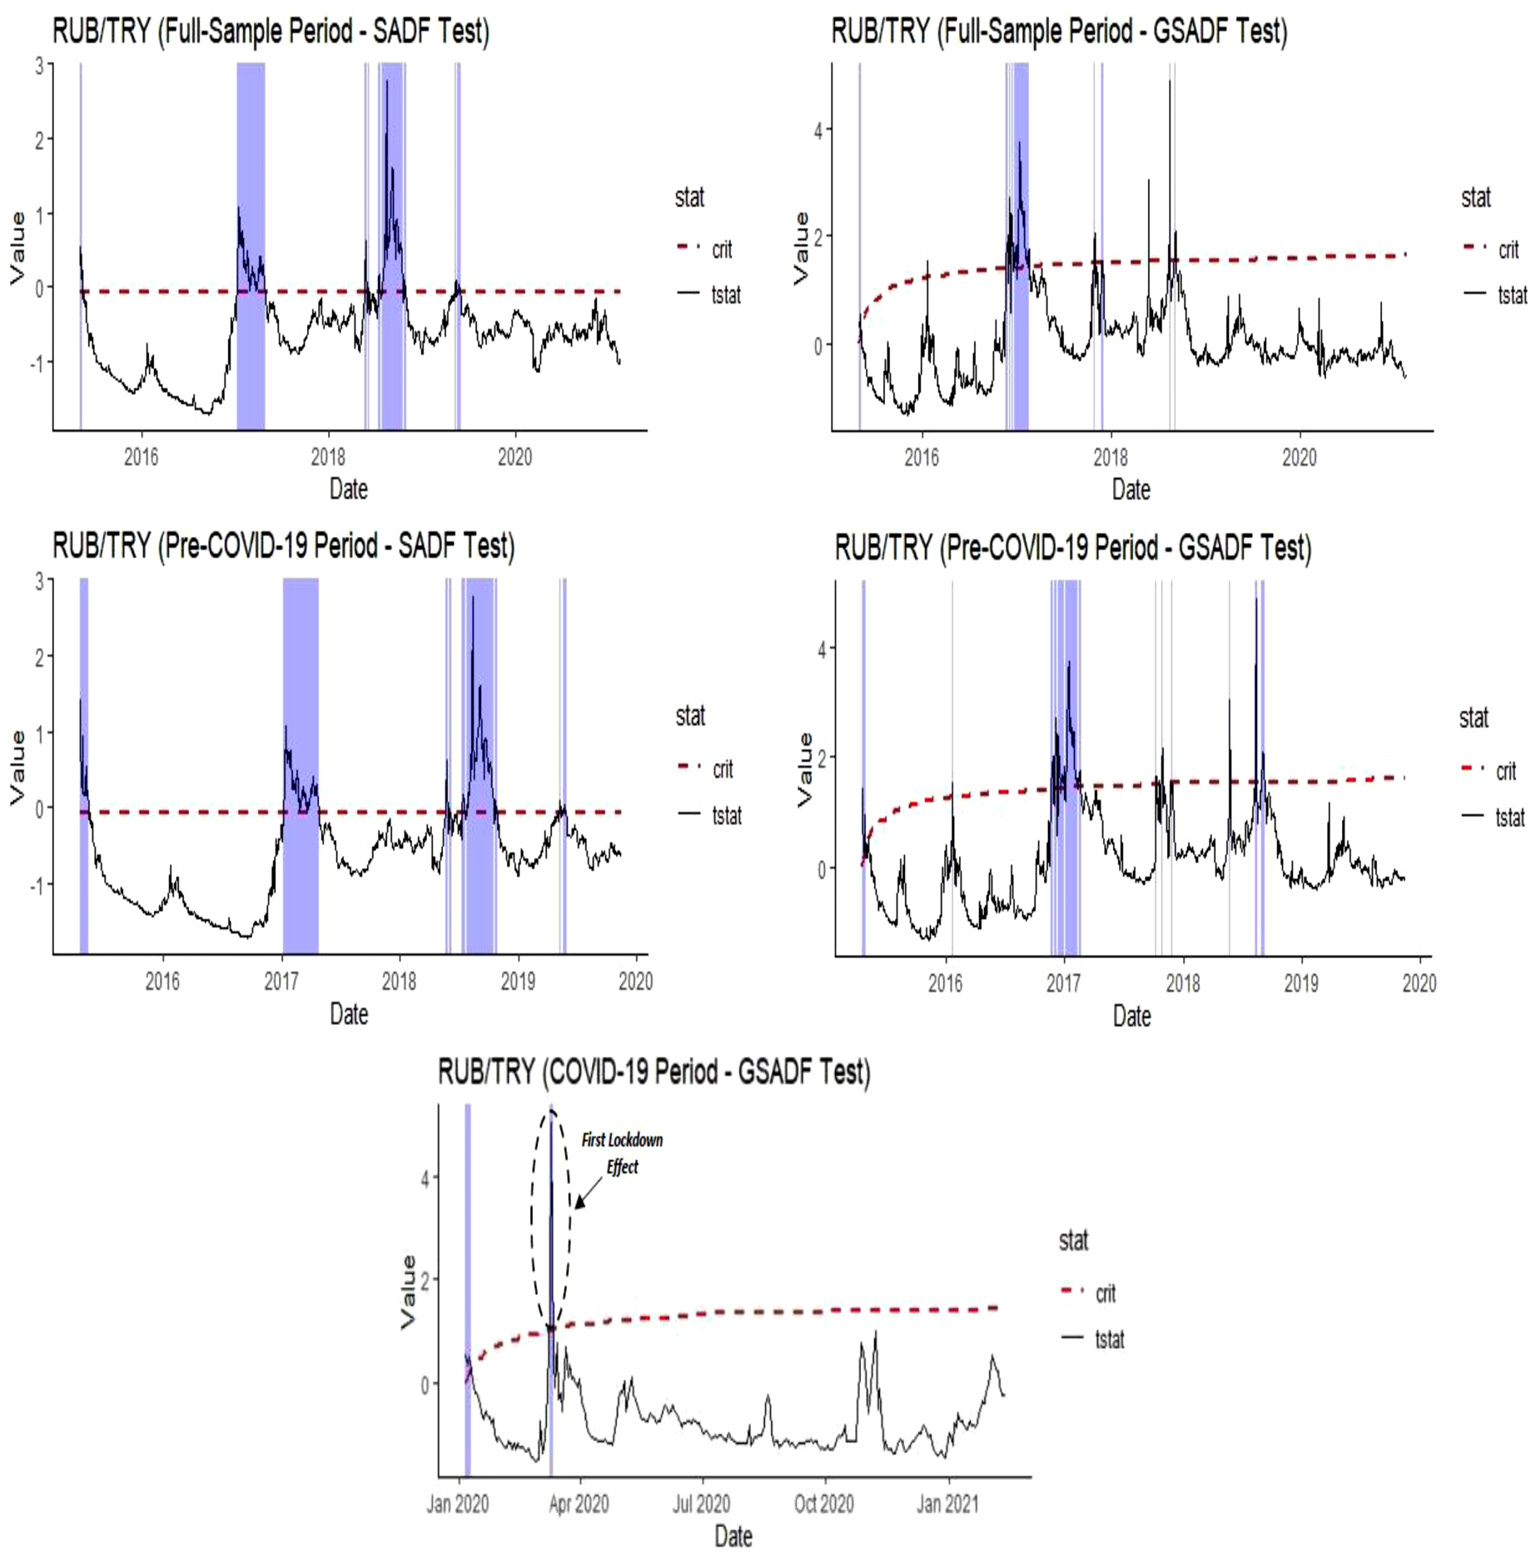
Figure 6. Date-Stamping Bubble Periods in the RUB/TRY Exchange Rate
All in all, to sum up the big picture, the empirical findings are summarized in Table 8. The core reason to gather all the information on the evidence of explosive behavior in selected exchange rates is to grasp which currency is more inclined to the occurrence of bubbles and to what extent. The view to the selected exchange rates over the full-sample period of data suggests that the EUR/TRY exchange rate has the largest number of days showing bubbles along with the longest continuous days of bubbles. Also, the same pattern of possible bubble collapse was relevant to given exchange rates but highly influential to the EUR/TRY exchange rate. However, the results were changed at the COVID-19 pandemic where the largest impact of explosive bubble behavior transferred from EUR/TRY to CNY/TRY exchange rate. Also, the SADF test result of RUB/TRY shows that there was no bubble-type activity during the COVID-19 period.
Table 8. Summary of the Test Results of Explosive Bubbles
|
Full-sample period (02/01/2015 to 12/02/2021) |
||||||
|
SADF test |
GSADF test |
|||||
|
No. of days of bubbles |
Longest continuous days of bubbles |
SADF test |
No. of days of bubbles |
Longest continuous days of bubbles |
GSADF test |
|
|
USD/TRY |
381 |
125 |
5.95*** |
161 |
40 |
7.15*** |
|
EUR/TRY |
615 |
283 |
5.78*** |
197 |
71 |
5.98*** |
|
GBP/TRY |
363 |
144 |
5.64*** |
95 |
29 |
5.89*** |
|
CNY/TRY |
358 |
149 |
5.40*** |
197 |
53 |
5.72*** |
|
RUB/TRY |
185 |
80 |
2.78*** |
78 |
28 |
4.89*** |
|
Pre-COVID-19 period (02/01/2015 to 15/11/2019) |
||||||
|
SADF test |
GSADF test |
|||||
|
No. of days of bubbles |
Longest continuous days of bubbles |
SADF test |
No. of days of bubbles |
Longest continuous days of bubbles |
GSADF test |
|
|
USD/TRY |
181 |
125 |
5.97*** |
101 |
33 |
7.13*** |
|
EUR/TRY |
389 |
283 |
5.78*** |
110 |
47 |
5.98*** |
|
GBP/TRY |
206 |
128 |
5.64*** |
62 |
23 |
5.89*** |
|
CNY/TRY |
202 |
149 |
5.40*** |
114 |
25 |
5.72*** |
|
RUB/TRY |
196 |
80 |
2.78*** |
83 |
28 |
4.89*** |
|
COVID-19 period (18/11/2019 to 12/02/2021) |
||||||
|
SADF test |
GSADF test |
|||||
|
No. of days of bubbles |
Longest continuous days of bubbles |
SADF test |
No. of days of bubbles |
Longest continuous days of bubbles |
GSADF test |
|
|
USD/TRY |
113 |
48 |
2.49*** |
64 |
14 |
5.51*** |
|
EUR/TRY |
141 |
78 |
2.27*** |
36 |
11 |
4.13*** |
|
GBP/TRY |
91 |
33 |
1.99** |
18 |
11 |
3.37*** |
|
CNY/TRY |
141 |
71 |
3.10*** |
97 |
20 |
4.60*** |
|
RUB/TRY |
None |
None |
0.929 |
5 |
3 |
5.09*** |
Note: The critical values for SADF and GSADF test methods are provided by 2000 replications of the Monte Carlo simulation. The lag length is selected through the Akaike Information Criterion (AIC). The constant and trend are included in the test equation. *** and ** mean that the test statistics are significant at %99 and %95 confidence levels, respectively. The results are obtained by the RStudio and the “exuber” package.
5. Concluding Remarks
In this paper, we implement recursive right-tailed unit root tests to detect bubble activity for Turkish Lira against financially most-traded five currencies (i.e., the US Dollar (USD/TRY), the British pound (GBP/TRY), the Euro (EUR/TRY), the Chinese Yuan (CNY/TRY) and the Russian Ruble (RUB/TRY)) over January 2, 2015 to February 12, 2021. To get a full understanding about the bubble collapse, we split the time into three categories as pre-COVID-19 period (i.e., January 2, 2019 to November 15, 2019), COVID-19 period (i.e., November 18, 2019 to February 12, 2021), and the full-sample period (i.e., January 2, 2015 to February 12, 2021). For the data of five exchange rates sampled daily (5-day weeks), the SADF and the GSADF test statistics show that in the full-sample and the pre-COVID-19 periods there are fully exposed evidences of explosiveness in selected exchange rates. Besides, in the COVID-19 sample, we also find a high degree of evidence of exchange rate explosiveness: except for the RUB/TRY in the SADF test, all currencies are characterized by explosive behavior. One of the core findings from the right-tailed unit root tests is the number of days of bubbles in the COVID-19 pandemic compared to the other sample periods. We conclude that the bubble-type behavior has increased in the COVID-19 era even though the other periods exhibited a similar pattern, implying that the exchange rate market has become more unstable in the pandemic compared to the prior periods.
References
Al-Awadhi, A. M., Al-Saifi, K., Al-Awadhi, A. and Alhammadi, S. (2020). Death and Contagious Infectious Diseases: Impact of the COVID-19 Virus on Stock Market Returns. Journal of Behavioral and Experimental Finance, 27, 100326, https://doi.org/10.1016/j.jbef.2020.100326.
Bettendorf, T. and Chen, W. (2013). Are There Bubbles in the Sterling-Dollar Exchange Rate? New Evidence from Sequential ADF Tests. Economics Letters, 120, 2, 350–353. https://doi.org/10.1016/j.econlet.2013.04.039.
Bohte, R. and Rossini, L. (2019). Comparing the Forecasting of Cryptocurrencies by Bayesian Time-Varying Volatility Models. Journal of Risk and Financial Management, 12, 3. https://doi.org/10.3390/jrfm12030150.
Bolt, W. and van Oordt, M. R. C. (2019). On the Value of Virtual Currencies, Journal of Money, Credit, and Banking, 52, 4, 835–862. https://doi.org/10.1111/jmcb.12619.
Cohen, G. (2020). Forecasting Bitcoin Trends Using Algorithmic Learning Systems. Entropy, 22, 838. https://doi.org/10.3390/e22080838.
Devpura, N. and Narayan, P. K. (2020). Hourly Oil Price Volatility: The Role of COVID-19. Energy Research Letters, 1, 2, 13683. https://doi.org/10.46557/001c.13683.
Devpura, N. (2021). Effect of COVID-19 on the Relationship Between Euro/USD Exchange Rate and Oil Price. MethodsX, 8, 101262. https://doi.org/10.1016/j.mex.2021.101262.
Derbentsev, V., Datsenko, N., Stepanenko, O. and Bezkorovainyi, V. (2019). Forecasting Cryptocurrency Prices Time Series Using Machine Learning Approach, SHS Web of Conferences 65, 02001. https://doi.org/10.1051/shsconf/20196502001.
Grobys, K. and Junttila, J. (2021). Speculation and Lottery-like Demand in Cryptocurrency Markets. Journal of International Financial Markets, Institutions and Money, (in press). https://doi.org/10.1016/j.intfin.2021.101289.
Gu, X., Ying, S., Zhang, W. and Tao, Y. (2020). How Do Firms Respond to COVID-19? First Evidence from Suzhou, China. Emerging Markets Finance and Trade, 56, 10, 2181–2197. https://doi.org/10.1080/1540596x.2020.1789455.
Haroon, O. and Rizvi, S. A. R. (2020). Flatten the Curve and Stock Market Liquidity – An Inquiry into Emerging Economies. Emerging Markets Finance and Trade, 56, 10, 2151–2161. https://doi.org/10.1080.1540496x.2020.1784716.
Hu, Y. and Oxley, L. (2017). Are There Bubbles in Exchange Rates? Some New Evidence from G10 and Emerging Market Economies. Economic Modelling, 64, 419-442. https://doi.org/10.1016/j.econmod.2017.02.022.
Iyke, B. N. (2020). COVID-19: The Reaction of US Oil and Gas Producers to the Pandemic. Energy Research Letters, 1, 2, 13912. https://doi.org/10.46557/001c.13912.
Liu, L., Wang, E.-Z. and Lee, C.-C. (2020). Impact of the COVID-19 Pandemic on the Crude Oil and Stock Markets in the US: A Time-Varying Analysis. Energy Research Letters, 1, 1, 13154. https://doi.org/10.46557/001c.13154.
Mudassir, M., Bennbaia, S., Unal, D. and Hammoudeh, M. (2020). Time-Series Forecasting of Bitcoin Prices Using High-Dimensional Features: A Machine Learning Approach. Neural Computing and Applications. https://doi.org/10.1007/s00521-020-05129-6.
Narayan, P. K., Devpura, N. and Wang, H. (2020). Japanese Currency and Stock Market-What Happened During the COVID-19 Pandemic? Economic Analysis and Policy, 68, 191–198. https://doi.org/10.1016/j.eap.2020.09.014.
Narayan, P. K. (2020). Did Bubble Activity Intensify During COVID-19? Asian Economics Letters, 1, 2. https://doi.org/10.46557/001c.17654.
Nasir, M. A., Huynh, T. L. D., Nguyen, S. P. and Duong, D. (2019). Forecasting Cryptocurrency Returns and Volume Using Search Engines. Financial Innovation, 5, 2. https://doi.org/10.1186/s40854-018-0119-8.
Phillips, P. C. B. and Shi, S-P. (2018). Financial Bubble Implosion and Reverse Regression. Econometric Theory. 34, 4, 705–753. https://doi.org/10.1017/S0266466617000202.
Phillips, P. C. B. and Shi, S-P. (2020). Real Time Monitoring of Asset Markets: Bubbles and Crises. In H. D. Vinod and C. R. Rao (Eds.). Handbook of Statistics: Financial. Macro and Micro Econometrics Using R, 42, 61–80, Amsterdam: Elsevier.
Phillips, P. C. B., Wu, Y. and Yu, J. (2011). Explosive Behavior in the 1990s Nasdaq: When Did Exuberance Escalate Asset Values? International Economic Review, 52, 1, 201–226. https://doi.org/10.1111/j.1468-2354-2010.00625.x.
Phillips, P. C. B., Shi, S-P. and Yu, J. (2015). Testing for Multiple Bubbles: Historical Episodes of Exuberance and Collapse in the S&P 500. International Economic Review, 56, 4, 1043–1078. https://doi.org/10.1111/iere.12.132.
Qin, M., Zhang, Y.-C. and Su, C.-W. (2020). The Essential Role of Pandemics: A Fresh Insight into the Oil Market. Energy Research Letters, 1, 1. https://doi.org/10.46557/001c.13166.
Salisu, A. A., Akanni, L. and Raheem, I. (2020). The COVID-19 Global Fear Index and the Predictability of Commodity Price Returns. Journal of Behavioral and Experimental Finance, 27, 100383. https://doi.org/10.1016/j.jbef.2020.100383.
Sha, Y. and Sharma, S. S. (2020). Research on Pandemics Special Issue of the Journal Emerging Markets Finance and Trade. Emerging Markets, Finance and Trade, 56, 10, 2133–2137. https://doi.org/10.1080/1540496x.2020.1795467.
Zaremba, A., Kizys, R., Aharon, D. Y. and Demir, E. (2020). Infected Markets: Novel Coronavirus, Government Interventions, and Stock Return Volatility Around the Globe, Financial Research Letters, 35, 101597. https://doi.org/10.1016/j.frl.2020.101597.
Zhang, D., Hu, M. and Ji, Q. (2020). Financial Markets Under the Global Pandemic of COVID-19. Finance Research Letters, 36, 101528. https://doi.org/10.1016/j.frl.2020.101528.