Ekonomika ISSN 1392-1258 eISSN 2424-6166
2021, vol. 100(1), pp. 67–74 DOI: https://doi.org/10.15388/Ekon.2021.1.4
Macroeconomic Uncertainty and Empirical Research Results of its Quantitative Measurement in Georgia
David Kbiladze
Davit Agmashenebeli University of Georgia, Georgia
Shorena Metreveli
Georgian Technical University, Georgia
Tamar Kbiladze
Ivane Javakhishvili Tbilisi State University, Georgia
Email: tamar.kbiladze@tsu.ge
Abstract. The present article describes the approaches and definition of the concept of uncertainty proposed by its authors, a quantitative evaluation of uncertainty, and materials of the empirical study used to explore the said issues on the example of macroeconomics of Georgia. We hope that the views given in the article will be useful for developing countries, particularly for the economic policy-makers in the post-communist states, as well as for the academic and scientific circles engaged in the studies of the above-listed issues.
Keywords: uncertainty, macroeconomic uncertainty, magic square, magic pentagon, correlation coefficient, macroeconomic imbalance, model of macroeconomic development.
Received: 21/01/2021. Revised: 25/02/2021. Accepted: 21/03/2021
Copyright © 2021 David Kbiladze, Shorena Metreveli, Tamar Kbiladze. Published by Vilnius University Press
This is an Open Access article distributed under the terms of the Creative Commons Attribution License, which permits unrestricted use, distribution, and reproduction in any medium, provided the original author and source are credited.
1. Introduction
Academic economists and mathematicians see the concept of uncertainty, the role of uncertainty in macroeconomics, and its quantitative evaluation in different ways. Such a difference is mostly subject to the statistical regularities of the current events and processes in the economy, meaning that a change of one event does not lead to the change of another event or events always, everywhere or under any circumstances, but on average and only in most cases (Gabidzashvili, Kbiladze, 2010). It was this principle used as the basis to study of the multifactorial relations between events to assess the level of uncertainty at the macro-level of a country. “Uncertainty is a gap between an expected condition and an actual development of the economic-organizational system” (Kuzmin, 2012).
The authors of the present article try to make certain modifications to the definition of uncertainty given above, especially by considering the current and unforeseen world events. They explain the need for such a change based on the description of the macroeconomic situation in a country. They do this by using the structural-logical plan of the macroeconomic policy developed by German economists K. Seidel and P. Tioman, named the Magic Square of Goals. The main macroeconomic indicators are viewed as the sides of the “Magic Square”:
I - (Stable prices and foreign economic balance);
II - (High employment level and economic growth).
The authors of the present article propose to substitute so-called “Magic Square” with the “Magic Pentagon” and for this purpose use correlation and regression analyses of the indicators in the period since Georgia became independent, determining the gap between the results of the analysis and the expected macroeconomic indicators. To illustrate this, the results of the empirical study of macroeconomic uncertainty are gained, and the relevant parameters are identified. The article proposes the outlines of a future model of country development by considering the factor of macroeconomic uncertainty.
2. Review of theory and literature
So, what is the right term to use: macroeconomic uncertainty, inconsistency, disparity, ambiguity, incompatibility, or, perhaps, inconsistency? Indeed, there are no clear definitions, but all these terms have a common essence describing an imbalance in the macroeconomic development.
It is noteworthy that in academic literature, the number of the scientific papers dedicated to “uncertainty” in the total number of publications is steadily increasing, evidencing the relevance of the issue. However, the results of calculation of the relative values of publications on “uncertainty” in the field of economic sciences show a clear slowdown in the study of uncertainty. The said value decreased from 28.8% in 1991 to 15.7% in 2011 (Baker, Bloom, Davis, 2016). The situation regarding the publications on the problem of uncertainty clearly changed. Specifically, we see a sharp increase in the number of such publications following the spread of COVID-19.
The publications dedicated to the risks and uncertainty in Georgia are mainly discussed at a micro level. The topics of their study are devoted to the issues of strategy and tactics of businessmen’s behavior in terms of economic uncertainty, and both, probabilistic and statistical study methods and mathematical models of risk and default management are proposed for this purpose. The recent studies in the world show the dynamics of change of the level of economic uncertainty. The levels of macroeconomic and microeconomic uncertainty increase sharply in terms of recession and decrease during the boom. Besides, developing countries typically have higher index of uncertainty as compared to the developed countries (Bloom, 2014).
“Although the last 10 years were marked by an impressive progress in the ‘fluctuations’ study of uncertainty variability, the phenomenon of uncertainty still remains largely uncertain. The empirical literature on uncertainty is still at an early stage of development and there are still many open issues. First, the cause-and-effect relationships between the uncertainty and the economic growth are not explained to date. In this sense, the new works using natural experiments and structural models would be useful.” (Bloom, 2014).
The hypotheses about the transformation of uncertainty, as well as the views on the relationship between the risk and the uncertainty, are given and substantiated in the organizational-economic systems (Kuzmin,2012).
Uncertainly is measured with the methodology to construe uncertainty developed based on the joint work by Scott Baker, Nicholas Bloom and Steven Davis. The authors use the analysis of the publications related to the given topic from different countries with the concept of frequency.
The issues related to the problem of uncertainty are also highlighted by such authors as Bloom, Baker, Davis (2015);Kuzmin (2012); Frydman, Johansen, Rahbek, Tabor (2019).
3. Macroeconomic uncertainty and the theoretical-methodological aspects of modernizing its evaluation
Recognized scholars are in permanent pursuit of the right type of economic development agenda to offer countries. As a result of such attempts, they developed the concept of sustainable economic development, which, with its content, implies a universally recognized question – so, will we be able to leave our future generations the same supply of resources we are using today? Social progress, ecological background, and economic growth are all recognized components of sustainable economic development. By the joint efforts of the scientists, national governments, and international organizations, the UNO has adopted the Agenda 2030 for Sustainable Development Goals, which, with their content and complex nature, are of paramount importance. In realizing such important goals, the factor of economic uncertainty is considered, which is strong in countries all over the world. Today, the traditional set of economic uncertainty has been aggravated by a completely novel, previously unknown trend – the global pandemic resulting from COVID-19, which has caused a new economic crisis. The peculiarity of this crisis is that it originated not in the field of economics but in medicine, and it is called CoroEconomics (Papava, 2020). Still, what is uncertainty? As per the paradigm agreed among the world scientists, it is a gap between an expected condition and an actual development of the economic-organizational system (Bloom, 2014).
Let us try to highlight the phenomenon of macroeconomic uncertainty on the example of the period in Georgia since the country gained its independence. The national economy of Georgia, with its protracted transitional period, is facing global and local challenges. After 30 years since gaining its political independence, the country has not yet reached the level of economic development it had in 1990. Following the swift economic decline, the annual economic growth is about 3% on average. Unfortunately, the rate of employment not only fails to keep pace with the rate of the economic growth, but on the contrary, keeps declining. In foreign trade turnover, domestic production was substituted by imported goods and services. In such unfavorable macroeconomic terms, rather low inflation rates raise a number of questions not only among the population, but among the branch specialists as well. In short, now, we have a problem of ignoring the requirements of the macroeconomic “Magic Square” of the country’s economic development, as the following macroeconomic parameters viewed as the sides of the Square: “the GDP, employment, foreign trade balance and inflation” must stimulate the development of each other and together they must stimulate a stable economic growth of the country, which today is far from being desirable.
To evaluate the factor of uncertainty at the macroeconomic level of the country, we propose substituting the so-called “Magic Square” with a “Magic Pentagon”, when we add the fifth indicator to the above-listed ones, which is foreign investment in the country. Why did we choose the “Magic Pentagon” in our attempts to search the right definition and to give the quantitative assessment of uncertainty? First, the concept of the “Magic Square” has not lost its relevance, and with its modernization, i.e., with a novel proposal to the concept of economic uncertainty by introducing a fifth parameter and the elaboration of the theoretical-methodological problems of its quantitative assessment, we aim to set grounds for a new impulse to strengthen the role of the state in the regulation of its economic system. The fifth parameter, foreign investments, is an essential component for developing economies.
The description of the sides of the “Magic Pentagon” is as follows:
1. Employment;
2. Inflation;
3. Investments;
4. Goods import coverage by exports;
5. GDP.
Let us consider the parameters of the sides of the macroeconomic Magic Pentagon (1, 2, 3, 4) as independent variables, and let us consider the fifth parameter, the gross domestic product, as a dependent or result variable.
How to measure macroeconomic uncertainty?
• Let us use the following formula to explain the relationship between the events:
Y = f(x1, x2, x3, x4) (1)
• Let us calculate coefficient R.
• Let us subtract the multiple correlation coefficient from 1, as from the highest level of density of the events. As a result, we will gain an index of imbalance of the sides of the macroeconomic situation. The relevant formula will be as follows:
D = (1 – R), (2)
where:
D is the index of imbalance of the sides of the macroeconomic situation; and
R is the multiple correlation coefficient;
• Thereafter we obtain the value of macroeconomic uncertainty:
Z =(D1 – D0) (3)
4. Results of the empirical study to assess macroeconomic
uncertainty in Georgia
Thus, following the changes of the so-called “Magic Pentagon” in the country, let us calculate the correlation. As it is known, a statistical model of regression (correlation between the macroeconomic indices of the country) is expressed with the following formula (function):
YX = f(x1, x2, x3, x4)
In our case, x1, x2, x3, x4 are independent, or factorial signs, and Y is a result sign.
The macroeconomic indicators of 2010-2019 characterizing the sides of the Magic Pentagon are given in the Table below.
Table N1. Principal macro-indices of the country in 2010-2019.
|
GDP in stable 2015 prices (US Dollars) (y) |
Employment (X1) |
Inflation (X2) |
Direct foreign investments in Georgia (US Dollars) (X3) |
Import coverage by exports ratio (X4) |
|
|
2010 |
14944.76 |
1.627849 |
1.112 |
865.6377 |
0.319 |
|
2011 |
16963.74 |
1.643466 |
1.02 |
1133.971 |
0.31 |
|
2012 |
18432.51 |
1.659425 |
0.986 |
1048.227 |
0.303 |
|
2013 |
18959.37 |
1.643402 |
1.024 |
1039.174 |
0.369 |
|
2014 |
18652.76 |
1.694412 |
1.02 |
1836.98 |
0.333 |
|
2015 |
14948.17 |
1.733806 |
1.049 |
1729.088 |
0.285 |
|
2016 |
14755.09 |
1.717286 |
1.018 |
1650.328 |
0.29 |
|
2017 |
14594.57 |
1.706641 |
1.067 |
1962.613 |
0.345 |
|
2018 |
15144.95 |
1.694202 |
1.015 |
1265.236 |
0.369 |
|
2019 |
14316.87 |
1.69017 |
1.069967 |
1267.724 |
0.354 |
We will obtain the following equation following the regressive analysis based on the above-listed macro-indicators:
Y = 142008.0381 – 55676.8308X1 – 35910.3987X2 + 3.0787X3 + 2410.012X4
By using the equation above, we can obtain the following results. The economic interpretation of the model is as follows:
X1 (Employment), which, if added 1, results in a decrease of value Y (GDP) by 55676,831 on average.
X2 (Inflation), which, if added 1, results in a decrease of value Y (GDP) by 35910.399 on average.
X3 (Direct foreign investments), which, if added 1, results in a decrease of value Y (GDP) by 3079 on average.
X4 (Import coverage by exports), which, if added 1, results in a decrease of value Y(GDP) by 2410.012 on average.
Before calculating the multiple correlation coefficient, let us draw matrix R of matching correlation coefficient, which is as follows:
Table N2. Matrix of matching correlation coefficient.
|
- |
y |
x1 |
x2 |
x3 |
x4 |
|
y |
1 |
-0.4542 |
-0.6065 |
-0.2371 |
0.1074 |
|
x1 |
-0.4542 |
1 |
-0.1086 |
0.8453 |
-0.2236 |
|
x2 |
-0.6065 |
-0.1086 |
1 |
-0.04346 |
0.09458 |
|
x3 |
-0.2371 |
0.8453 |
-0.04346 |
1 |
-0.162 |
|
x4 |
0.1074 |
-0.2236 |
0.09458 |
-0.162 |
1 |
As the data given in the table show, all matching coefficients show correlation.
The next step is to consider the partial correlation coefficients. As we remember, a partial correlation coefficient differs from a simple matching coefficient in that it measures the pair correlation of the relevant signs (X and Y) assuming that the influence of other factors (X) is excluded.
Based on the partial correlation coefficients, we can make a conclusion about the relevance of introducing variables to the regressive model, i.e., the options when the association between the given factor and the result variable is very weak or is absent. In such a case, the said factor may be excluded from the model.
So, what are the results of our study? The associations have been found in each case of correlation despite the fact that the relevant coefficients are sometimes strong, sometimes moderate, and sometimes weak.
Now, let us calculate multiple correlation coefficient, which characterizes the joint impact of the macroeconomic factors on the dependant result factor.
When the correlation coefficient (R) is close to 1, the regression equation characterizes the factual data and the factors intensely influence the result. If R value is close to 0, the regression equation poorly describes the factual data and the influence of the independent factors on the result factor is weak.
Thus: 1
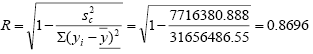
The multiple correlation coefficient can be determined from the matrix of matching correlation coefficients:

Where: Δr determines the matching correlation coefficient; and
Δr11 determines the matrixes of interfactorial correlation.
| Δr = | 1 | -0,454 | -0,607 | -0,237 | 0,107 | = 0.0643 |
| -0,454 | 1 | -0,109 | 0,845 | -0,224 | ||
| -0,607 | -0,109 | 1 | -0,0435 | 0,0946 | ||
| -0,237 | 0,845 | -0,0435 | 1 | -0,162 | ||
| 0,107 | -0,224 | 0,0946 | -0,162 | 1 |
| Δr11 = | 1 | -0,109 | 0,845 | -0,224 | = 0.264 |
| -0,109 | 1 | -0,0435 | 0,0946 | ||
| 0,845 | -0,0435 | 1 | -0,162 | ||
| -0,224 | 0,0946 | -0,162 | 1 |
Thus, multiple correlation coefficient equals are
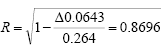
Showing a strong density of the cause-and-effect coefficients.
Determination coefficient: R2 = 0.756.
We checked the value of the statistical value of the regression equation by means of the determination coefficient and Fisher criterion. Following the maximum coefficient β=0,629, we can conclude that maximum influence on the result value of y is yielded by factor X3 which, among other things, justifies our choice to introduce the so-called Magic Pentagon as a fifth side (foreign investments in the country).
Following the calculation of the multiple correlation coefficient, let us calculate the macroeconomic imbalance index in the country:
D = (1 – R)=(1 – 0,8696) = 0,1304
Index of macroeconomic uncertainty: Z = (D1 – D0);
Where: Z is the index of macroeconomic uncertainty;
D0 is the current index of macroeconomic imbalance; and
D1 is the gap between the current and the expected indices of macroeconomic imbalance. The assessment of the latter was impossible to provide owing to the unexpected and mass propagation of COVID-19. However, the prognostic value of GDP fell in 2020 and is assumed to be approximately 5% by the World Bank experts. Finally, it is necessary to introduce index e in the prognostic model of the macroeconomic uncertainty imbalance as follows:
Z = (D1 – D0) + e, (4)
Despite the fact that the values of economic uncertainty are more or less implied in values D1 and D0, parameter e of the proposed model considers the factors of COVID-19, earthquakes, floods, mudflows and other unforeseen events.
Conclusion
The given article considers the issues to possibly reflect the definition of macroeconomic uncertainty proposed by the authors of the article, its quantitative assessment and the given phenomenon in the model of future macroeconomic development of the country. In relation to the given problems, theoretical and methodological problems are suggested, which are explained and consolidated by the empirical studies accomplished based on the data characterizing the macroeconomic situation in Georgia.
We think that the discussion, to be held again future in the future, about the problems and relevant solutions considered in the present scientific paper will be useful for the representatives of agencies as well as scientific and academic circles of different countries engaged in developing the macroeconomic policy.
References:
Baker S.R., Bloom N., Davis S.J. (2015). Measuring Economic Policy Uncertainty. National Bureau Of Economic Research, Working Paper 21633, URL: https://www.nber.org/papers/w21633
Bedford T., Cooke R.T. (2001). Probabilistic Risk Analysis: Foundations and Methods. Cambridge University Press, 414 p.
Bloom N. (2014). Fluctuations in Uncertainty. Journal of Economic Perspectives, Vol. 28, No. 2, p. 153–176.
Frydman R., Johansen S., Rahbek A., Tabor M.N. (2019). The Knightian Uncertainty Hyphotesis: Unforeseeable Change and Muth’s Consistency Constraint in Modeling Aggregate Outcomes, 55 p., https://dx.doi.org/10.2139/ssrn.3341203
Gabidzashvili B., Kbiladze D. (2010). Tactics and strategy of businessmen behavior in terms of economic uncertainty. Tbilisi: Publishing house “Universali”.
Jaeger C.C., Webler T., Rosa E.A., Renn O. (2001). Risk, Uncertainty, and rational action. Earthscan, 320 p.
Кuzmin E.A. (2012). Uncertainty in the economy: concepts and provisions, Management Issues, Vol. 04 (21), URL: http://journal-management.com/en/issue/2012/04/10
Oxelheim L., Wihlborg C. (2008). Corporate Decision-Making with Macroeconomic Uncertainty: Performance and Risk Management. Oxford: Oxford University Press, 244 p.
Papava V. (2020). Coronomics and Qualitatively New Economic Crisis. Journal Economics and Business, Vol. 12, No. 2, p. 13–16.
Pergler M., Lamarre E. (2009). Upgrading your risk assessment for uncertain times. McKinsey Working Papers on Risk, McKinsey&Company. Vol. 9.
Smith N.J. (2003). Appraisal, risk and uncertainty. Thomas Telford, 132 р.
Tapman L.N. (2002). Risks in the economy: a coursebook foruniversities / Ed. by prof. V.A. Shvandar. M.: UNITY-DANA, 380 p.
Thunnisen D.P. (2005). Propagating and Mitigating Uncertainty in the Design of Complex Multidisciplinary Systems (PhD Thesis). California Institute of Technology Pasadena, California.
Walker W.E., Harremoes P., Rotmans J., J.P. van der Sluijs, M.B.A. van Asselt, Janssen P., Krayer von Krauss M.P. (2003). Defining Uncertainty. A Conceptual Basis for Uncertainty Management in Model-Based Decision Support. Journal of Integrated Assessment, Vol. 4, issue 1, p. 5–17, https://doi.org/10.1076/iaij.4.1.5.16466