Ekonomika ISSN 1392-1258 eISSN 2424-6166
2021, vol. 100(1), pp. 75–93 DOI: https://doi.org/10.15388/Ekon.2021.1.5
Alcohol Availability Restriction Policy and Changes in Consumer Behavior in Lithuania in 2016–2019
Vita Karpuškienė
Faculty of Economics and Business Administration, Vilnius University, Lithuania
Email: vita.karpuskiene@evaf.vu.lt
Abstract. To reduce alcohol consumption, in 2018 the Lithuanian Government introduced new restrictions on alcohol sales time, consumer age, and alcohol advertising. These restrictions apply to the entire population, regardless of alcohol consumption behavior. Such actions of the government were provoked by the scale of the problem; according to the data provided by the World Health Organization and the European Union Commission, Lithuania sits among the leading countries in alcohol consumption.
The policies taken by the government to reduce alcohol consumption are described by many economists as paternalistic, as they reduce an individual’s freedom of decision. The aim of this paper is to evaluate the changes in alcohol consumption behavior after the regulatory measures entered into force and the public attitude towards these measures based on research results.
This article presents the results of a study first conducted in December 2016 by the researchers of the Faculty of Economics of Vilnius University and the representatives of the Lithuanian Business Confederation*. The aim of the study was to distinguish the different groups of alcohol consumers and their alcohol consumption behavior and attitudes towards the alcohol restriction policies.** To achieve this aim, an analysis of scientific papers, a population survey, and statistical analysis methods were used.
The authors conclude that alcohol restriction policies, met with a relatively favorable public attitude, may have adjusted levels of alcohol consumption and its patterns, but the increase in the number of young people among alcohol consumers is not in line with the expected policy outcomes. The measures adopted did not encourage respondents to give up alcohol in the longer term (12 months).
Keywords: paternalism, standard unit of alcohol, low risk, binge drinking, severe drinking episodes.
_______
* The research is financed by Lithuanian business Confederation.
** The results of the 2016 study are presented in: Karpuškienė, V., Rastenienė, A., & Liepuonius, A. (2019). “Alkoholio vartojimo įpročiai, aplinka ir pasekmės Lietuvoje.” Socialinė Teorija, Empirija, Politika ir praktika, 18, 59–73. https://doi.org/10.15388/stepp.2019.4
Received: 23/09/2020. Revised: 03/12/2020. Accepted: 18/01/2021
Copyright © 2021 Vita Karpuškienė. Published by Vilnius University Press
This is an Open Access article distributed under the terms of the Creative Commons Attribution License, which permits unrestricted use, distribution, and reproduction in any medium, provided the original author and source are credited.
Introduction
Behavioral economics have provided new public policies and interpretations over the past thirty years. While in the past many economists recognized public policy as necessary to regulate or address “market failures” (supply of public goods, regulation of externalities, imperfection of information), nowadays it has become more important to emphasize the individual decision-making process.
Paternalistic state policies designed to protect the society from harmful habits or social policies are used in many countries and receive much attention. Studied are devoted to find out both the paternalistic nature of these policies and the effectiveness of their use.
The Lithuanian government pays a lot of attention to reducing alcohol consumption and pursues an active policy of cutting down alcohol accessibility. Since 1995, the government has been regulating alcohol trade by reducing alcohol advertising and availability. In the summer of 2017, the Seimas approved new amendments to the Law on Alcohol Control, which came into effect beginning with the year 2018 and stated that persons under the age of 20 will not be able to purchase, possess, or consume alcoholic beverages. The sales time for alcoholic beverages was also reduced on weekdays and Saturdays from 10 am to 8 pm, and on Sundays from 10 am to 3 pm; alcohol advertising was completely banned. The sale and consumption of alcohol was declared prohibited during sport events in the premises where they take place.
In addition, from January 1, 2020, an outdoor alcohol retail establishment was only permitted within a 40-meter radius from a stationary catering establishment, whereas trade in pavilions and other non-stationary places and beaches was prohibited. According to the government, these provisions, which are based on restrictions and prohibitions, would be complemented by measures and initiatives aimed at changing consumer behavior and motivation.
The new alcohol restrictions adopted are the measures most often recommended by international organizations for all countries. However, they may not be as effective in different countries and among different groups of consumers. The goal of the policy pursued by the Lithuanian Government, which can be judged from the range of measures and the declared goal, is to reduce the amount of alcohol consumption in Lithuania.
This article aims to evaluate the changes in alcohol consumption behavior after the entry into force of regulatory measures and the public attitude towards these measures based on the results of a study conducted in the years 2016–2019 by researchers from the Faculty of Economics of Vilnius University and representatives of the Lithuanian Business Confederation.
This paper focuses aims the following objectives: to analyze the research published by scholars evaluating the effectiveness of paternalistic policy and to identify changes in alcohol consumption habits and behavior based on the results of surveys conducted in Lithuania in 2016–2019.
As it was mentioned in a paper previously written by the authors (Karpuškienė, Rastenienė, Liepuonius, 2019), the results of the population survey do not allow for a reliable estimation of alcohol consumption but can be used to analyze the change of frequency and habits of alcohol consumption in certain groups of the citizens. These indicators will allow us to draw the conclusions about changes in alcohol consumption behavior.
Several methods were used in the article: analysis of scientific articles, population survey, and statistical analysis methods.
1. Evaluation of the effectiveness of paternalistic policies
The study performed in 2017 by the Free Market Institute (Nutritional Paternalism, 2017) examined the impact of imposed taxation on unhealthy foods (sugar, salt, carbonated beverages, fatty foods) and made a conclusion that “[t]he policy of nutritional paternalism had a limited impact and did not produce the expected results [and] rather caused additional negative consequences.” As the examined tax policy cases are aimed at combating obesity-promoting foods, it is concluded that the ultimate goal was either not achieved or had little effect based on the measures used.
In 2019, the study conducted by the Free Market Institute examined the current Lithuanian policy on its regulation of beverages, tobacco, and nutrition. The authors concluded that “strict paternalistic policies have a limited impact but can have a variety of negative consequences, so implementation should be very responsible – new regulations need to be assessed on the basis of thorough examination of the regulations in force” (Increasingly Tighter Paternalistic Control, 2019). However, at the beginning of the study, the authors made it clear that they do not aim to assess the impact of policies but rather recommend that cutting down on alcohol and tobacco control could reduce the negative consequences, as well as educating the population and cultivating a culture of responsible consumption. This view is also shared by Friedman (2013). In the abovementioned publications, paternalistic policies aimed at influencing the decisions of individuals are presented as an ineffective tool.
To assess the effectiveness of paternalistic politics, it is important to clearly define their purpose, as many scholars argue (John, 2018; Anker, 2016; Clarke, 2008; Thomas & Buckmaster, 2010, etc.) John (2018) claims that (regarding the issue of alcohol taxation) it is not possible to divide individuals into “responsible” and “irresponsible” users because such descriptions are inaccurate. Clarke (2008) argues that paternalistic policies for restricting alcohol consumption should aim at reaching the individuals who drink heavily or are most affected by their drinking habits (e.g., the young drinkers or those suffering from addiction). Anker (2016) emphasizes that clear goals that can be measured should be set to prove that policies have become the cause of behavior change.
According to Friedman (2013), public support and its tolerance for state intervention in the process of individual autonomous decision-making are very important for achieving the goal of a paternalistic policy. His paper analyzes the reasons why paternalistic measures applied to reduce obesity in the U.S. were ineffective. Disagreeing with Friedman’s interpretation of the public’s negative attitude towards the law on obesity regulations on whether they meet the needs of the population to protect them from obesity or whether these regulations are paternalistic, Parmet (2014) supports the idea that effectiveness depends on the public’s attitudes towards the politicies. In trying to assess the impact of paternalistic politics, one faces the problem of how to assess their impact on an individual’s decision-making process. Therefore, most studies atempting to assess the results of paternalistic policies use methods of surveys and statistical analysis.
Thomas & Buckmaster (2010) observe that paternalistic measures should be effective in the present and increase an individual’s ability to make appropriate decisions in the future on their own (Thomas & Buckmaster, 2010). Talking about the indicators (evidence) that would allow the impact of the policy to be assessed, they state that one of such paternalistic policies to have proved its efficacy is the tobacco control policy, which has clearly demonstrated, at least in terms of health indicators, that it is effective; its benefits outweigh the potential harm to an individual’s right to make an independent decision.
For other paternalism policies, the issue of harm and benefit is crucial. Based on Andrew Leigh (2009) argues that assessing the effectiveness of policies would be worthwhile using the following methods of hierarchy, as presented below.
1. Systematic reviews of several randomized sample surveys.
2. High-quality, randomized sample surveys.
3. Systematic reviews of natural experiments before and after policy.
4. Natural experiments utilizing differences-in-differences and regression methods.
5. Before – after studies.
6. Expert opinions and theoretical assumptions.
One of the problems in using this hierarchy of studies is the availability of reliable data. This is emphasized by Anker (2016), linking the policy objective and the possibility of assessing its impact (the mentioned paper analyzes an article on the effectiveness of the Australian plain tobacco packaging measures). The author emphasizes that the following two aspects are necessary: causal efficacy and avoidance of negative side effects.
Empirical or inferred data can be used to demonstrate causal efficacy. Empirical data obtained by individuals themselves or their relatives assessing changes in smoking habits or randomized controlled research encounter the issues of reliability. Concerning the findings, Anker believes in research outcomes made by other sciences (social psychology and healthy behavior), albeit they also possess reliability issues.
Clarke (2008) presents an economic approach to evaluating state interventions to reduce alcohol consumption.
From an economic point of view, Clarke classifies measures according to the causes (market failures: imperfect information, lack of self-control, external costs) related to alcohol problems and proposes measures accordingly (restriction of advertising, adequate interpretation of the negative effects of alcohol consumption, etc.; helping the individual to understand, acknowledge the problem; limit sales time and age of buyers; taxes to offset the external costs of alcohol consumption). The abovesaid proves that the effectiveness of such measures should also be assessed on the basis of indicators that reflect the size of the problem, which again encounters the problem of data reliability (specifically in how should the improvement of self-control be assessed).
And yet, the authors of numerous papers assessing changes in alcohol (and other addictive substance) consumption habits associated with one or another state intervention factor (Rehm, 2014; Arm et al., 2018; Livingston et al., 2018; Toumbourou et al., 2018; Raitasalo et al., 2018) base their research on population surveys.
2. Reaserch method
The Law on Alcohol Control of the Republic of Lithuania states the following goal: “To reduce the general consumption of alcohol, its availability, especially for minors, alcohol abuse, its damage to health and the economy, to establish the legal bases for granting the right to produce, sell, import, import and export alcohol products regulated by this Law to economic entities.” (Law on Alcohol, 2020).
The declared aim is very broad and encompasses all citizens, although by emphasizing minors it also touches upon many other aspects. Although the indicators of the purpose of the law can be largely measurable, they depend on the understanding about the damage that alcohol abuse has on public health and the economy. Without pretending to assess all indicators, we focus our research on the attitudes of the population towards policy measures and changes in their alcohol consumption behavior. This decision is driven by the statement of Thomas & Buckmaster (2010) that intervention policies should increase an individual’s ability to make appropriate decisions in the future independently and, thereby, to ensure a sustainable policy outcome. For this purpose, as it was mentioned by most authors, the survey method is used.
Researchers from the Faculty of Economics and Business Administration of Vilnius University, together with representatives of the Lithuanian Business Confederation, conducted four annual surveys examining alcohol consumption habits in Lithuania. The first study was conducted in 2016. For this study, a questionnaire on alcohol consumption habits was developed and a survey was conducted. In 2018, with the adoption of additional alcohol control measures, the initial questionnaire was supplemented with questions that reveal respondents’ attitudes and behavioral changes due to the introduction of these measures. All four surveys were conducted by the joint Lithuanian-British public opinion and market research company Baltijos Tyrimai. All surveys are representative national surveys of the Lithuanian population based on the questionnaire of the population’s alcohol consumption habits and environment. The number of respondents in all surveys exceeded 1100.
During the survey conducted from November to December 2019, 1104 Lithuanian residents were interviewed at 122 polling places. The results of the study reflect the behavior and attitudes of the Lithuanian population aged 15 and over; they can be assessed in different sections, according to gender, age, education, and type of settlement. The error of the results for a sample of this size usually deviates by 3%.
Selection of respondents: random route according to the birthday rule. Survey method: personal interview at the respondent’s home.
Table 1. Number of survey respondents
|
2016 |
2017 |
2018 |
2019 |
|
|
Number of respondents |
1101 |
1120 |
1012 |
1104 |
The studies examined the following aspects of alcohol consumption behavior as presented below.
1. Types, frequency, and quantities of beverages consumed. To ensure the accuracy of the information, the frequency of consumption was assessed by asking questions about consumption in the last 12 months, and when analyzing the amounts of alcohol consumed, the questions were formulated about the amounts of alcohol consumed in the last week before the survey.
2. Consumption environment and participants.
3. Opinion on the introduced alcohol control measures and the resulting changes in behavior.
The object of the research are the groups of alcohol consumers and the peculiarities of their alcohol consumption.
This paper presents the results of a study that covers the following aspects of alcohol consumption: 1) habits and frequency of alcohol consumption; 2) consumption environment; 3) opinion on the introduced alcohol control measures.
3. Results and discussion
3.1. Changes in alcohol cunsumption behavior in 2016–2020
To assess support for ongoing measures to limit alcohol consumption, respondents were asked to rate each of them positively, neutrally, or negatively – see Table 2.
In general, all respondents view restrictions on the sale and advertising of alcohol more positively than negatively, with the exception of the increase in excise duty, and this attitude remains. The similar results were published by Spinter, who conducted a population survey in 2020 in February. Respondents were more positive than negative about policies restricting alcohol consumption, most in favor of the age restriction ( 67%) and banning advertising (62%) (Tabako, 2020).
The introduction of an age limit was the most supported and the increase in excise duty was the most negative, although in 2019 the number of those who thought so decreased from 38% (according to 2018 results) to 32%; the second measure, assessed negatively, is the time limit for the sale of alcoholic beverages. In assessing the answers of the respondents by consumer groups, the general tendencies remain unchanged, but the groups of regular drinkers and binge drinkers are found to be more negative about the introduction of all measures; drinkers are equally negative regarding the time limits for selling alcoholic beverages (67% in 2018, 63% in 2019) and the increase in excise duties (79% in 2018 and 68% in 2019). The number of those who gave neutral evaluations increased in the group of regular alcohol users, while the neutral evaluation among binge drinkers increased (28% in 2018, 49% in 2019) and the negative evaluation concerning age restrictions decreased (37% in 2018, 18% in 2019).
Table 2. How do you assess these restrictions on alcohol sales and advertising? (% of respondents).
|
2018 |
2019 |
|
|
Age restriction |
||
|
Positively |
61 |
60 |
|
Neutrally |
24 |
27 |
|
Negatively |
12 |
10 |
|
Advertising ban on alcohol |
||
|
Positively |
44 |
44 |
|
Neutrally |
38 |
39 |
|
Negatively |
15 |
14 |
|
Sales time limitation |
||
|
Positively |
39 |
40 |
|
Neutrally |
33 |
31 |
|
Negatively |
25 |
26 |
|
Excise duty increase |
||
|
Positively |
27 |
30 |
|
Neutrally |
32 |
35 |
|
Negatively |
38 |
32 |
As it was mentioned in the beginning of the article, the impact of paternalistic measures on the decision-making process of citizens depends on the clarity of the aims and favorable attitude towards the executive policy. The results obtained showed that, in general, respondents view policies restricting the availability of alcohol more positively than negatively.
3.2. Quantities And Frequency Of Consumption
Participants of the study were asked about the frequency of their alcohol consumption during the last 12 months. The scoreboard for the period 2016–2019 is presented in the table below.
Table 3. Alcohol consumption in the last 12 months (%)
|
2016 |
2017 |
2018 |
2019 |
|
|
Having consumed (%) |
57 |
60 |
65 |
64 |
|
Not consumed (%) |
41 |
37 |
32 |
34 |
|
No response (%) |
2 |
3 |
2 |
2 |
In 2016 and 2017, less than two thirds of the respondents had consumed alcoholic beverages, whereas in 2018 and 2019, the share of these individuals approached two thirds; meanwhile, the proportion of people who did not drink alcohol fell from 41% in four years to 34%.
Table 4 presents data on the frequency of alcohol consumption in 2016–2019.
Table 4. Consumption of alcoholic beverages in the last 12 months (%)
|
2016 |
2017 |
2018 |
2019 |
|
|
Daily |
4 |
3 |
2 |
3 |
|
2-4 per week |
10 |
6 |
7 |
7 |
|
1 time per week |
17 |
17 |
17 |
15 |
|
Altogether: every week |
31 |
26 |
26 |
25 |
|
2-3 times per month |
23 |
20 |
25 |
29 |
|
1 time per month |
17 |
22 |
19 |
19 |
|
Altogether: 1 or 2 times per month |
40 |
42 |
44 |
48 |
|
Several times per year |
25 |
30 |
27 |
26 |
|
No response |
4 |
2 |
2 |
1 |
Comparing the data of different years, it is observed that in 2017, the number of drinkers decreased each week, but in the following years, after this one-off jump, this share among all drinkers stabilized at 25–26%.
Looking at the results of the survey, it can be stated that from year 2017, the proportion of people who drank daily and several times a week had decreased.
In parallel, the proportion of people consuming alcoholic beverages once or several times a month had increased; it grew from 40% in 2016 to 48% in 2019; almost half of the respondents consume alcohol once or several times a month.
The group who drink only during the holidays remains stable and makes up about 26–30% of the respondents.
Table 5. Heavy drinking episodes
|
2017 |
2018 |
2019 |
|
|
Daily |
1 |
1 |
0.2 |
|
2–4 times per week |
2 |
2 |
2.2 |
|
1 time per week |
2 |
3 |
2.7 |
|
2–3 times per month |
4 |
7 |
3.1 |
|
1 time per month |
11 |
11 |
8.5 |
|
Several times per year (celebrations, birthdays) |
39 |
36 |
32 |
|
Never |
38 |
38 |
48 |
Heavy drinking is characterized by a habit of consuming 6 or more standard units of alcohol (10 ml of pure alcohol) on a single occasion. Looking at the proportions of all people who had consumed alcohol in the last 12 months, it can be seen that in 2019 the proportion of individuals who did not have any more heavy drinking episodes increased sharply, and almost all other frequency categories of alcohol consumption decreased.
The only frequency categories in which relative consistency is observed are those pertaining to drinking episodes occurring 2–4 times per week and once per week.
3.3. Alcohol Consumer Groups
In order to distinguish drinking habits in detail, all drinkers were divided into three groups depending on the frequency of drinking and the amount consumed during the week: binge drinkers, regular drinkers, occasional drinkers, and non-drinkers.
Although these categories may overlap, they can still be characterized by certain distinctive features. The group of binge drinkers included individuals who frequently and heavily consumed alcohol and who drank daily or 2–4 times a week and drank 20 or more contractual units of alcoholic beverages, i.e., more than 200 grams of pure alcohol per week.
The group of regular drinkers consists of persons who consume alcohol every week and drink 10–19 units of contractual alcoholic beverages. There are individuals in this group who drink often but not abundantly.
Occasional drinkers are those respondents who consume alcoholic beverages once a month or less.
Table 6. Distribution of respondents by groups (%)
|
Groups |
2016 |
2017 |
2018 |
2019 |
|
Binge drinkers |
6 |
4 |
5 |
5 |
|
Regular drinkers |
8 |
8 |
10 |
7 |
|
Occasional drinkers |
44 |
48 |
50 |
52 |
|
Non-drinkers |
41 |
37 |
32 |
34 |
|
No response |
2 |
3 |
2 |
2 |
Among all respondents, the binge drinkers’ group is the least numerous and accounts for about 5% of all respondents, while regular drinkers tend to fluctuate slightly: although in 2018 the share of these individuals increased from 8% to 10%, it dropped to 7% in 2019.
Taking these groups together, we could observe a decrease in the relative share of these persons in 2017, from 14% down to 12%; in 2018, it had increased to 15% and it shrunk to 12% in 2019. Therefore, the relative share of these groups seems to be more or less constant. The group of occasional drinkers increased by 4 and 2% annually and in 2019 it accounted for more than half of all respondents, whereas the non-consumers’ group decreases gradually.
3.4. Socio-demographic portraits of groups
The 2019 survey shows that 5% of respondents who consumed alcoholic beverages in the last 12 months fell into the group of binge drinkers. This group consists mainly of men – about 90% of all members of this group. About a third (~ 31%) of them are 60 years of age and older. Respondents of active working age (30–60) make up 48% of this group; young people (persons aged 15–30) make up about 21%.
Among the respondents of this group, 59% are rural residents, 22% live in major cities, and the remaining 19% live in smaller cities. The majority of respondents (75%) have a secondary education or have not completed it; about 7% of respondents have completed post-secondary or higher education. More than half of this group of respondents do not work: 34% are unemployed and 20% are retirees. Some respondents in this group perform manual labor or are employed at farms. Based on marital status, 45% of the respondents are married or living with a partner and 55% are single (unmarried, divorced, widowed). Almost half of the respondents in this group have a monthly income of less than € 400 per person. The majority of respondents (54%) describe their financial situation as poor, and only 7 % as good.
Respondents of working age of 30 to 60 years old make up the majority of this group (as much as 75%). Young people under the age of 29 make up a minority of 7%, and those over the age of 60 make up 18%. A classification by place of residence reveals that the rural population makes up 43% of all respondents, the city population – 35%, and citizens of smaller cities – 22% of the respondents. Of all respondents, 34% have either post-secondary or higher education; most members of this group are employed. About a quarter work as specialists or in managerial positions, while 10% are unemployed and 13% are retirees. Most of them are married (60%) or have a partner (17%), 10% are unmarried, and 8% are divorced. The income in this group is higher than average, and therefore they assess their financial situation more favorably: half of the respondents describe it as average and 14% as good. The largest number of respondents (52%) belong to the group of occasional drinkers; of these, women make up the majority (56%). These are respondents of very different ages, among whom 47% live in major cities, while the share of the rural population is 26%. This is the most educated group of respondents: as many as 52% of individuals have higher or post-graduate education. Most of the working age representatives in this group are employed, while 5% are jobless or housewives, 5% are schoolchildren, and 19% are retirees. Thirty-five percent of the respondents work as specialists or managers. Most of them are married (57%) or have a partner (14%). The income of this group is higher than average; therefore, they also evaluate their financial situation as the most favorable of all groups: 50% describe it as average and 22% as good.
The non-drinking group comprises 36% of all respondents. This group is dominated by women, who make up its two-thirds (66%). Two age groups stand out among the respondents: young people under 30 (34%) and residents over 60 (50%). As might be expected, there is a significant proportion (22%) of high school and university students in this group who are pursuing an academic or school degree and have not yet completed secondary or higher education. Retirees make up 38% of this group. Due to the specific age structure, there is a large share of unemployed people in the non-drinking group (67%). The number of who are of working age but unemployed is low, around 7%. Marital status in this group varies: 43% of respondents are married or live with a partner. Due to the large number of older (60+) respondents, there is a significant share of widows in this group (19%). The income of this group of respondents per person is relatively low: up to 400 Euros per month for 34% of respondents, and over 550 Euros for 10% of the respondents. A large proportion of respondents (35%) refused to indicate their income; 32% describe their financial situation as bad, 48% as average, and 12% as good.
Table 7. Demographic portrait of the group of alcohol consumers
|
2016 |
2017 |
2018 |
2019 |
|
|
Men/women |
90/10 |
87/13 |
92/8 |
90/10 |
|
Age 15–29/30–49/50+ |
10/45/45 |
10/41/49 |
15/38/47 |
21/32/47 |
|
Retiree/unemployed |
15/26 |
17/35 |
14/33 |
20/34 |
|
Married/in a partnership Single/divorced/widow |
69/31 |
49/51 |
54/46 |
45/55 |
|
Village/town/city |
47/23/30 |
44/25/31 |
50/25/25 |
59/19/22 |
|
Financial status bad/average/good |
59/25/11 |
49/39/8 |
54/38/7 |
If we regard the group of alcohol consumers separately, we see that the ratio of men to women does not change significantly. About 90% of all respondents in this group consists of men; however, taking the section of this group by age, we see that the group of alcohol consumers is getting younger – the share of consumers under 30 years of old in a 4-year time increased from 10% to 21%. During the reseaerch period, the share of retiree and unemployed respondents in this group has also increased: from 41% in 2016 to 54% in 2019. This group also became more dominated by rural rather than urban or city residents in the recent years. More than half of these individuals consider their financial situation as poor.
3.5. Alcohol consumption in groups
An assessment was made of the amount of alcohol consumed per drinker per week, including a comparison between the group consumption.
Table 8. Alcohol consumption per drinker per week (number of drinks)
|
2016 |
2017 |
2018 |
2019 |
|
|
All |
7,5 |
7,1 |
6,4 |
5,4 |
|
Binge drinkers |
30,7 |
28,6 |
17,9 |
19,0 |
|
Regular |
13,3 |
9,7 |
8,4 |
8,7 |
|
Occasional |
3,5 |
3,9 |
4,3 |
3,6 |
The amount of alcohol consumed per week has been decreasing every year and has fallen from 7.5 to 5.4 SUA over 4 years. Drinking volumes decreased the most in the group of binge drinkers, where consumption decreased from 30 SUA recorded in 2016 to 19 SUA in 2019. The amount consumed by occasional drinkers remained virtually unchanged and ranges from 3.5 to 4.3 SUA per week in different years.
The distribution of the amount of net alcohol consumed during the week (Fig. 1) in the groups of drinkers will help to correlate the amount of alcohol consumed by individual groups of consumers.
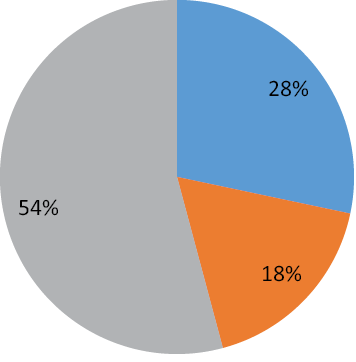
Fig. 1. Distribution of weekly alcohol consumption by consumer: binge drinkers 8%, regular drinkers 11%, occasional drinkers 81%.
This comparison reveals a very unequal distribution of alcohol consumption among drinkers: 28% of the drinking group consumed alcohol which accounted for 5% among all respondents. Among all binge drinkers in the last 12 months, this group accounted for just 8%. Regular drinkers consummed 18% of alcohol, compared to 7% of all respondents or 11% among drinkers in the last 12 months. Fifty-four percent of the respondents who had consumed alcohol on occasion accounted for 52% of the respondents and made up 81% among all drinkers in the last 12 months.
3.6. Alcohol cosumption environment and habits
Regarding the changes in the place and time of alcohol consumption, the results from 2017 (information from groups in 2016 is not available) are presented below.
- Increased alcohol consumption at bars and events. There was a strong increase in the number of regular and occasional drinkers during events and a significant increase (from 35% to 50%) in the number of drinkers in bars among regular drinkers, to a lesser extent – among occasional drinkers. The increase in consumption in bars may have been due to a decrease in alcohol consumption in the group of regular drinkers, but the growing trend in consumption at events is still difficult to explain.
There has been a slight increase in domestic alcohol consumption, although, as in previous years, occasional home drinkers are less likely to drink than binge drinkers or regular drinkers. - There is a consistent increase in the number of people who consume alcohol at work (which may be related to an increase in the rural population and young people in this group) and in the group of people who regularly consume alcohol. The latter change can be related to structural changes in the groups – an increase in the rural population, the drinking group becoming younger, and a lower level of education in the group of regular users.
Table 9. Places where respondents consume alcoholic beverages
|
2017 |
2018 |
2019 |
|
|
All alcohol-consuming respondents |
|||
|
Domestic settings (at home or as guests) |
89 |
89 |
92 |
|
Public places (parks or similar places) |
8 |
8 |
8 |
|
Events (concerts, fairs, etc.) |
7 |
14 |
17 |
|
Bars, restaurants, cafés |
40 |
38 |
45 |
|
At work (at the office, during breaks) |
2 |
2 |
3 |
|
Binge drinkers |
|||
|
Domestic settings (at home or as guests) |
94 |
96 |
100 |
|
Public places (parks or similar places) |
24 |
33 |
32 |
|
Events (concerts, fairs, etc.) |
9 |
11 |
2 |
|
Bars, restaurants, cafés |
23 |
24 |
21 |
|
At work (at the office, during breaks) |
4 |
6 |
13 |
|
Regular drinkers |
|||
|
Domestic settings (at home or as guests) |
98 |
96 |
99 |
|
Public places (parks or similar places) |
11 |
10 |
11 |
|
Events (concerts, fairs, etc.) |
10 |
17 |
27 |
|
Bars, restaurants, cafés |
35 |
35 |
50 |
|
At work (at the office, during breaks) |
0 |
3 |
6 |
|
Occasional drinkers |
|||
|
Domestic settings (at home or as guests) |
86 |
87 |
91 |
|
Public places (parks or similar places) |
6 |
5 |
5 |
|
Events (concerts, fairs, etc.) |
6 |
13 |
17 |
|
Bars, restaurants, cafés |
43 |
40 |
46 |
|
At work (at the office, during breaks) |
2 |
1 |
1 |
Morning drinking, which is typical of binge drinkers, declined: the number of respondents who drank frequently was 37% in 2017 and dropped to 28% in 2019. Among regular users, the number of respondents who were occasional drinkers ranged from 39% and decreased to 29% in 2019.
Table 10. Alcohol consumption in the morning
|
2017 |
2018 |
2019 |
|
|
2017 |
2018 |
2019 |
|
|
All alcohol consumers |
|||
|
Yes, often |
3 |
3 |
3 |
|
Occasionally |
13 |
16 |
14 |
|
Never |
82 |
79 |
80 |
|
Binge drinkers |
|||
|
Yes, often |
37 |
27 |
28 |
|
Occasionally |
39 |
47 |
38 |
|
Never |
24 |
25 |
29 |
|
Regular drinkers |
|||
|
Yes, often |
1 |
||
|
Occasionally |
39 |
27 |
27 |
|
Never |
59 |
72 |
69 |
|
Occaasional drinkers |
|||
|
Yes, often |
|||
|
Occasionally |
7 |
11 |
10 |
|
Never |
91 |
85 |
87 |
In order to assess the impact of restrictive alcohol policies on the decision to quit drinking, the survey asked whether any attempts were made to quit. The responses clearly show a steady decline in the number of people who have tried to stop drinking and a decrease in the number of people who have tried to stop drinking in the recent years.
Table 11. Proportion of respondents who tried to stop drinking alcohol in separate groups
|
Groups |
2017 |
2018 |
2019 |
|||
|
Yes |
No |
Yes |
No |
Yes |
No |
|
|
All alcohol consumers |
10 |
85 |
13 |
82 |
7 |
87 |
|
Binge drinkers |
22 |
76 |
23 |
73 |
17 |
80 |
|
Regular drinkers |
16 |
81 |
12 |
83 |
5 |
88 |
|
Occasional drinkers |
8 |
86 |
12 |
82 |
7 |
87 |
In addition, it was asked whether alcohol restriction policies affected alcohol consumption habits in general. Despite the fact that the respondents’ answers show a decrease in the frequency of morning consumption and a decrease in the amount of alcohol consumed, the respondents do not think that this is related to the measures taken by the government to control alcohol consumption. Comparing data from the year 2019 to 2018, it was seen that restrictions on alcohol sales and advertising had minor effects on habit change. This is confirmed by findings obtained regarding the attempts to stop drinking alcohol.
Table 12. Have the restrictions on the sale and advertising of alcohol in the recent years changed the consumption habits of alcoholic beverages?
|
2018 |
2019 |
|
|
2018 |
2019 |
|
|
All alcohol consumers |
||
|
Definitely yes |
5 |
2 |
|
More yes |
12 |
9 |
|
More no |
40 |
39 |
|
Definitely no |
38 |
44 |
|
Binge drinkers |
||
|
Definitely yes |
2 |
1 |
|
More yes |
14 |
9 |
|
More no |
48 |
34 |
|
Definitely no |
36 |
55 |
|
Regular drinkers |
||
|
Definitely yes |
6 |
1 |
|
More yes |
11 |
7 |
|
More no |
52 |
48 |
|
Definitely no |
25 |
39 |
|
Occasional drinkers |
||
|
Definitely yes |
5 |
2 |
|
More yes |
12 |
10 |
|
More no |
37 |
39 |
|
Definitely no |
41 |
43 |
In order to clarify the often escalating issue of the increase in illicit alcohol consumption as a substitute for legal alcohol because of tighter legal consumption, the survey asked how the measures introduced had affected illicit alcohol consumption. According to the majority of the respondents, the amount of illegal alcohol purchases remained the same as before, but the number of those who think so increased in 2019. It is worth mentioning that in 2018, 30% of drinkers thought that illegal alcohol purchases had increased, whereas this number had actually dropped down to 15% in 2019.
Table 13. Have people in your environment bought less of the same amount or more of illegally produced alcohol in the last year after the restrictions on the sale of alcoholic beverages?
|
2018 |
2019 |
|
|
Binge drinkers |
||
|
Buy less |
7 |
7 |
|
Same as before |
50 |
59 |
|
Buy more |
30 |
15 |
|
Regular drinkers |
||
|
Buy less |
8 |
5 |
|
Same as before |
56 |
65 |
|
Buy more |
14 |
16 |
|
Occasional drinkers |
||
|
Buy less |
17 |
14 |
|
Same as before |
46 |
57 |
|
Buy more |
11 |
9 |
Another issue often mentioned is the increase in excise duties on alcohol and the possible ineffectiveness of such measures and the damages incurred by Lithuanian alcohol producers. Respondents were asked to indicate how often and how many alcoholic beverages did they bring from abroad to Lithuania.
Table 14. Did you buy alcoholic beverages abroad for return to Lithuania? (% of respondents)
|
2017 |
2018 |
2019 |
|
|
Not once |
|||
|
From Poland |
88 |
87 |
88 |
|
From Latvia |
90 |
89 |
90 |
|
From Belarus or Russia |
92 |
93 |
93 |
|
From other countries |
92 |
93 |
93 |
|
Rarely (1–2 times) |
|||
|
From Poland |
4 |
6 |
6 |
|
From Latvia |
3 |
6 |
5 |
|
From Belarus or Russia |
2 |
2 |
2 |
|
From other countries |
2 |
3 |
3 |
|
3 times or more |
|||
|
From Poland |
3 |
5 |
4 |
|
From Latvia |
2 |
2 |
2 |
|
From Belarus or Russia |
1 |
2 |
2 |
|
From other countries |
1 |
1 |
1 |
The responses clearly show that the number of entrants is small (about 10%) and relatively stable. According to the groups of alcohol consumers, the number of those who drank alcohol more than 3 times a year had increased. If the percentage of such importers from Poland had shrunk to its level in 2017 (8% in 2017, 9% in 2019), then regarding Latvia, this percentage grew consistently and in 2019 reached 8% (previously reaching 3% in 2017). Representatives of this group from Belarus and Russia indicated that imports are rare, but their percentage also rose to 6 percent (being 1% in 2017). It should be emphasized that the number of those who used to carry alcohol back to Lithuania more than 3 times dropped down to zero.
It is noteworthy that among occasional drinkers, a higher percentage of individuals in the last two years began to transport alcohol from Poland. In 2017, 4% of drinkers transported alcohol occasionally, while 5% of drinkers transported alcohol more than 3 times; for 2019, these figures increased to 9% and 8%, respectively. Less individuals transported alcohol from Latvia; in 2017, 5% of drinkers transported alcohol occasionally, while 2% of drinkers transported alcohol more than 3 times. For 2019, these figures increased to 8% and 3%, respectively.
The volume of imported alcohol increased, with beer import increasing the most (in 2017 – 8.88 liters., In 2019 – 11.02 liters). The volume of spirits grew slightly less (in 2017 – 2.35 liters, in 2019 – 3.46 liters).
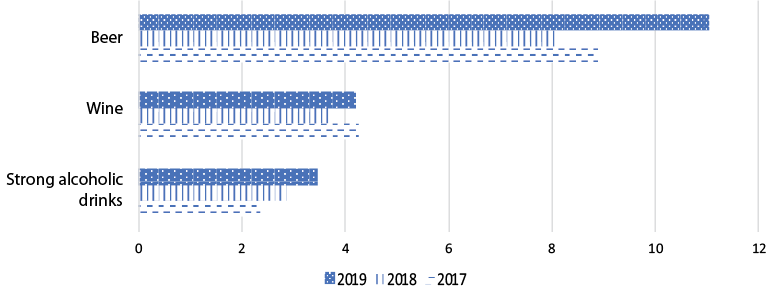
Fig. 2. Amount of alcohol imported from abroad in liters per journey
It is still difficult to unambiguously assess the impact of alcohol restriction measures on alcohol consumption behavior. The currently visible changes show that the number of drinking individuals increased along with the younger consumers, the episodes of heavy drinking and the share of weekly consumers decreased; when examining the amount of alcohol consumed per week, positive shifts can be seen in the groups of binge and regular drinkers.
There are several obvious trends and places of consumption: significantly more alcohol is consumed in bars and at events, while alcohol consumption at work is increasing, especially in the binge drinkers’ group; morning alcohol consumption has decreased.
Despite the changes that have taken place, respondents do not feel that restrictive alcohol policies influence their decisions on alcohol consumption habits. Respondents’ answers do not confirm the fears about the increase in illegal alcohol consumption or its transportation from abroad, although the increase in the volume of imported alcohol is worth considering.
Based on the findings, and understanding the limitations of the survey method and the defined time, we believe that alcohol restriction policies may have adjusted alcohol consumption and consumption habits and were met with a relatively favorable public stance, but the increase in numbers of young alcohol consumers did not meet the expected policy outcomes.
For further research, in order to thoroughly substantiate the policy results, we plan to continue comparing the results of the new surveys and to include additional questions in order to understand the validity of the respondents’ decisions.
Conclusions
The study revealed that in the period of 2016–2019, the share of drinkers and non-drinkers in the last 12 months has changed – the share of drinkers has increased from 57% to 64% in 4 years.
In order to distinguish the drinking habits in detail, all drinkers were divided into three groups depending on the frequency of drinking and the amount consumed during the week: binge drinkers, regular drinkers, occasional drinkers, and non-drinkers. The group of binge drinkers included individuals who consumed alcohol frequently and heavily, who drank daily or 2–4 times a week, and drank 20 or more units of an alcoholic beverage, i.e., more than 200 ml of pure alcohol per week. The group of regular drinkers consists of people who drink alcohol every week and consume 10–19 units of alcoholic. This group includes individuals who drink frequently but do not exceed a particularly risky threshold. Occasional drinkers are those respondents who consume alcoholic beverages once a month or less. The study showed that in the period of 2016–2019, the structure of consumer groups remained stable. It consisted of binge drinkers (5%), regular drinkers (7%); occasional drinkers (50%), and non-drinkers (34%).
Heavy drinking episodes (over 60 ml of pure alcohol per occasion) became less common, except for the group of individuals who consume alcohol every week.
Alcohol consumption has become less common. The proportion of respondents who consume alcohol every week is declining.
An examination of the amount of alcohol consumed per week shows positive shifts in the groups of binge drinkers and regular drinkers, but no significant changes were observed in the group of occasional drinkers over the 4 years.
The survey shows a considerable number in the increase in alcohol consumption in bars and at events and an increase in alcohol consumption at work, especially among binge drinkers; decreased alcohol consumption is seen among those who frequently drank alcohol in the morning; respondents do not feel that restrictive alcohol policies influence their decisions about alcohol consumption habits; the answers of the respondents do not confirm the fears about the increase of illegal alcohol consumption or its transportation from abroad; the increase in imported alcohol is worth a closer study.
It can be concluded that alcohol restriction policies, met with a relatively favorable public attitude, may have adjusted alcohol consumption and consumption patterns, but the increase in the number of young people among alcohol consumers did not meet the expected policy outcomes. The measures adopted did not encourage respondents to give up alcohol in the longer term (12 months).
References
Anker, T. B. (2016). Analysis of the Paternalistic Justification of an Agenda Setting Public Health Policy: The Case of Tobacco Plain Packaging. Public Health Ethics, 9(2), 208–228. https://doi.org/10.1093/phe/phw007
Clarke, H. (2008). The Economist’s Way of Thinking About Alcohol Policy. Agenda: A Journal of Policy Analysis and Reform, 15(2), 27–42. http://www.jstor.org/stable/43199518
Friedman, D. (2013). Public Health Regulation and the Limits of Paternalism. SSRN Electronic Journal. https://doi.org/10.2139/ssrn.2332988
John, S. (2018). Should We Punish Responsible Drinkers? Prevention, Paternalism and Categorization in Public Health. Public Health Ethics, 11(1), 35–44. https://doi.org/10.1093/phe/phx017
Larm, P., Livingston, M., Svensson, J., Leifman, H., & Raninen, J. (2018). The increased trend of non-drinking in adolescence: The role of parental monitoring and attitudes toward offspring drinking. Drug and Alcohol Review, 37(S1), S34–S41. https://doi.org/10.1111/dar.12682
Leigh A., (2009). What evidence should policymakers use? Economic Roundup, 1, pp. 27–44
Law on Alcohol Control of the Republic of Lithuania (current consolidated version 2020-08-01-2020-10-31), no. I-857. https://e-seimas.lrs.lt/portal/legalAct/lt/TAD/TAIS.17752
Increasingly tightening paternalistic control (2019). Lithuanian Free Market Institute. <https://www.llri.lt/wp-content/uploads/2019/07/Paternalistin---politika-grie--t--ja-1.pdf>
Livingston, M., Callinan, S., Raninen, J., Pennay, A., & Dietze, P. M. (2018). Alcohol consumption trends in Australia: Comparing surveys and sales-based measures. Drug and Alcohol Review, 37(S1), S9–S14. https://doi.org/10.1111/dar.12588
Nutritional paternalism. Taxation and nutrition - experiences of other countries. (2017). Lithuanian Free Market Institute. https://www.llri.lt/wp-content/uploads/2017/06/Mitybinis-paternalizmas-Mokes--iai-ir-mityba-kit-----ali---patirtys.-2017.pdf
Parmet, W. (2014). Beyond Paternalism : Rethinking the Limits of Public Health Law. Connecticut Law Review, Forthcoming, 46(5), 25. http://papers.ssrn.com/sol3/papers.cfm?abstract_id=2466572
Raitasalo, K., Simonen, J., Tigerstedt, C., Mäkelä, P., & Tapanainen, H. (2018). What is going on in underage drinking? Reflections on Finnish European school survey project on alcohol and other drugs data 1999–2015. Drug and Alcohol Review, 37(S1), S76–S84. https://doi.org/10.1111/dar.12697
Rastenienė, A., Karpuškienė, V., Liepuonius, A. (2019). Alcohol consumption habits, environment and consequences in Lithuania. Social Theory, Empirics, Politics, and Practice, 18, 59–73. https://doi.org/10.15388/stepp.2019.4
Rehm, J. (2014). Re-examining the theory about the collectivity of changes in alcohol consumption. Addiction, 109(9), 1397–1398. https://doi.org/10.1111/add.12644
Tabako gaminių ir alkoholio vartojimo prevencijos ir kontrolės priemonių efektyvumo ir požiūrio vertinimas (2020) Conducted by Spinter tyrimai. https://ntakd.lrv.lt/uploads/ntakd/documents/files/Ataskaita.pdf
Thomas, M., & Buckmaster, L. (2010). Paternalism in social policy when is it justifiable? Research Paper no. 8 2010–11 (p. 1–23). Parliamnebt of Australia. https://doi.org/http://dx.doi.org/10.4269/ajtmh.abstract2016
Toumbourou, J. W., Rowland, B., Ghayour-Minaie, M., Sherker, S., Patton, G. C., & Williams, J. W. (2018). Student survey trends in reported alcohol use and influencing factors in Australia. Drug and Alcohol Review, 37(S1), S58–S66. https://doi.org/10.1111/dar.12645