Ekonomika ISSN 1392-1258 eISSN 2424-6166
2021, vol. 100(2), pp. 190–212 DOI: https://doi.org/10.15388/Ekon.2021.100.2.9
The Impact of Environmental, Social, and Governance (ESG) Performance on Financial Reporting Quality: International Evidence*
Yasin Şeker
Department of Accounting and Finance, Business Administration,
Faculty of Economics and Administrative Sciences, Hitit University, Turkey
E-mail: yasinseker01@gmail.com
Evren Dilek Şengür
Department of Accounting, Business Administration,
School of Business, Istanbul University, Turkey
E-mail: sengur@istanbul.edu.tr
Abstract: This study investigates the relationship between environmental, social, and governance (ESG) performance and financial reporting quality (FRQ) through the use of data from Datastream, Refinitive Eikon and ASSET4 databases. The initial sample of the study covers all available firms in ASSET4. After eliminating firms with missing data, the final sample of the study consists of 16,072 firm-year observations from 35 countries, covering the years from 2010 to 2017. Several FRQ proxies and firms’ ESG performance indicators are used in the study. The panel regression findings reveal that firms’ ESG performance has a positive impact on FRQ. In other words, it has been found that improving the ESG performance of firms yields higher FRQs. As for ESG pillars, this study finds a positive and statistically significant relationship between FRQ and environmental and governance pillars. The study extends the literature by providing international evidence not only about the aggregate effects of firms’ ESG performance on FRQ but also the effects of each of the three ESG pillars on FRQ.
Keywords: Financial reporting quality, ESG performance, environmental, social, governance
_________
* This paper is based on the first author’s unpublished Ph.D. dissertation which was supervised by the second author at Istanbul University in 2020.
Received: 07/07/2021. Revised: 24/09/2021. Accepted: 20/10/2021
Copyright © 2021 Yasin Şeker, Evren Dilek Şengür. Published by Vilnius University Press
This is an Open Access article distributed under the terms of the Creative Commons Attribution License, which permits unrestricted use, distribution, and reproduction in any medium, provided the original author and source are credited.
1. Introduction
Financial reports are of vital importance for market participants in the decision making process. These reports provide information on a firm’s economic condition in a reliable and timely manner. Furthermore, high-quality financial reports are an effective tool for users of financial analysis and feasibility reports for making accurate decisions (Al-Dmour et al., 2018: 3). However, firms’ misrepresentation of their true economic condition reduces the quality of financial reports. Firms may distort their true economic conditions based on a number of motivations, such as promoting compensation-based bonuses and increasing share price. Interdependence between managers’ performance-related wages and a firm’s financial condition may complicate the financial reporting process by leading to information manipulation and information asymmetry (Mohmed et al., 2019: 1). The demand for information is determined by the firm’s control problem, future cash flows, the knowledge that the contract parties possess on any proprietary information, and the accessibility of the contract’s items. The usefulness of the disclosed information is very sensitive to all of these factors. A minor change in the information source may result in misleading information about the content of the information and accounting accruals (Christensen, 2010: 292). Financial scandals in large firms have heightened global concern about FRQ, and many countries have started to implement FRQ-improving regulations such as Sarbanes Oxley.
Today, the information expectations of firm stakeholders have shifted, and the importance of non-financial information has grown. Firms now publish both financial and non-financial (ESG) information in order to meet the information needs of their stakeholders. In addition to financial scandals, some questions have arisen as to how issues such as increased pollution due to emissions, use of natural resources, child labor, product liability, equal treatment of shareholders and corporate governance are managed. The management level is under pressure due to the demands of stakeholders for receiving information on the firms’ social and environmental impact. All of these factors have led to an increase in management distrust (Arvidsson, 2010: 339). As a result, stakeholders are demanding additional assurance indicators (non-financial) against misappropriation of management (Zhang et al. 2013). Thus, in recent years, the information needs of firms’ stakeholders have expanded beyond financial information. In this context, non-financial information about the firms’ operations is of vital importance for stakeholders. In line with these developments, firms’ ESG performance has become prominent and has hightened the interest of market participants. Publicly traded companies have become more sensitive to the disclosure of ESG performance in order to protect their ethical values and reputation (Rezaee 2016), and influence the behavior of stakeholders.
Corporate Social Responsibility (CSR) or ESG information may enable companies to produce higher-quality financial information by strengthening reporting employees’ ethical sensitivities and by improving information efficiency. Non-financial information should be examined in order to fully comprehend the impact of financial accounting information on resource allocation and utilization in an economy (Bushman and Smith, 2001: 238). Martinez-Ferrero et al. (2015b) underline the importance of investigating of this issue with the use of an international sample. ESG provides a new measure of accountability that reflects voluntary commitment to non-financial goals and ensures the allocation of social trust. Firms adopt ESG in order to capitalize on their strategic and financial advantages (Arayssi et al., 2020: 138).
The majority of the literature investigates the relationship between FRQ or earnings management (EM) and CSR (Chih et al., 2008; Prior et al., 2008; Sun et al., 2010; Kim et al., 2012; Scholtens and Kang 2013; Choi et al., 2013; Bozzolan et al., 2015; Martínez‐Ferrero et al., 2015a; Muttakin et al., 2015; Martínez‐Ferrero et al., 2015b; Almahrog et al., 2018; Wang et al., 2018, Al-Haddad and Whittington, 2019; Mohmed et al., 2019; Palacios-Manzano et al., 2019; Rezaee and Tuo 2019). Fewer studies have used ESG performance indicators to investigate the relationship between ESG performance and FRQ/EM (Velte 2019; Yoon et al., 2019; Mutuc et al., 2020). Overall, most studies find a positive relationship between FRQ and ESG/CSR, and a negative relationship between EM and ESG/CSR (Choi and Pae, 2011; Kim et al., 2012; Dhaliwal et al., 2012; Scholtens and Kang, 2013; Bozzolan et al., 2015; Martínez-Ferrero et al., 2015a; Martínez-Ferrero et al., 2015b; Cheng and Kung, 2016; Garcia-Sanchez and Garcia-Meca, 2017; Lee, 2017). In contrast to expectations, Prior et al. (2008) found a significant positive relationship between EM and CSR. This reveals a lack of attention to this issue, and therefore there is need for further investigation. Accordingly, this study seeks to provide evidence on the relationship between FRQ and ESG performance of firms at the international level. Today, information users take into consideration both financial information indicating the firm’s financial standing and information on the social and environmental impact of firm activities. In order to meet the expectations of information users, firms report non-financial information (ESG) along with publishing their financial information. For this reason, investigating the relationship between financial and non-financial information of firms is important so that to achieve better understanding of firm behavior.
This study aims to contribute to the literature in the following ways. First, this is one of the few studies that examines ESG performance and FRQ with a large international sample. An international sample is crucial for achieving complete insights into how a country’s stakeholder or shareholder orientation affects the usefulness of ESG-related information for analysts and stakeholders (Dhaliwal et al., 2012: 724). In this way, this study aims to increase our understanding about the relationship between ESG performance and FRQ. Moreover, this study investigates not only the impact of total ESG performance on FRQ, but also sub-dimensions of ESG performance. A comprehensive analysis is conducted on how environmental, social and governance scores will affect the FRQ separately. Second, according to the stakeholder theory, companies need to give importance to their stakeholders and get their support in order to survive in the long term. Stakeholders perceive the ESG performance as an important indicator for providing support to a firm. This study provides evidence on the subject by examining the relationship between ESG performance and FRQ. Third, according to the legitimacy theory, firms have to protect their legitimacy in the eyes of the society. Standalone financial reports are not sufficient to ensure legitimacy. Therefore, firms also publish non-financial reports. However, there is need to reveal the effect of ESG performances on FRQ in order to have correct and valid understanding of such legitimacy. This study provides evidence to legitimacy theory by investigating the effect of ESG performance on FRQ. Fourth, the management’s response to stakeholders’ non-financial information needs (ESG reporting) situates the firm into the center of focus. In this case, firms with higher ESG performance are expected to have high FRQ. However, from the perspective of the agency theory, managers may mislead stakeholders by showing the financial situation of the firm better (or worse) than the reality in order to access capital or attract more investors (Leftwich, 1980; Watts and Zimmerman, 1990). In such a case, managers can send positive signals to their stakeholders by paying attention to ESG performance, and, at the same time, they can reduce FRQ due to information asymmetry. This study sheds light on the issue by examining the relationship between ESG performance and FRQ. Last but not least, high ESG performance can be regarded as an indication that the firm acts diligently in terms of reputation, transparency, accountability and ethical behavior. However, this will be more exact when it is revealed indirectly by testing the effect of ESG performance and its pillars on FRQ.
The sample of the study consists of 16,072 firm-year observations from 35 countries covering the years from 2010 to 2017. The data is obtained from Datastream, Refitnitive Eikon and ASSET4 datasets. The ESG score is the independent variable. Environmental (ENV), social (SOC) and governance (GOV) scores, which are sub-dimensions of ESG, are also used separately as independent variables in order to reveal more comprehensive results. As FRQ proxies, the Modified Jones Model (Dechow et al., 1995), Performance Matched Modified Jones Model (Kothari et al., 2005), Dechow and Dichev Model (2002), McNichols Model (2002) are used separately as independent variables. We control for firm-specific variables (size, leverage, return on assets, and firm age) and other variables (country, industry, and year). According to the findings, the aggregate ESG score increases the financial reporting quality in all models. This means that ESG performance has a positive impact on FRQ. Similar results are obtained for ENV and GOV scores, but not for the SOC score. These results are an important indicator for investors, firms, regulators, and the literature.
The study is structured as follows: The following section discusses the theoretical background and formulates the main hypothesis to be tested. The sample, variables, and empirical models are explained in Section 3. In Section 4, the analysis results are examined and discussed. Finally, Section 5 highlights the main findings, discusses the limitations of the study and suggests possible future research lines.
2. Theoretical Background and Hypothesis Development
The relationship between ESG, its pillars, and FRQ can be discussed from a variety of theoretical perspectives. For example, the stakeholder theory prioritizes the protection of stakeholder interests by firms and highlights designing a firm in a way that stakeholder interests are maximized so that the firm can be successful in the long term. The agency theory is interested in the relationship between the principal and the agent. Conflict of interests comes in the form of the work done. According to this theory, a good corporate governance mechanism can mitigate agency costs. The legitimacy theory, on the other hand, emphasizes that firms cannot continue to operate without ensuring their legitimacy in the society. As a matter of fact, firms engage in a variety of corporate image or reputation activities to protect their legitimacy. The signaling theory posits that firms can send signals with additional explanation to illustrate to information users that the firm’s performance is satisfactory. While each theory provides a different perspective, this study utilizes a holistic theoretical framework to discuss ESG and FRQ.
The stakeholder theory provides a beneficial foundation for research into the link between ESG and FRQ. A stakeholder is defined as any group or individual who can affect or be affected by an organization’s actions of the firm’s purpose (Freeman, 1984: 53). The stakeholder theory stipulates determination of firm’s responsibilities to all stakeholders, such as partners, managers, customers, suppliers, employees, financiers, and communities (Freeman and Dmytriyev, 2017: 11-12). In other words, the stakeholder theory rejects the notion that a company should only strive with full consciousness to maximize the benefits of its shareholders (Wijnberg, 2000: 329). The stakeholder theory is often used as an influential theory in corporate governance, social and environmental accounting research. The role and responsibilities of the manager are broad enough in this theory to include the demands and desires of all classes, beyond maximizing dividends. This is because a firm’s ability to continue its activities and its existence for a long time requires the cooperation of all stakeholders. In order to provide this support, ESG and CSR are used as a communication tool between managers and stakeholders (Chiu and Wang, 2015: 380). Furthermore, there are two different perspectives in the stakeholder theory. The first perspective assumes that managers, by taking into account the power and goals of stakeholders, should determine what they want to do and how they want to establish relationships, and manage the company. According to the second perspective, managers should address the company’s activities from an accountability perspective to all stakeholders (Donaldson and Preston, 1995: 77–82). The stakeholder theory assumes that, in compliance with ethical principles, managers should provide reliable information to their stakeholders. By giving priority to the stakeholders, the firm may create a long-term relationship with its stakeholders. Consequently, companies do not tend to mislead stakeholders such as EM, and they provide high quality financial reports (Velayutham, 2018: 553).
The agency theory originated from the relationships between firm owners (principals) and those who manage the firm (agents). According to this theory, conflict of interests arises in the performed work since principals and agents will act in line with their self-interests while making decisions. This self-interest assumption dooms the agency theory to unavoidable inherent internal conflicts. Furthermore, such situations can be seen not only in commercial partnerships, but also in any organizational structure and among family members (Jensen, 1994: 13). In corporate governance, company owners transfer control to managers who act as their representatives. The problem with the agency begins with these managers starting to behave in a manner that does not protect the interests of the stakeholders (Miller, 2002: 432). Managers may mislead stakeholders by showing the firm’s financial situation as better as or worse than reality in order to attract more investors or to obtain loans. The agency costs arise when the agents deviate from the principal’s interest. Accountable and transparent mechanisms are required to mitigate this issue. Previous research has suggested that managers should be monitored effectively by the board of directors, the audit committee should work effectively to monitor the flexibility of the accounting system, and financial analysts should be able to use the financial and non-financial information reported by managers to lessen the information asymmetry created by the agency problem (Leftwich, 1980; Watts and Zimmerman, 1990; Healy and Palepu 2001). It can be argued that ESG, CSR, corporate governance mechanisms, and contractual arrangements of firms play a prominent role in solving the agency problem in present-day conditions.
The legitimacy theory is a prominent theory used in studies on ESG and CSR. Firms protect their legitimacy through voluntary disclosure of environmental, social and corporate governance. Suchman considers that “legitimacy is a generalized perception or assumption that the actions of an entity are desirable, proper, or appropriate within some socially constructed system of norms, values, beliefs, and definitions” (1995: 574). Legitimacy is important for companies to continue their activities and find stakeholders (Joshi and Gao, 2009: 30). As Lindblom (1994) points out, firms can disclose changes in firm activities to stakeholders, try to change their opinions about the firm, try to change their perceptions by providing emotional messages to stakeholders, and ultimately try to change the expectations of stakeholders in order to maintain legitimacy. Even though a firm may choose ESG to maintain or increase perceptions of its legitimacy, it may also use it to recognize or prevent social pressure, as well as to improve the firm’s image or reputational status (Gray et al., 1988). However, firms with low FRQ may tend to use ESG to maintain legitimacy.
Finally, the signaling theory assumes that firms should provide further explanation to reduce asymmetric information and present to users the information that the performance of the firm is good (Morris, 1987: 48). Due to the information asymmetry between the firm management and stakeholders, managers can withhold the real economic value of the firm from stakeholders by selecting accounting methods and estimates in their self-interests. Prior et al. (2008) argue that managers may use positive or negative signals about the firm’s performance in capital markets for the purposes of EM by using situations that rely on their own preferences. For example, when managing profits, investors can be shown that the firm has a more profitable and better cash flow than its actual situation, and vice versa (Sun et al., 2010: 683). This indicates a lower FRQ. Reliability of disclosures provided by the firm is a key factor in the reduction of asymmetric information. Therefore, a firm can render itself reliable by sending consistent signals about its quality to the capital markets (Hughes, 1986: 120–121). By using ESG, the company essentially wants to emphasize the quality of management. Although high-quality firms tend to report their ESG performance along with their financial reporting, low-quality firms tend to report only limited accounting data. Moreover, high quality ESG performance strengthens a firm’s reputation in the eyes of shareholders and other stakeholders (Gray, 2005: 183). Firms use corporate financial reporting as a positive signal to investors. However, when managers manage earnings, they may disclose more information on a voluntary basis as a positive signal to stakeholders in order to mask this situation and improve their corporate image (Sun et al., 2010: 683). The ESG performance not only strengthens corporate reputation, but also contributes to increasing the capacity for sustainable growth. For this reason, many managers are integrating ESG issues into their organizational decision-making processes (Wang, 2015: 1). Since managers may resort to EM practices when there is a high asymmetry of information, the signaling theory considers the quality of CSR/ESG as a means of alleviating the asymmetry of information between management and stakeholders (Chih et al., 2008: 180). Consequently, CSR/ESG performances may reduce EM practices and thus increase the FRQ of firms (Laksmana and Yang, 2009: 40–41).
Early studies analyzing the relationship between FRQ and CSR/ESG practices provide mixed results. For example, Martínez-Ferrero et al. (2015b) find a negative relationship between CSR and EM practices. They also determine that firms with a high level of accrual quality report high-quality financial information as well as high-quality CSR information. Choi and Pae (2011) examine the relationship between business ethics and FRQ and find empirical evidence that firms with a high level of ethical commitment have higher FRQ. They also find that firms with a higher ethical commitment engage in less earnings management, predict future cash flows more correctly, and report earnings more conservatively. Chouaibi and Zouari (2021) find a negative relationship between EM and a firm’s ethical behavior. According to these findings, the more important the socially responsible and ethical behaviors are, the less the firm engages in an aggressive EM practices. According to Kim et al. (2012), CSR firms are less likely to engage in aggressive EM. The findings show that CSR activities motivate managers to be honest, truthful, and ethical, as well as contribute to the production of high-quality financial reports. Likewise, many authors have found a significant positive relationship between CSR/ESG and FRQ (i.e., Scholtens and Kang, 2013; Bozzolan et al., 2015; Martínez-Ferrero et al., 2015a; Cheng and Kung, 2016; Garcia-Sanchez and Garcia-Meca, 2017; Lee, 2017). In this context, this study expects that ESG will improve FRQ.
One strand of literature, however, provides contrary results. For example, Prior et al. (2008) obtained empirical evidence for the positive effect of CSR practices on manipulative behavior and recommended that these practices should be used to conceal EM, which indicates low FRQ. In a similar vein, Salewski and Zülch (2014) investigate the relationship between CSR and EM. According to their findings, firms with higher CSR ratings are more likely to engage EM. In this case, CSR may not always produce higher FRQ. Sun et al. (2010) found no statistically significant relationship between EM (and therefore FRQ) and the environmental dimension.
As discussed before, firms’ ESG performance consists of several aspects related to social, environmental and governance issues. A firm willing to increase its ESG performance is required to be more sensitive to the environment, pay attention to social issues, meet the needs of its stakeholders and fulfill its responsibilities towards the society. These requirements can also be discussed in the framework of CSR or a firm’s ethical behavior. In other words, if a firm has higher ESG performance, then this performance should be reflected in financial reporting practices by providing more reliable and accurate information to the financial statement users. For example, a firm that is sensitive to the environment, protects the interests of its stakeholders and complies with social norms can be expected to present the same sensitivity in the financial reporting process and therefore to have a high financial reporting quality. Therefore, in line with these theoretical perspectives and empirical evidence, this study posits the expectation that a firm’s ESG performance has positive and significant impact on FRQ. This expectation is formulated as follows:
H1: A firm’s ESG performance has a significant and positive impact on FRQ.
The main hypothesis is developed to determine the association between the aggregate ESG performance and FRQ. To test the association between the ESG pillars (environmental [ENV], social [SOC], and governance [GOV]) and FRQ, the following three sub-hypotheses are formulated:
H1a: A firm’s ENV performance has a significant and positive impact on FRQ.
H1b: A firm’s SOC performance has a significant and positive impact on FRQ.
H1c: A firm’s GOV performance has a significant and positive impact on FRQ.
3. Data and Methodology
3.1. Data and Sample Selection
The financial and non-financial data of the firms have been obtained from Thomson Reuters Datastream, Eikon and ASSET4 databases. There are over 7,000 firms with ESG scores in the database worldwide, and when the financial sector is excluded, a total of 5,017 firms remain in ASSET4. The data from these firms covers the period between 2010 and 2017. Firms with missing data are excluded from the study. In addition, countries having less than eight firms with available ESG data are excluded from the sample. After these eliminations, a total of 2,009 firms operating in 24 industries from 35 countries constitute the sample of the study.
3.2. Main Variables
3.2.1. Measurement of ESG
ESG refers to a combination of environmental, social, and corporate governance considerations that can have an impact on a company’s ability to implement its business strategy and create long-term value. Although ESG is referred to as non-financial or extra-financial, how a company manages its ESG dimensions has a direct and measurable impact on financial results. There is a shift in focus from today’s vague, philosophical, and aspirational language (sustainability) toward more specific operational and tactical terms (ESG). In this context, ESG reporting is not only an ethical issue, but also a financially-motivated pursuit of best practices and long-term returns, enlightening management (Nasdaq, ESG Reporting Guide 2.0, 2019: 4).
ENV stands for a firm’s environmental performance and encompasses a variety of related data points, including all natural systems, both living and non-living, such as air, soil, water, and the entire ecosystem (GRI 307: Environmental Compliance 2016). Because the firm’s emphasis on the environmental dimension suggests that it is concerned about sustainability, it is expected to have a positive impact on investors and stakeholders who make their decision based on the information.
SOC signifies a firm’s social performance and essentially includes a firm’s fulfillment of its responsibilities to its workforce, customers, and society. The social dimension is important for the company’s reputation and continuity, contributing to long-term success and making long-term investors easier to find. Employees, customers, and society can all put their trust in firms that consider the social dimension.
GOV represents a firm’s governance performance and refers to factors related to good corporate governance, such as the firm’s compliance with corporate governance principles in its systems and processes, the management’s decisions to protect the rights of shareholders and other stakeholders, long-term shareholder interest protection, and the board structure.
This study utilizes ASSET4 database to obtain data. ASSET4 provided by Refinitiv offers one of the most comprehensive ESG databases with more than 400 different ESG criteria covering over 7,000 firms worldwide. This corresponds to 70% of international markets, meaning that the database covers 70% of global markets. As far as data quality, Refinitiv is highly transparent and provides access to all sub-scores. It also uses a combination of algorithmic and human processes to ensure that 100% data quality is achieved (Refinitiv, 2019: 3–4). With the increasing demand for ESG statements and performances, databases such as Refinitiv (formerly Thomson Reuters) ASSET4, KLD, Bloomberg, Sustainalytics, EIRIS have specialized in this field and have begun to measure the performance of firms on the basis of ESG statements within the framework of very comprehensive parameters. Previous studies comparing these databases in terms of data comprehensiveness have shown that ASSET4 is the most comprehensive ESG data provider. Dorfleitner et al. (2015), for example, compared ASSET4, KLD, and Bloomberg databases over ESG scores and determined that ASSET4 has the most comprehensive ESG score calculation indicators while KLD calculates with the fewest indicators. The standard deviation of ESG average scores shows the least fluctuation since z-score is used by ASSET4. The study also revealed that there is a positive relationship between the ESG scores of these three databases.
3.2.2. Measurement of FRQ
Several FRQ proxies are used in the literature, and these proxies differ from each other with regards to their focal points (Chen et al., 2011). For example, Jones (1991) employed the linear regression method to account for non-discretionary accrual factors including sales revenue and gross property, plant, and equipment. Later, Dechow et al. (1995) introduced the Modified Jones Model that includes an adjustment to sales based on the change in the number of receivables. Kothari et al. (2005) created the Performance Matched Modified Jones Model by adding ROA as a performance measure to the Modified Jones Model. Dechow and Dichev (2002) consider a new aspect of working capital quality and income accruals. McNichols (2002) developed a model with higher power to explain the quality of accruals over working capital by using the determinants of Jones (1991) and Dechow and Dichev (2002) models. Therefore, four different models are used in this study to determine the proxy of financial reporting quality that is used as a dependent variable. The Modified Jones Model, the Performance Matched Modified Jones Model, the Dechow and Dichev Model, and the McNichols Model are the most preferred models for determining the FRQ proxies (Biddle et al., 2009; Sun et al., 2010; Chen et al., 2010; Krishnan et al., 2011; Chandar et al., 2012; Hope et al., 2013; Choi et al., 2013; Hanlon et al., 2014; Gomariz and Ballesta, 2014; Martinez-Ferrero et al., 2015b; Almahrog et al., 2018; Velte, 2019). FRQ is measured through determination of EM practices in these models. Increasing the quality of financial reporting depends on reducing EM practices (Dechow and Skinner, 2000: 236). In other words, FRQ is considered to be the inverse of EM. Therefore, when EM is low, the financial reporting quality is high, and vice versa. Four proxies widely used in prior studies are used in this study to ensure the robustness of the conclusions. The models used as FRQ proxies are described below.
The Modified Jones Model as proxy of financial reporting quality (FRQ1);
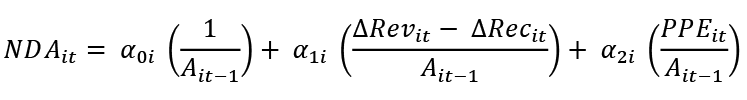
where NDAit represents non-discretionary accruals of firm i in period t; Ait-1 total assets of firm i for period t – 1; ∆REVit change in revenue of firm i in period t (REVt – REVt-1); ∆Recit change in receivables of firm i in year t (Rect – Rect-1); PPEit gross property, plant and equipment value of firm i in period t; α0i, α1i, α2i parameters.
The following model was used to determine the values of discretionary accruals by using the least squares method to estimate the α0i, α1i, α2i values of β0i, β1i, β2i respectively:
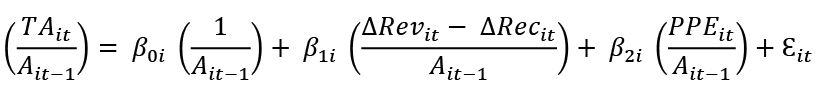
where TA is the total accruals determined by subtracting earnings before extraordinary items from cash flows of operations; i firm; t year; A total assets; ∆Rev change in revenue; ∆Rec change in receivables; PPE gross property, plant and equipment; ε residuals.
The absolute value of discretionary accruals is used as a proxy for financial reporting quality. This is because the distance of discretionary accruals values from zero, rather than negative or positive values, is an indicator of the financial reporting quality. The absolute value of the discretionary accruals closest to zero shows the state of the highest level of financial reporting quality, while the farthest indicates the lowest financial reporting quality. The absolute value of discretionary accruals is multiplied by (-1) for reversing this condition, as applied by Chen et al. (2011). The highest value is therefore the highest financial reporting quality, while the lowest value is the lowest financial reporting quality.
The Performance Matched Modified Jones Model as proxy of financial reporting quality (FRQ2);

For this model, the same explanations as of the first model hold true. Only the return on assets (ROA) variable is added to the equation compared to the first model. As in the first model, the absolute value of discretionary accruals is multiplied by (-1).
The Dechow and Dichev (2002) Model as proxy of financial reporting quality (FRQ3);
∆WCt = α + β1 (CFOt–1) + β2 (CFOt) + β3 (CFOt+1) + εt
where ΔWC is the variation in working capital of firm i from year t to year t−1; CFO is the operating cash flow of firm i in years t−1, t, and t+1; and ε is the residual. All variables in the model are divided by average total assets. As in the first model, the absolute value of residuals is multiplied by (-1).
The McNichols Model as proxy of financial reporting quality (FRQ4);
∆WCt = α + β1 (CFOt-1) + β2 (CFOt) + β3 (CFOt+1) + β4 ∆Revt + β5 PPEt + εt
All variables remain the same as defined in previous models. All variables in the model are divided by average total assets. As in the first model, the absolute value of residuals is multiplied by (-1).
3.2.3. Control Variables
Following previous studies, several firm characteristics that may have an effect on FRQ are used as control variables. These are profitability (ROA), leverage (LEV), firm size (SIZE), and firm age (FIRM_AGE). Also, country, industry (based on a 2-digit classification), and year dummies are included to control for other factors. ROA is used as proxy for a firm’s profitability. It may have a positive, negative, or insignificant effect on FRQ (Kim et al., 2012; Tang et al., 2016; Lee, 2017; Almahrog et al., 2018; Rezaee and Tuo, 2019; Baraibar-Diez and Odriozola, 2019; Yoon et al., 2019). LEV is used as a proxy for capturing the impact of debt contracting on FRQ. In terms of the relationship between leverage and FRQ, opposing empirical findings emerge. On the one hand, it is stated that high leverage firms have low FRQ because they manage their earnings based on debt contracts (Becker et al., 1998; Sweeney, 1994; Richardson et al., 2002). On the other hand, it is noted that firms with higher leverage use less EM, and therefore they tend to have higher FRQ as well (Dechow and Skinner, 2000). There are also studies that do not find evidence of a significant relationship between FRQ and leverage (Chung and Kallapur 2003; Chih et al., 2008; Lobo et al., 2018). As a result, the relationship between the LEV and the FRQ is uncertain. SIZE is commonly used as a determinant variable of FRQ. Larger firms are subject to stronger pressure from stakeholders, and, therefore, are expected to deliver higher-quality financial reports that meet the needs of users. A positive relationship between SIZE and FRQ is expected (Choi and Pae, 2011; Kim et al., 2012; Lee, 2017; Lobo et al., 2018; Velte 2019; Drempetic et al., 2019). FIRM_AGE is added to test for possible effects at different levels of the business development. The relationship between FRQ and FIRM_AGE is expected to be positive (Kim et al., 2012; Al-Haddad and Whittington, 2019; Yoon et al., 2019).
3.3. Empirical Models
To test the relation between FRQ and ESG, we estimate the following model:
FRQit= α + β1 ESGit + β2 SIZEit + β3 ROAit + β4 LEVit + β5 FIRM_AGEit + Σ YEAR + Σ INDUSTRY+ Σ COUNTRY + εit
FRQit = Separately represents the models FRQ1, FRQ, FRQ 3 and FRQ 4
ESGit = Separately represents ESG, ENV, SOC, and GOV
SIZEit = The natural logarithm of the market value of equity
ROAit = Return on assets
LEVit = Total liabilities/total assets
FIRM_AGEit = The natural logarithm of 1 + age of firm
YEAR, INDUSTRY, COUNTRY = Represents dummy variables for year, industry, and country.
As both FRQ and ESG are represented by different proxies, twenty different models are used in the study. The FRQ1 model, for example, has five different models: ESG with FRQ1, ENV with FRQ1, SOC with FRQ1, and GOV with FRQ1. The same is true for FRQ2, FRQ3, and FRQ4 models.
Following Chen et al. (2011), Salewski and Zülch (2014), Cavaco and Crifo (2014), Cheng et al. (2014), Watson (2015), Lee (2017), Boubakri et al. (2016), Aouadi and Marsat (2018), Almahrog et al. (2018), Dyck et al. (2019), Yoon et al. (2019) and Rezaee and Tuo (2019), multivariate specifications are estimated by using the multiple pooled OLS regression with robust (robust, Eicker/Huber/White) standard error to control the heteroscedasticity and serial dependence problems that may occur in pooled OLS regression analyses (Petersen, 2009). Furthermore, the robust option can be used without any problems, and robust standard errors are usually used when the sample size is large (Wooldridge, 2002: 57). We tested variables for multicollinearity by considering variance inflation factors (VIF) values. In all analyses, VIF values range between 1 and 2. When the variance increase factor is less than 10, there is no problem with multicollinearity (Hair et al., 2009). Thus, multicollinearity between variables is not a concern in this study.
4. Results
4.1. Descriptive Statistics
Table 1 includes the countries within the scope of the study, the number of firms and the number of observations used in the analysis. Thirty-five countries are included in the study. Among these, the United States, the United Kingdom, Japan and Canada have the highest number of observations, while the Philippines, Israel and New Zealand have the lowest number of observations.
Table 1. Distribution of sample firms by registering country
|
Country |
# of firm |
# of Obs. |
|
Australia |
121 |
968 |
|
Belgium |
15 |
120 |
|
Brazil |
33 |
264 |
|
Canada |
112 |
896 |
|
Chile |
12 |
96 |
|
China |
37 |
296 |
|
Denmark |
17 |
136 |
|
Finland |
19 |
152 |
|
France |
65 |
520 |
|
Germany |
49 |
392 |
|
Hong Kong |
89 |
712 |
|
India |
35 |
280 |
|
Indonesia |
17 |
136 |
|
Israel |
8 |
64 |
|
Italy |
19 |
152 |
|
Japan |
296 |
2,368 |
|
Korea, Republic (S. Korea) |
53 |
424 |
|
Malaysia |
23 |
184 |
|
Mexico |
10 |
80 |
|
Netherlands |
20 |
160 |
|
New Zealand |
8 |
64 |
|
Norway |
15 |
120 |
|
Philippines |
8 |
64 |
|
Poland |
10 |
80 |
|
Russia |
17 |
136 |
|
Singapore |
23 |
184 |
|
South Africa |
25 |
200 |
|
Spain |
28 |
224 |
|
Sweden |
29 |
232 |
|
Switzerland |
32 |
256 |
|
Taiwan |
76 |
608 |
|
Thailand |
14 |
112 |
|
Turkey |
12 |
96 |
|
United Kingdom |
163 |
1,304 |
|
United States of America |
499 |
3,992 |
|
Total |
2,009 |
16,072 |
Note: This table shows the sample distribution by country. There are a total number of 16,072 firm-year observations from 35 countries.
Table 2 illustrates descriptive statistics for the FRQ proxy variables (panel A), the ESG scores (panel B), and the control variables (panel C). The mean, median, standard deviation, 25th percentile, and 75th percentile values for each variable is reported. The mean (median) values for the proxy variables of financial reporting quality are -0.034 (-0.022) for FRQ1, -0.029 (-0.020) for FRQ2, -0.042 (-0.027) for FRQ3, and -0.040 (-0.026) for FRQ4. ESG scores range from 1 to 100. The mean (median) values of ESG, ENV, SOC, and GOV are 54.520 (56.250), 56.290 (58.651), 54.931 (56.967), and 52.068 (52.622), respectively. For the control variables, the mean (median) values of SIZE, ROA, LEV, and FIRM_AGE are 15.297 (15.338), 5.693 (5.420), 0.547 (0.547), 3.091 (3.178), respectively.
Table 2. Descriptive Statistics
|
Variables |
n |
Mean |
Median |
Std. Dev. |
25th Percentile |
75th Percentile |
|
Panel A: Proxy of Financial Reporting Quality |
||||||
|
FRQ1 |
14063 |
-0.034 |
-0.022 |
0.046 |
-0.043 |
-0.008 |
|
FRQ2 |
14063 |
-0.029 |
-0.020 |
0.034 |
-0.040 |
-0.007 |
|
FRQ3 |
12054 |
-0.042 |
-0.027 |
0.055 |
-0.054 |
-0.010 |
|
FRQ4 |
12054 |
-0.040 |
-0.026 |
0.053 |
-0.053 |
-0.008 |
|
Panel B: ESG Performance |
||||||
|
ESG |
14063 |
54.520 |
56.250 |
17.665 |
41.538 |
67.961 |
|
ENV |
14063 |
56.290 |
58.651 |
22.622 |
38.555 |
74.695 |
|
SOC |
14063 |
54.931 |
56.967 |
22.317 |
38.327 |
72.742 |
|
GOV |
14063 |
52.068 |
52.622 |
20.879 |
35.777 |
68.738 |
|
Panel C: Control Variables |
||||||
|
SIZE |
14063 |
15.297 |
15.338 |
1.607 |
14.473 |
16.242 |
|
ROA |
14063 |
0.057 |
0.054 |
0.096 |
0.026 |
0.092 |
|
LEV |
14063 |
0.547 |
0.547 |
0.225 |
0.408 |
0.679 |
|
FIRM_AGE |
14063 |
3.091 |
3.178 |
0.600 |
2.708 |
3.664 |
Table 3 presents the correlation coefficients and significance values for the variables. There is a significant positive correlation between the FRQ1, FRQ2, FRQ3 and FRQ4 variables representing financial reporting quality and the ESG, ENV, SOC, and GOV scores, as expected. The correlation coefficients are not particularly high and are at an acceptable level. This indicates that the variables in the regression models do not suffer from any multicollinearity issues. This coefficient shows that there is a significant positive relationship between FRQ proxies and ESG performance indicators. It should be kept in mind that the absolute value of FRQ proxies is multiplied by minus one. Therefore, the relationship between FRQ and ESG performance is positive.
Table 3. Correlation Coefficients
|
Variable |
(1) |
(2) |
(3) |
(4) |
(5) |
(6) |
(7) |
(8) |
(9) |
(10) |
(11) |
(12) |
|
(1) FRQ1 |
1.000 |
|||||||||||
|
(2) FRQ2 |
0.750 |
1.000 |
||||||||||
|
(0.000) |
||||||||||||
|
(3) FRQ3 |
0.258 |
0.229 |
1.000 |
|||||||||
|
(0.000) |
(0.000) |
|||||||||||
|
(4) FRQ4 |
0.261 |
0.239 |
0.960 |
|||||||||
|
(0.000) |
(0.000) |
(0.000) |
1.000 |
|||||||||
|
(5) ESG |
0.085 |
0.094 |
0.960 |
1.000 |
||||||||
|
(0.000) |
(0.000) |
(0.000) |
0.100 |
|||||||||
|
(6) ENV |
0.106 |
0.109 |
0.104 |
(0.000) |
0.862 |
1.000 |
||||||
|
(0.000) |
(0.000) |
(0.000) |
0.117 |
(0.000) |
||||||||
|
(7) SOC |
0.070 |
0.078 |
0.116 |
(0.000) |
0.885 |
0.727 |
1.000 |
|||||
|
(0.000) |
(0.000) |
(0.000) |
0.083 |
(0.000) |
(0.000) |
|||||||
|
(8) GOV |
0.021 |
0.033 |
0.087 |
(0.000) |
0.632 |
0.280 |
0.333 |
1.000 |
||||
|
(0.013) |
(0.000) |
(0.000) |
0.034 |
(0.000) |
(0.000) |
(0.000) |
||||||
|
(9) SIZE |
0.171 |
0.106 |
0.071 |
(0.000) |
0.386 |
0.369 |
0.378 |
0.154 |
1.000 |
|||
|
(0.000) |
(0.000) |
(0.000) |
0.109 |
(0.000) |
(0.000) |
(0.000) |
(0.000) |
|||||
|
(10) ROA |
0.218 |
-0.005 |
0.120 |
(0.000) |
0.028 |
0.017 |
0.049 |
-0.003 |
0.313 |
1.000 |
||
|
(0.000) |
(0.562) |
(0.000) |
0.021 |
(0.001) |
(0.047) |
(0.000) |
(0.766) |
(0.000) |
||||
|
(11) LEV |
0.010 |
0.040 |
0.020 |
(0.013) |
0.157 |
0.157 |
0.169 |
0.035 |
0.043 |
-0.116 |
1.000 |
|
|
(0.236) |
(0.000) |
(0.017) |
0.030 |
(0.000) |
(0.000) |
(0.000) |
(0.000) |
(0.000) |
(0.000) |
|||
|
(12) FIRM_AGE |
0.116 |
0.128 |
0.021 |
(0.000) |
0.200 |
0.214 |
0.179 |
0.073 |
0.198 |
-0.016 |
-0.001 |
1.000 |
|
(0.000) |
(0.000) |
(0.011) |
0.113 |
(0.000) |
(0.000) |
(0.000) |
(0.000) |
(0.000) |
(0.053) |
(0.935) |
Note: p values are in parentheses.
4.2. Empirical Results
The results of the multivariate regression analysis are shown in Tables 4, 5, 6, 7, and 8. In Table 4, we test H1, the effect of ESG performance on FRQ. We must recall that it is argued that there is a positive relationship between the level of ESG and FRQ. As predicted, coefficients for the FRQ and ESG relationship are observed to be positive in all four models. More specifically, ESG is positive and significant at the 1 percent level for all FRQ proxies in the sample. In other words, higher ESG performance has an increasing effect on FRQ. Thus, these empirical results are consistent with hypothesis H1 that a firm’s ESG performance has a significant and positive impact on FRQ.
With respect to hypothesis H1a, the results of the regression in Table 5 show a significant positive relationship between ENV and FRQ. We observe similar results from the regressions in Tables 7 for GOV. Thus, hypotheses H1a and H1c are supported. However, this is not the case for SOC. Table 6 presents the correlation coefficients and significance values for SOC. We assume that SOC can have impact on FRQ. However, regression results reveal that there is no significant relationship between SOC and FRQ, with the exception of FRQ1 at the 10 percent level. In this case, although the coefficient is positive in all models, H1b hypothesis is only partially supported because it is not statistically significant in three models. The sign of the coefficients on control variables is generally consistent with the existing literature. Findings show that SIZE and FIRM AGE are positively related to FRQ proxies, thereby suggesting that larger and older firms offer higher quality of financial reporting.
Table 4. Effects of ESG scores on FRQ
|
|
FRQ1 |
FRQ2 |
FRQ3 |
FRQ4 |
|
ESG |
0.00847*** |
0.00577*** |
0.00847** |
0.00732** |
|
|
(0.00249) |
(0.00183) |
(0.00337) |
(0.00323) |
|
SIZE |
0.0019*** |
0.00156*** |
0.00397*** |
0.00363*** |
|
|
(0.00052) |
(0.0003) |
(0.0007) |
(0.00068) |
|
ROA |
0.00081*** |
-0.00021** |
-0.00025 |
-0.00023 |
|
|
(0.00019) |
(0.00008) |
(0.00015) |
(0.00015) |
|
LEV |
-0.002 |
-0.00148 |
-0.00637 |
-0.00458 |
|
|
(0.00264) |
(0.00155) |
(0.00429) |
(0.00404) |
|
FIRM_AGE |
0.00685*** |
0.00643*** |
0.00599*** |
0.00593*** |
|
|
(0.001) |
(0.00066) |
(0.00129) |
(0.00125) |
|
Constant |
-0.04574*** |
-0.02867*** |
-0.05457*** |
-0.05102*** |
|
|
(0.0079) |
(0.00496) |
(0.01065) |
(0.01043) |
|
Observations |
14063 |
14063 |
12054 |
12054 |
|
R-squared |
0.16805 |
0.15505 |
0.10655 |
0.12834 |
|
Year effects |
YES |
YES |
YES |
YES |
|
Industry effects |
YES |
YES |
YES |
YES |
|
Country effects |
YES |
YES |
YES |
YES |
Robust standard errors are in parentheses
*** p<0.01, ** p<0.05, * p<0.1
Table 5. Effects of ENV scores on FRQ
|
|
(1) |
(2) |
(3) |
(4) |
|
FRQ1 |
FRQ2 |
FRQ3 |
FRQ4 |
|
|
ENV |
0.00716*** |
0.00373** |
0.00589** |
0.00598** |
|
|
(0.00202) |
(0.00147) |
(0.00264) |
(0.00252) |
|
SIZE |
0.00189*** |
0.00162*** |
0.00404*** |
0.00364*** |
|
|
(0.00052) |
(0.00031) |
(0.0007) |
(0.00068) |
|
ROA |
0.00081*** |
-0.00021** |
-0.00025 |
-0.00023 |
|
|
(0.00019) |
(0.00008) |
(0.00015) |
(0.00015) |
|
LEV |
-0.00208 |
-0.00138 |
-0.00631 |
-0.00465 |
|
|
(0.00265) |
(0.00156) |
(0.00429) |
(0.00403) |
|
FIRM_AGE |
0.00684*** |
0.00646*** |
0.00602*** |
0.00593*** |
|
|
(0.00101) |
(0.00067) |
(0.00128) |
(0.00125) |
|
Constant |
-0.0451*** |
-0.02886*** |
-0.05462*** |
-0.05055*** |
|
|
(0.00801) |
(0.00503) |
(0.01076) |
(0.01054) |
|
Observations |
14063 |
14063 |
12054 |
12054 |
|
R-squared |
0.16816 |
0.15486 |
0.10644 |
0.12837 |
|
Year effects |
YES |
YES |
YES |
YES |
|
Industry effects |
YES |
YES |
YES |
YES |
|
Country effects |
YES |
YES |
YES |
YES |
Robust standard errors are in parentheses
*** p<0.01, ** p<0.05, * p<0.1
Table 6. Effects of SOC scores on FRQ
|
|
(1) |
(2) |
(3) |
(4) |
|
FRQ1 |
FRQ2 |
FRQ3 |
FRQ4 |
|
|
SOC |
0.00363* |
0.00173 |
0.00386 |
0.0026 |
|
|
(0.00204) |
(0.00144) |
(0.00294) |
(0.00282) |
|
SIZE |
0.0021*** |
0.00174*** |
0.00416*** |
0.00384*** |
|
|
(0.00052) |
(0.0003) |
(0.00071) |
(0.00069) |
|
ROA |
0.0008*** |
-0.00022** |
-0.00026* |
-0.00023 |
|
|
(0.00019) |
(0.00008) |
(0.00015) |
(0.00015) |
|
LEV |
-0.00156 |
-0.00108 |
-0.00595 |
-0.00412 |
|
|
(0.00265) |
(0.00156) |
(0.00428) |
(0.00402) |
|
FIRM_AGE |
0.00695*** |
0.00652*** |
0.00609*** |
0.00604*** |
|
|
(0.00101) |
(0.00066) |
(0.00129) |
(0.00125) |
|
Constant |
-0.04683*** |
-0.02985*** |
-0.05562*** |
-0.05238*** |
|
|
(0.00806) |
(0.00502) |
(0.01096) |
(0.01074) |
|
Observations |
14063 |
14063 |
12054 |
12054 |
|
R-squared |
0.16753 |
0.15454 |
0.1062 |
0.12801 |
|
Year effects |
YES |
YES |
YES |
YES |
|
Industry effects |
YES |
YES |
YES |
YES |
|
Country effects |
YES |
YES |
YES |
YES |
Robust standard errors are in parentheses
*** p<0.01, ** p<0.05, * p<0.1
Table 7. Effects of GOV scores on FRQ
|
|
(1) |
(2) |
(3) |
(4) |
|
FRQ1 |
FRQ2 |
FRQ3 |
FRQ4 |
|
|
GOV |
0.0044** |
0.00478*** |
0.00545** |
0.00454** |
|
|
(0.00182) |
(0.00134) |
(0.00234) |
(0.00225) |
|
SIZE |
0.0022*** |
0.00171*** |
0.00424*** |
0.00387*** |
|
|
(0.00047) |
(0.00028) |
(0.00063) |
(0.00061) |
|
ROA |
0.0008*** |
-0.00021** |
-0.00026* |
-0.00023 |
|
|
(0.00019) |
(0.00008) |
(0.00015) |
(0.00015) |
|
LEV |
-0.0013 |
-0.00109 |
-0.00568 |
-0.00397 |
|
|
(0.00265) |
(0.00155) |
(0.00432) |
(0.00407) |
|
FIRM_AGE |
0.00701*** |
0.00652*** |
0.00614*** |
0.00607*** |
|
|
(0.001) |
(0.00066) |
(0.00127) |
(0.00123) |
|
Constant |
-0.04917*** |
-0.03108*** |
-0.05816*** |
-0.05412*** |
|
|
(0.00766) |
(0.00485) |
(0.01017) |
(0.00997) |
|
Observations |
14063 |
14063 |
12054 |
12054 |
|
R-squared |
0.1677 |
0.15524 |
0.10644 |
0.12823 |
|
Year effects |
YES |
YES |
YES |
YES |
|
Industry effects |
YES |
YES |
YES |
YES |
|
Country effects |
YES |
YES |
YES |
YES |
Standard errors are in parentheses
*** p<0.01, ** p<0.05, * p<0.1
ESG investments and behavior are costly and time-consuming, and this is because their impact may be lagged. Indeed, the analyses were performed by using one-year lagged ESG variables. Moreover, the United States and Japan may be considered to have a dominant position over other countries, which would have an impact on the results. For this reason, the models were re-run by excluding the United States and Japan. The untabulated results of these analyses are qualitatively similar to the reported results.
5. Concluding Remarks
This study investigates the relationship between financial reporting quality and ESG performance at the international level across 2009 firms from 2010 to 2017. The results reveal that the firms’ ESG performance increases FRQ. Environmental and governance scores have a similar effect on FRQ as the ESG score. The study also finds that the combined ESG score has an increasing effect on FRQ. However, surprisingly, similar results were not observed in the social score. Only the FRQ1 model achieved weak evidence for social score. In other models, the results for the social score are insignificant, but the direction of the relationship appears to be positive. In terms of firm reputation and sustainability, the social score is very important for information users. However, according to our results, it is not possible to argue that the social score has an effect on the FRQ. Further research is needed to clarify this effect. Findings achieved in this study show that firms with higher ESG performance have higher FRQ. Hence, an increase in the firms’ ESG scores is a factor increasing the quality of their financial reports. These findings demonstrate that firms do not use ESG for misleading purposes and that ESG increases FRQ. The study provides supporting information for the stakeholder theory and the legitimacy theory. The findings refute the importance of self-interest according to the agency theory and support that stakeholders receive positive signals regarding the accuracy of information. Therefore, ESG and pillars are not only effective at increasing FRQ, but also at providing legitimacy to firms, improving their reputation, and lowering agency costs.
These findings are particularly important for researchers, regulators, and market participants. In general, taking ESG into account is critical for firms to continue their operations for a long time, to increase investor trust, and to protect the interests of stakeholders. Based on these results, it may be suggested to regulators that ESG reports, which are usually published voluntarily alongside financial reports, be made compulsory over time.
This paper has several limitations, including the use of Asset4’s ESG data and the coverage of a limited time period (2010–2017). As Velte (2019) also underlines, the impact of increased stakeholder management incentives following the 2008–2009 financial crisis is likely to be more pronounced in longer-term studies. Further research using ESG performance or disclosure scores from databases such as Bloomberg, KLD, and Sustainalytics will contribute to clarify the relationship between FRQ and ESG. In order to confirm the study results, future research should aim to analyze whether the relationships found here regarding FRQ and ESG performance are still met.
References
Al-Dmour, A. H., Abbod M., & Al-Balqa, N., S. (2018). The impact of the quality of financial reporting on non-financial business performance and the role of organizations demographic‘ attributes (type, size and experience). Academy of Accounting and Financial Studies Journal, 22(1), 1-16.
Al-Haddad, L., & Whittington, M. (2019). The impact of corporate governance mechanisms on real and accrual earnings management practices: evidence from Jordan. Corporate Governance: The International Journal of Business in Society, 19(6), 1167-1186.
Almahrog, Y., Aribi, Z. A., & Arun, T. (2018). Earnings management and corporate social responsibility: UK evidence. Journal of Financial Reporting and Accounting, 6(2), 311-332.
Aouadi, A., & Marsat, S. (2018). Do ESG controversies matter for firm value? Evidence from international data. Journal of Business Ethics, 151(4), 1027-1047.
Arayssi, M., Jizi, M., & Tabaja, H. H. (2020). The impact of board composition on the level of ESG disclosures in GCC countries. Sustainability Accounting, Management and Policy Journal, 11(1), 137-161.
Arvidsson, S. (2010). Communication of corporate social responsibility: A study of the views of management teams in large companies. Journal of Business Ethics, 96(3), 339-354.
Baraibar-Diez, E., & Odriozola, D. M. (2019). CSR committees and their effect on ESG performance in UK, France, Germany, and Spain. Sustainability, 11(18), 5077.
Becker, C. L., DeFond, M. L., Jiambalvo, J., & Subramanyam, K. R. (1998). The effect of audit quality on earnings management. Contemporary accounting research, 15(1), 1-24.
Biddle, G., Hilary, G., & Verdi, R. S. (2009). How does financial reporting quality relate to investments efficiency?. Journal of Accounting and Economics, 48(2–3), 112–131.
Boubakri, N., El Ghoul, S., Wang, H., Guedhami, O., & Kwok, C. C. (2016). Cross-listing and corporate social responsibility. Journal of Corporate Finance, 41, 123-138.
Bozzolan, S., Fabrizi, M., Mallin, C. A., & Michelon, G. (2015). Corporate social responsibility and earnings quality: International evidence. The International Journal of Accounting, 50(4), 361-396.
Bushman, R. M., & Smith, A. J. (2001). Financial accounting information and corporate governance. Journal of accounting and Economics, 32(1-3), 237-333.
Cavaco, S., & Crifo, P. (2014). CSR and financial performance: Complementarity between environmental, social and business behaviours. Applied Economics, 46(27), 3323-3338.
Chandar, N., Chang, H., & Zheng, X. (2012). Does overlapping membership on audit and compensation committees improve a firm’s financial reporting quality?. Review of Accounting and Finance, 11(2), 141-165.
Chen, F., Hope, O. K., Li, Q., & Wang, X. (2011). Financial reporting quality and investment efficiency of private firms in emerging markets. The Accounting Review, 86(4), 1255-1288.
Chen, H., Tang, Q., Jiang, Y., & Lin, Z. (2010). The role of international financial reporting standards in accounting quality: Evidence from the European Union. Journal of international financial management & accounting, 21(3), 220-278.
Cheng, B., Ioannou, I., & Serafeim, G. (2014). Corporate social responsibility and access to finance. Strategic management journal, 35(1), 1-23.
Cheng, C. L., & Kung, F. H. (2016). The effects of mandatory corporate social responsibility policy on accounting conservatism. Review of Accounting and Finance, 15(1), 2-20.
Chih, H. L., Shen, C. H., & Kang, F. C. (2008). Corporate social responsibility, investor protection, and earnings management: Some international evidence. Journal of Business Ethics, 79(1-2), 179-198.
Chiu, T. K., & Wang, Y. H. (2015). Determinants of social disclosure quality in Taiwan: An application of stakeholder theory. Journal of business ethics, 129(2), 379-398.
Choi, B. B.,Lee, D., & Park, Y. (2013). Corporate Social Responsibility, Corporate Governance and Earnings Quality: Evidence from Korea. Corporate Governance: An International Review, 21(5), 447-467.
Choi, T. H., & Pae, J. (2011). Business ethics and financial reporting quality: Evidence from Korea. Journal of Business Ethics, 103(3), 403-427.
Chouaibi, Y., & Zouari, G. (2021). The effect of corporate social responsibility practices on real earnings management: evidence from a European ESG data. International Journal of Disclosure and Governance, 1-20.
Christensen, J. (2010). Conceptual frameworks of accounting from an information perspective. Accounting and Business Research, 40(3), 287-299.
Chung, H., & Kallapur, S. (2003). Client importance, nonaudit services, and abnormal accruals. The Accounting Review, 78(4), 931-955.
Dechow, P. M., & Dichev, I. D. (2002). The quality of accruals and earnings: The role of accrual estimation errors. The accounting review, 77(s-1), 35-59.
Dechow, P. M., & Skinner, D. J. (2000). Earnings management: Reconciling the views of accounting academics, practitioners, and regulators. Accounting horizons, 14(2), 235-250.
Dechow, P. M., Sloan, R. G., & Sweeney, A. P. (1995). Detecting earnings management. The Accounting review, 193-225.
Dhaliwal, D. S., Radhakrishnan, S., Tsang, A., & Yang, Y. G. (2012). Nonfinancial disclosure and analyst forecast accuracy: International evidence on corporate social responsibility disclosure. The accounting review, 87(3), 723-759.
Donaldson, T., & Preston, L. E. (1995). The stakeholder theory of the corporation: Concepts, evidence, and implications. Academy of management Review, 20(1), 65-91.
Dorfleitner, G., Halbritter, G. & Nguyen, M. (2015). Measuring the level and risk of corporate responsibility – An empirical comparison of different ESG rating approaches. Journal of Asset Management, 16 (7), 450-466.
Drempetic, S., Klein, C., & Zwergel, B. (2019). The influence of firm size on the ESG score: Corporate sustainability ratings under review. Journal of Business Ethics, 167, 1-28.
Dyck, A., Lins, K. V., Roth, L., & Wagner, H. F. (2019). Do institutional investors drive corporate social responsibility? International evidence. Journal of Financial Economics, 131(3), 693-714.
Freeman, R. E. (1984). Strategic management: A stakeholder approach. Cambridge university press.
Freeman, R. E., & Dmytriyev, S. (2017). Corporate social responsibility and stakeholder theory: Learning from each other. Symphonya. Emerging Issues in Management, (1), 7-15.
García-Sánchez, I. M., & García-Meca, E. (2017). CSR engagement and earnings quality in banks. The moderating role of institutional factors. Corporate Social Responsibility and Environmental Management, 24(2), 145-158.
Global Sustainability Standards Board GRI 307: Environmental Compliance 2016
Gomariz, M. F. C., & Ballesta, J. P. S. (2014). Financial reporting quality, debt maturity and investment efficiency. Journal of banking & finance, 40, 494-506.
Gray, R. (2005). Taking a long view on what we now know about social and environmental accountability and reporting. Electronic Journal of Radical Organisation Theory, 9(1), 6-36.
Gray, R., Owen, D. and Maunders, K. (1988). Corporate social reporting: emerging trends in accountability and the social contract. Accounting, Auditing & Accountability Journal, 1(1), 6-20.
Hair Jr. J.F., Black, W.C., Babin, B.J., & Anderson R.E. (2009). Multivariate Data Analysis: A Global Perspective. Upper Saddle River: Prentice Hall,
Hanlon, M., Hoopes, J. L., & Shroff, N. (2014). The effect of tax authority monitoring and enforcement on financial reporting quality. The Journal of the American Taxation Association, 36(2), 137-170.
Healy, P. M., & Palepu, K. G. (2001). Information asymmetry, corporate disclosure, and the capital markets: A review of the empirical disclosure literature. Journal of accounting and economics, 31(1-3), 405-440.
Hope, O. K., Thomas, W. B., & Vyas, D. (2013). Financial reporting quality of US private and public firms. The Accounting Review, 88(5), 1715-1742.
Hughes, P. J. (1986). Signalling by direct disclosure under asymmetric information. Journal of accounting and economics, 8(2), 119-142.
Jensen, M. C. (1994). Self-interest, altruism, incentives, and agency theory. Journal of applied corporate finance, 7(2), 40-45.
Jones, J. J. (1991). Earnings management during import relief investigations. Journal of accounting research, 29(2), 193-228.
Joshi, P. L., & Gao, S. S. (2009). Multinational corporations’ corporate social and environmental disclosures (CSED) on web sites. International journal of commerce and management,19(1), 27-44.
Kim, Y., Park, M. S., & Wier, B. (2012). Is earnings quality associated with corporate social responsibility?. The Accounting Review, 87(3), 761-796.
Kothari, S. P., Leone, A. J., & Wasley, C. E. (2005). Performance matched discretionary accrual measures. Journal of accounting and economics, 39(1), 163-197.
Krishnan, J., Wen, Y., & Zhao, W. (2011). Legal expertise on corporate audit committees and financial reporting quality. The Accounting Review, 86(6), 2099-2130.
Laksmana, I., & Yang, Y. W. (2009). Corporate citizenship and earnings attributes. Advances in Accounting, 25(1), 40-48.
Lee, D. (2017). Corporate social responsibility and management forecast accuracy. Journal of Business Ethics, 140(2), 353-367.
Leftwich, R. (1980). Market failure fallacies and accounting information. Journal of Accounting and Economics, 2(3), 193-211.
Lindblom, C. K. (1994). The implications of organizational legitimacy for corporate social performance and disclosure. In Critical Perspectives on Accounting Conference, New York, 1994.
Lobo, G. J., Xie, Y., & Zhang, J. H. (2018). Innovation, financial reporting quality, and audit quality. Review of Quantitative Finance and Accounting, 51(3), 719-749.
Martínez-Ferrero, J., Gallego-Álvarez, I., & García-Sánchez, I. M. (2015a). A bidirectional analysis of earnings management and corporate social responsibility: the moderating effect of stakeholder and investor protection. Australian Accounting Review, 25(4), 359-371.
Martínez-Ferrero, J., Garcia-Sanchez, I. M., & Cuadrado-Ballesteros, B. (2015b) Effect of Financial Reporting Quality on Sustainability Information Disclosure, Corporate Social Responsibility and Environmental Management, 22, 45– 64.
McNichols, M. F. (2002). Discussion of the quality of accruals and earnings: The role of accrual estimation errors. The accounting review, 77(s-1), 61-69.
Miller, J. L. (2002). The board as a monitor of organizational activity: The applicability of agency theory to nonprofit boards. Nonprofit management and leadership, 12(4), 429-450.
Mohmed, A., Flynn, A., & Grey, C. (2019). The link between CSR and earnings quality: evidence from Egypt. Journal of Accounting in Emerging Economies. 10(1), 1-20.
Morris, R. D. (1987). Signalling, agency theory and accounting policy choice. Accounting and business Research, 18(69), 47-56.
Muttakin, M. B., Khan, A., & Azim, M. I. (2015). Corporate social responsibility disclosures and earnings quality. Managerial Auditing Journal, 30(3), 277-298.
Mutuc, E. B., Lee, J. S., & Tsai, F. S. (2020). Corporate Social Responsibility and Earnings Management: Evidence from Controversial and Non-Controversial Sectors in Asia. DLSU Business & Economics Review, 29(2), 17-28.
Nasdaq. (2019). ESG reporting guide 2.0, A support resource for companies, Nasdaq, 1-38.
Palacios-Manzano, M., Gras-Gil, E., & Santos-Jaen, J. M. (2019). Corporate social responsibility and its effect on earnings management: an empirical research on Spanish firms. Total Quality Management & Business Excellence, 1-17.
Petersen, M. A. (2009). Estimating standard errors in finance panel data sets: Comparing approaches. The Review of financial studies, 22(1), 435-480.
Prior, D., Surroca, J., & Tribó, J. A. (2008). Are socially responsible managers really ethical? Exploring the relationship between earnings management and corporate social responsibility. Corporate Governance: An International Review, 16(3), 160-177.
Refinitiv (2019). Environmental, Social and Governance (ESG) Scores from Refinitiv
Rezaee, Z. (2016). Business sustainability research: A theoretical and integrated perspective. Journal of Accounting Literature, 36, 48–64.
Rezaee, Z., & Tuo, L. (2019). Are the quantity and quality of sustainability disclosures associated with the innate and discretionary earnings quality?. Journal of Business Ethics, 155(3), 763-786.
Richardson, R., Tuna, I., & Wu, M. (2002). Predicting earnings management: the case of earnings restatements, Working Paper, University of Michigan Business School.
Salewski M, & Zülch H. (2014). The impact of corporate social responsibility (CSR) and financial reporting quality. evidence from european blue chips. HHL Working Paper No. 112.
Scholtens, B., & Kang, F. C. (2013). Corporate social responsibility and earnings management: Evidence from Asian economies. Corporate Social Responsibility and Environmental Management, 20(2), 95-112.
Suchman, M. C. (1995). Managing legitimacy: Strategic and institutional approaches. Academy of management review, 20(3), 571-610.
Sun, N., Salama, A.<, Hussainey, K., & Habbash, M. (2010). Corporate environmental disclosure, corporate governance and earnings management. Managerial Auditing Journal, 25(7), 679-700.
Sweeney, A. P. (1994). Debt-covenant violations and managers’ accounting responses. Journal of accounting and Economics, 17(3), 281-308.
Tang, Q., Chen, H., & Lin, Z. (2016). How to measure country-level financial reporting quality?. Journal of Financial Reporting and Accounting, 14(2), 230-255.
Velayutham, E. (2018). Sustainability disclosure and earnings management. In Research handbook of finance and sustainability. Edward Elgar Publishing.
Velte, P. (2019). The bidirectional relationship between ESG performance and earnings management–empirical evidence from Germany. Journal of Global Responsibility, 10(4), 322-338.
Wang, S. (2015). Literature review of corporate social responsibility. in Chinese strategic decision-making on CSR, Springer, 7-28.
Wang, X., Cao, F., & Ye, K. (2018). Mandatory corporate social responsibility (CSR) reporting and financial reporting quality: Evidence from a quasi-natural experiment. Journal of Business Ethics, 152(1), 253-274.
Watson, L. (2015). Corporate social responsibility, tax avoidance, and earnings performance. The Journal of the American Taxation Association, 37(2), 1-21.
Watts, R. L., & Zimmerman, J. L. (1990). Positive accounting theory: a ten year perspective. The Accounting Review, 131-156.
Wijnberg, N. M. (2000). Normative stakeholder theory and Aristotle: The link between ethics and politics. Journal of Business Ethics, 25(4), 329-342.
Wooldridge, J. M. (2010). Econometric analysis of cross section and panel data. MIT press.
Yoon, B., Kim, B., & Lee, J. H. (2019). Is Earnings Quality Associated with Corporate Social Responsibility? Evidence from the Korean Market. Sustainability, 11(15), 4116.
Zhang, J. Q., Zhu, H., & Ding, H. B. (2013). Board composition and corporate social responsibility: An empirical investigation in the post Sarbanes-Oxley era. Journal of business ethics, 114(3), 381-392.