Ekonomika ISSN 1392-1258 eISSN 2424-6166
2022, vol. 101(1), pp. 102–124 DOI: https://doi.org/10.15388/Ekon.2022.101.1.6
Economic Performance and Political Choice in Ukraine
Sergii Slukhai
Faculty of Economics, Taras Shevchenko National University of Kyiv, Ukraine
Email: sslukhai@knu.ua
ORCiD: 0000-0001-8839-2042
Nataliia Slukhai
Institute of Philology, Taras Shevchenko National University of Kyiv, Ukraine
Email: n.slukhai@knu.ua
ORCiD: 000-0003-4428-5514
Olena Bazhenova
Faculty of Economics, Taras Shevchenko National University of Kyiv, Ukraine
Email: olenabazhenova@knu.ua
ORCiD: 0000-0003-3197-8426
Abstract. In this article the economic performance as a factor that determined the political choice of Ukrainians has been analyzed. It is proven by a panel model that, unlike the countries with developed democracies, a retrospective economic vote in presidential elections was not observed in Ukraine; it turned out to be prospective instead with regard to the last (year 2019) presidential election. The authors presented a set of reasons which could explain such situation: lack of democratic experience, relying on heuristics and emotions, low public mood among the others. It has been demonstrated that Ukrainians’ political choice in 2019 has some consequences for the economy, which may contribute to the loss of a nation’s development guidelines for a certain period of time and subsequent social disappointment.
Keywords: economic vote, political choice, Ukraine, panel data models
___________
Received: 05/10/2021. Revised: 10/01/2022. Accepted: 05/03/2022
Copyright © 2022 Sergii Slukhai, Nataliia Slukhai, Olena Bazhenova. Published by Vilnius University Press
This is an Open Access article distributed under the terms of the Creative Commons Attribution License, which permits unrestricted use, distribution, and reproduction in any medium, provided the original author and source are credited.
1. Introduction
The formation of inclusive political institutions is an essential prerequisite for the creation of effective economic institutions that predetermine the economic development of a nation. The election of certain politicians in the course of democratic elections can have a significant impact on the development of the nation and economy through the possible reshaping of the institutions of the public sector following the election and its efficiency. Thus, it is important to analyze the collective choice expressed in voting for parties and individual politicians because it can change the vector of societal development with the respective economic and social consequences.
In the recent decades, the political choice has become the subject of intensive research of economists. It appears that the political choice of an individual can be explained by using tools of economic analysis; it has become an intensively treated subject of the modern theory of public choice.
It is believed that the political choice is driven by the desire to satisfy individual interests. At the same time, it is obvious that even if, in the course of economic choice, an individual is not inclined to act rationally in many cases, then, with regard to the political sphere, the choice of the worse (if not the worst) alternative is a common case. One of the ontogenetically formed reasons for this is that an individual does not feel the connection of his action with the possible consequences, and therefore does not seek to achieve a socially desirable result. Nevertheless, in the course of repeating acts of choice, members of the society can ‘learn’ how to cast the vote in order to move the nation in the desired direction with progress in shaping and maturing the democratic institutions.
The transition nations including Ukraine deliver an exciting possibility to test to what extent the regularities observed in the voter behavior in mature democracies, especially the economic vote, are present in the context of immature ones where the citizens have no big trust towards political institutions, where weak economic institutions are present and economy demonstrates no more than mediocre performance.
Analyzing the Ukrainian presidential election outcomes gives a good possibility to find out whether economic performance has influence on the vote outcome. The relation of the national economic performance and the respective electoral results gained by the incumbent president could give an idea how the good or bad governance could be rewarded by the voters.
The purpose of this article is to shed light on the factors affecting the political choice in a specific transition nation, which involves addressing several research questions. Firstly, we test whether the Ukrainian voter fits into the pattern of the economic vote (EV). Secondly, we determine which other factors except for the economic ones might define the political choice. Thirdly, we clarify the role that the information imperfection plays in the presentation of the economy performance in voting.
The article is structured in the following way. The Introduction presents the context and topicality of the study. In Chapter 2, we make a short overview of the public choice literature which delivers the methodological basis for our study. Chapter 3 describes the basic characteristics of methodology applied by the authors. Chapter 4 is devoted to the estimation of a model constructed with the use of panel data and the results of a model estimation for a separate election (2019) with reference to the economic factors that could or could not explain the vote outcome. In Chapter 5, we present some discussion issues as a reflection of the modeling results. The final chapter delivers some conclusions and possible directions for further research.
2. Literature overview
Many economists have for centuries been expressing doubts about the ability of individuals to act rationally in the public sector. This specifics determines the stochastic outcome of the choice due to the individual’s low responsibility in voting and the results of the election, the subsequent coercion to consume an undesirable alternative, which initially questions the rationality of the voter’s choice; finally, there is no connection between the preferences and the results of the voter’s actions observed (Brennan and Buchanan, 1984; Brennan, 2008). Economists came to conclusion that it is impossible to theoretically explain the voter behavior basing on the rationality paradigm by pointing out “a paradox of voting” (Downs, 1957). Awareness of an individual’s irrationality led further to the emergence of a radical concept of ‘rational irrationality’, the essence of which is that an individual is systematically irrational in his political choice, which can explain the unsatisfactory results of the functioning of democratic institutions that are often observed (Caplan, 2006).
However, the main practical issue towards which the researchers directed their efforts was the analysis of ‘how’ the voter actually casts the vote, i.e., the factors that determine or explain the collective choice. To date, two main differing approaches have been documented: (1) social-psychological voting, and (2) issue voting; the latter is widely employed by the economists and political scientists who have empirically analyzed the political choice acts since early 1970s.
The issue voting approach delivers a specific toolkit for analyzing the voter choice involving preferences and a specific type of the utility function. It is assumed that the electoral result of a candidate (party) may be well explained by using the function of voting/popularity, the VP-function, the value of which is determined by a set of economic and political variables; this function is widely used to test the hypothesis of ‘economic vote’ (EV) for the outcomes of various types of elections.
Since the individual’s preferences in the political market should be in a certain relation to their needs, hence the economic factor should first of all affect the choice. This EV concept has been elaborated over the past few decades in numerous papers starting with a study by G. Kramer (1971). The idea behind this approach is straightforward: the results achieved in economy are one of the decisive motives determining the vote just because “economy is everybody’s business;” the voter is inclined to support those during whose rule the economy showed (or was highly likely to show) positive results, and, conversely, refuse to support them in the opposite case.
A generalization of numerous studies carried out in various countries gave the foundation to highlight some empirical regularities that are characteristic for EV. These include voter reflections regarding the dynamics of unemployment and inflation; the sociotropic/egotropic factor (taking into account the social and/or personal well-being); the voter’s myopia (systematic underestimation of more distant economic events); retrospectivity (voters react slightly more strongly to past events than to those expected in the future); insufficient economic knowledge of the common people who are the majority when voting; the grievance asymmetry (voters punish governments for bad economic results more than they reward them for commensurate good ones); the cost of ruling, i.e., lower inclination to vote for the incumbent (Nannestad and Paldam, 1994; Dassoneville and Lewis-Beck, 2014). As it can be seen from this list, the voter’s choice is largely preconditioned not only by some objective economic and political factors, but, to a great extent, by the comprehension of information and the cognitive effects explained by psychology; this conclusion gives way to applying the behaviorist approach and to making a political choice into a subject of the emerging behavioral political economy or the behavioral theory of the collective action (Ostrom, 1998).
According to M. Lewis-Beck, “the economic vote works pretty much the same way, regardless of the nation’s level of economic development” (Lewis-Beck and Stegmaier, 2019: 258). However, EV in the post-socialist countries involves certain specificity associated with the fact that these nations have been undergoing radical social and economic reforms, in the course of which, a significant part of the population has suffered losses. This may lead to the outcome that successful reformers will get insufficient popular support; consequently, the economic voter in post-socialist countries historically appeared to be prospective rather than retrospective. When explaining the election outcomes in such countries, the factors that are not of great importance in the (more) developed nations should be taken into account, such as perceptions of the level of corruption and the degree of the uneven distribution of income (Jastremskas et al., 2019). This could mean that, in such countries, the subjective factors are relatively more influential (e.g., irrelevant perceptions of the societal realities) than in the (more) mature democracies. At the same time, in the long run, the EV importance looks to increase due to the growing awareness of citizens regarding the functioning of public institutions and an increased confidence in them (Lewis-Beck and Ratto, 2013).
We assume that an approach relying on the VP-model fits well in order to understand to what extent the voter takes the economic performance achieved under leadership of some politicians or parties into account. Such kind of study has not been undertaken in Ukraine previously.
3. Methodology and data
In order to address the research questions, panel data of the Ukrainian presidential elections was analyzed. By having in mind several reasons, we selected only three out of seven elections which have been held since Ukraine gained independence.
First, in order to check the validity of the EV hypothesis, only those elections were selected in which the incumbent president participated; this provision would allow assessing whether the economic factor was influential. According to this criterion, only the elections carried out in 1994, 1999, 2010, and 2019 satisfied our condition (the other ones were open seat). Only one out of the selected elections (1999) was won by the incumbent, whereas the other three were lost.
Second, the 1994 election was excluded from our analysis due to systematic lack of the basic data on economy needed for testing the EV hypothesis.
Third, as the presidential elections in Ukraine usually go in two rounds, it was decided to utilize the data on the vote only of the first round because we believe that the true voter preferences could be revealed only where the voter oversees the whole range of candidates competing for the top public position. In the second election round, the voter’s true preferences could be much less relevant because they have to cast the vote in favor of one out of two position seekers both of whom could be relatively far from the desired option, or else the voter just ignores the second round.
We tested the hypothesis of the retrospectiveness of the ‘economic vote’ for Ukraine on the basis of the macro-approach by using the national election data (the first round) as publicized by the Central Election Commission in the regional cross-cut. In contrast to the models where quarterly economic indicators were applied, we used the annual ones, since there are no statistical data available in Ukraine to build VP-models based on the regular voter polls.
The target variable was a proportion of the votes cast for the candidate in each region; thus, the VP-function we tested belongs to the regional cross-section functions (see Abrams and Butkiewicz, 1995).
According to the methodology that many scholars followed (Frey and Schneider, 1975; Stegmaier and Lewis-Beck, 2009; Valdini and Lewis-Beck, 2018), the dependent variable was a share of the votes cast for the incumbent in the first round of elections; a set of explanatory variables included the economic ones lagged by one year and the political ones, such as the percentage of the vote received by the incumbent in the previous elections as well as the external disturbance factor (the war against Russia).
The economic factors include the regional level indicators of the gross regional product (GRP), the real disposable income (RI), and unemployment (U). GRP is believed to be a general indicator of the region’s economic performance and is calculated as a sum of the gross value added of all types of economic activity; thus its relative dynamics seem to adequately reflect the level of the national economic performance perceived by the voter dwelling in the respective location (the sociotropic motive). The change in RI adequately represents the voter’s egotropic motive while retrospectively evaluating the incumbent’s performance. The annual reviews published by the State Statistics Service of Ukraine served as a data source for the main economic indicators.
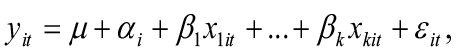
The econometric toolkit used for estimating the relationship between the incumbent’s vote share and the explanatory variables along with the control variables is the panel data models technique described as follows:
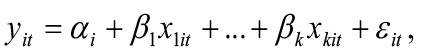
where x1it, .., xkit − explanatory variables not including an intercept; αi − intercepts which differ for each object of observation i; εit − independent, equally distributed random variables with zero mean and variance σ2ε .
With including a dummy variable for each object of observation, this model can be rewritten in the following form:
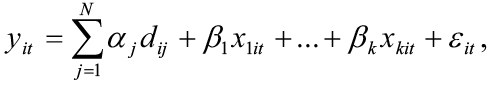
dij = 1 in the case of i = j, and dij = 0 otherwise. Here N is the number of dummies in the model.
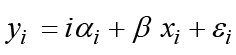
Moreover, we may represent the model as follows:
 .
.
Here yi and xi denote vectors for the i-th object of observation ((T × 1) dimensions), i denotes the single vector of (T × 1) dimension, and εi is the perturbations’ vector of (T × 1) dimension.
In addition, the model can be rewritten in the matrix form:
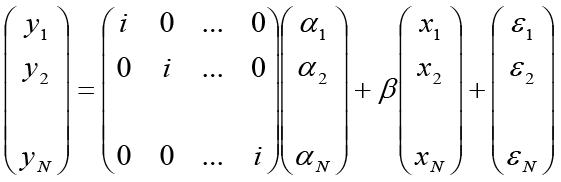
or as:
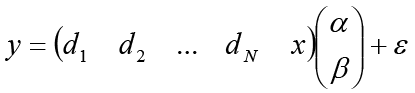
where di represents a dummy variable for the i-th object.
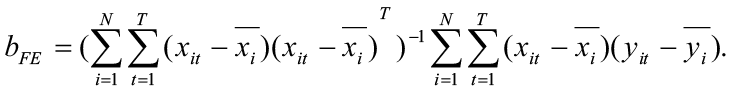
In turn, the estimates of β are fixed-effect estimates:
The random effects model is of the following form:
here µ denotes the intercept.
The model specification choice depends on the conclusions the researcher wants to draw from the evaluation.
Thus, it is preferable to use a model with fixed effects if needed to study the effects in a particular population and the peculiarities of observation’s objects. In turn, if the characteristics of the population are needed, it is recommended to choose a model with random effects.
Moreover, the Hausman criterion is used as the criterion for selecting the specification of the panel data model. This criterion is based on testing the correlation between αi and xit. Thus, the null hypothesis is that αi and xit do not correlate.
So, for this purpose, the Hausman statistics is calculated:
 ,
,
where D(bFE) and D(bRE) denote estimates of the covariance matrices of the fixed and random effects model. The null hypothesis will not be rejected if the H statistic has an asymptotic distribution χ2 with the number of degrees of freedom k (k is the number of elements in the vector β).
In addition, we estimated the models constructed for each separate election (three in total). Special attention was given to the latest presidential election (2019) as its model demonstrated the most important characteristics giving a reason to suggest that, in the case of Ukraine, the EV hypothesis does not sustain.
In order to unveil the reasons for such specific results, we undertook analysis of the factors which could affect the specific election outcome.
While attempting to examine the relationship between the vote cast for the incumbent president and various economic/political indicators, we compiled a set of panel data for 27 regions of Ukraine including Kyiv City (Autonomous Republic of Crimea and Sevastopol City were excluded from the sample for elections in 2019 due to the fact that these territories were illegally annexed by the Russian Federation in 2014; the same relates to a part of Ukrainian territory in Donetsk and Luhansk regions which were occupied by the Russian Federation in 2014).
The description of the variables included in the models is presented in Table 1.
Table 1. Variables used in models
|
Variable |
Description |
Unit of measure |
|
Ve |
Votes cast for the incumbent in the first round of election in 1999, 2010, 2019 |
Percent to total for all candidates |
|
Ve-1 |
Vote cast for the incumbent in the previous election |
Percent to total for all candidates |
|
GRPt-1 |
Gross regional product in the year preceding the year of election |
Annual percentage growth rate |
|
RIt-1* |
Real disposable income in the year preceding the year of election |
Annual percentage growth rate |
|
Ut-1 |
Unemployment in the year preceding the year of election |
Annual percentage rate |
|
W** |
Indicates that the elections went during the periods of Russian military aggression in the East of Ukraine |
Dummy variable (1 – for the periods when Russian aggression occurs, 0 – otherwise) |
* Not used in the panel model due to insufficient data.
** Used only in the panel model.
The descriptive statistics of the panel model variables is presented in Table 1 in Annex, the correlation matrix is given in Table 2 in Annex.
4. Rational/irrational voting: testing economic voter hypothesis
The retrospective EV hypothesis is sustained in the case if coefficients by GRPt-1, RIt-1 appear to be positive and significant, by Ut-1 – negative and significant; in the opposite case, the hypothesis is not sustained.
In order to model the impact of economic and political indicators on the election results in Ukraine, a panel data model with fixed effects has been constructed on the grounds of the Redundant Fixed Effect-Likelihood Ratio test results (Table 2). The panel model is significant with a high value of R-squared, the normally distributed and non-correlated residuals. In addition, we included White cross-section standard errors&covariance so that to avoid possible heteroscedasticity.
Table 2. Panel model estimation results
|
Regressors |
Dependent variable Ve |
|
Ve-1 |
-0.064847* (-1.737140) |
|
GRPt-1 |
1.408378*** (11.37450) |
|
Ut-1 |
0.704106 (1.270510) |
|
W |
-15.12920*** (-6.811000) |
|
Intercept |
22.01034*** (3.524048) |
|
N |
79 |
|
R-squared |
0.875242 |
|
F-statistics |
11.22480 |
Note: t-statistic in parentheses, *** significance at 1%, ** significance at 5%, * significance at 10%.
The cross-section effects of the constructed fixed effects panel data model are presented in Table 3 in Annex. Based on these results, the western regions of Ukraine appeared to have higher propensity to vote for the incumbent (especially Lviv, Ivano-Frankivsk, Ternopil, Rivne, Chernivtsi, and Volyn) in comparison to other regions.
As the results of the model estimation demonstrate, such explanatory variables as the GRP growth rate in the previous year, the unemployment rate in the previous year and the war dummy are significant. The positive sign of the coefficient by GRPt-1 gives reason to suggest that the EV hypothesis is sustained, even though there is a need to assess its impact on the vote for the incumbent that could be done by the calculation of the elasticity coefficients.
The elasticity coefficients (showing the rate of influence of the factors on the dependent variable at means) were calculated for the significant factors included in the panel model. All of them appeared to be negative: the W variable has the highest elasticity coefficient (-0.26), the variable describing electoral volatility Vt-1 has the second highest elasticity coefficient (-0.18), and GRPt-1 exhibits a relatively low elasticity coefficient (-0.07). Their values mean that some political factors, especially the grievance associated with the war seem to be the most important decision criterion for the voter (and it is, of course, associated with the incumbent president). It also looks like the cost of ruling regularity also plays some role here as the share of the votes for the incumbent diminished in comparison with the previous election (this could also reflect the volatility of the voter preferences). The economic factor appears to be not so important for the voter, and, actually, its effect is opposite to the estimation results provided in Table 2.
What concerns the EV itself, the model shows that there is some potential that the Ukrainian voter will take the economic performance into account; however, the relative influence of this factor is quite low, as shown by the respective elasticity coefficient.
In order to see whether the role of factors could change from one election to another, we analyzed the vote in the course of each specific election that we selected. The results of our model estimation for the elections of 1999, 2009, and 2019 are presented in Table 3.
Table 3. The results of model estimation for the elections of 1999, 2009, and 2019
|
Regressors |
Model 1 |
Model 2 |
Model 3 |
|
Dependent variables |
|||
|
V1999 |
V2009 |
V2019 |
|
|
V1994 |
-0.426206** (-3.050312) |
||
|
V2004 |
0.171141** (2.666414) |
||
|
V2014 |
0.673927* (5.921993) |
||
|
GRP1998 |
0.232348 (0.369374) |
||
|
GRP2008 |
0.401144 (1.278269) |
||
|
GRP2018 |
-1.230063** (-2.228869) |
||
|
U1998 |
0.548816 (0.524116) |
||
|
U2008 |
-1.099533 (-1.135235) |
||
|
U2018 |
-0.006701 (-0.016745) |
||
|
RI2018 |
0.181235 (0.808125) |
||
|
Intercept |
47.75371* (3.484623) |
10.74467 (1.567160) |
-17.53476** (-2.276511) |
|
N |
27 |
27 |
25 |
|
R-squared |
0.517286 |
0.382354 |
0.683671 |
|
F-statistics |
5.893908 |
4.746047 |
10.80633 |
Note: t-statistic in parentheses, *** significance at 1%, ** significance at 5%, * significance at 10%. The W variable is excluded due to the fact that it affected the outcome of only year 2019 election.
The data above demonstrate that, in most cases, the economy performance did not mean much for the Ukrainian voter; only in the year 2019 election did it demonstrate some significance; however, the negative coefficient by GRP in Model 3 means that the voter acted just opposite to the EV hypothesis: the higher are the economic results, the lower is the support of the incumbent. This situation differs greatly from that in the (more) mature democracies; e.g., in Western Europe, EV has demonstrated noteworthy stability despite the ongoing economic turbulence (Talving, 2019).
The elasticity coefficients at means for significant coefficients of models 1–3 are presented in Table 4.
Table 4. Elasticity coefficients at means for specific election-based-models
|
Regressors |
Model 1 |
Model 2 |
Model 3 |
|
Elasticity coefficients at means |
|||
|
V1999 |
V2009 |
V2019 |
|
|
V1994 |
-0.56 |
||
|
V2004 |
1.79 |
||
|
V2014 |
2.33 |
||
|
GRP2018 |
-0.29 |
||
The elasticity coefficients for the year 2019 election assume a relatively strong and significant negative influence of the economy performance on the vote. No such phenomenon was observed in other elections that we analyzed, and this fact calls for special treatment of specifically this election.
The electoral volatility appeared to be quite high in Ukrainian president elections, and, as the panel model showed, the support for the incumbent diminishes in comparison to the previous election, which demonstrates shifts in the voter sympathies. This situation is characteristic not only for Ukraine, but for most transition nations and persists despite the maturing democracy (Bustrikova and Zechmeister, 2017).
Ukrainians usually cast the vote based not on the observable economy performance, but on the perception of the policies that are believed to be implemented by the incumbent or the challenger. That is why the EV hypothesis did not sustain in the Ukrainian reality.
Especially the 2019 presidential election in Ukraine compels us to look for the answer to the question: whatever truly determined the election outcome? It was clearly not the economy performance, but rather non-economic factors, especially the negative emotions relating to the lasting armed conflict causing a huge economic burden for the nation and a significant death toll. According to D. Kahneman, “negativity and escape dominate positivity and approach” in the human mentality (2012: 300). Forming the negative perception of the incumbent by the mass media controlled by oligarchs also played its role here because information manipulation and the provision of misinformation by the media led to distortions of the voter preferences in favor of the interested groups.
5. Why the Ukrainian voter did not appreciate the economic performance in the course of year 2019 elections
In the year 2019 election, the incumbent president Petro Poroshenko suffered a defeat against Volodymyr Zelenskyy, a novice in politics. As our analysis showed, in the course of this election the Ukrainian voter did demonstrate the feature that is opposite to the economic voter: the coefficient by GRP2018 and the respective factor elasticity coefficient appeared to be negative. Hence, in order to understand why EV was not sustained in 2019, we firstly have to look at how both contenders addressed the most urgent societal issues which were considered vital by the voter, including the economic ones. As G. Tullock once mentioned, “in order to win the election, the politician must determine what the voters want and then offer it to them” (2002: 27).
5.1. Societal concerns and how they were addressed in the course of the year 2019 presidential campaign
According to poll reports by Kyiv International Institute of Sociology, KIIS (https://www.kiis.com.ua/) which is one of the most trustful sources of polling information in Ukraine, in 2016–2018, Ukrainians were stably particularly concerned about the war in the East of Ukraine (ranked as #1), the standard of living (#2), the economic situation in the country (#3), and security (#4). So, it was clear that the economic performance looked quite important for the voters in the pre-election period.
A similar poll conducted by KIIS several years earlier (2012) showed that Ukrainians were most worried, namely, about economic problems in that period: rising prices, the threat of losing one’s job, late payment of wages, health issues, the economic crisis, and corruption. In 2016–2018, the issues of the statehood and security came to the fore as Russia undertook aggression against Ukraine in 2014, and the military conflict has been not resolved until now. The candidates’ programs and the campaigns conducted by them obviously reflected the priority issues mentioned above and suggested ways to solve them.
The incumbent’s (Petro Poroshenko’s) program included four sections. (1) “Living freely” (modernization of the state: decentralization, transparency, development of the Ukrainian language, full EC membership); (2) “Living comfortably” (the development of market institutions as a prerequisite for prosperity, reforming the law enforcement system, reducing the tax burden, entering foreign markets, and developing the agricultural sector); (3) “Living honestly” (implementation of the rule of law, fight against corruption, strengthening the public control over the public sector, professionalization of the civil service); (4) “Living safely” (countering external aggression, regaining Crimea, maintaining the country’s territorial integrity, strengthening the army, joining the EC, de-escalating the military conflict with Russia, ensuring energy independence). In general, the incumbent’s program focused on the fact that the social well-being may be the result of lengthy reforms, first of all in economy, which require some effort and sacrifice from everyone.
The contender’s (Volodymyr Zelenskyy’s) program with a subtitle programming the illusory world “I will tell you about the Ukraine of my dreams...” had the following sections: (1) “Democracy through referendum” (the people will directly determine the main directions of the public policy); (2) “Human is the highest value” (contraction of the state functions and improvement of the quality of public services); (3) “Justice and legal equality” (removal of inviolability from the President and parliament members; parliamentary elections with open lists; judicial independence, introduction of jury trial); (4) “Safety of the person. Safety of the country” (the end of the war in the East and the return of the occupied territories; strengthening of the army; the movement towards NATO; non-interference of the power structures in the business affairs); (5) “Prosperous citizen and prosperous state” (legalization of business revenues and the lowering utility tariffs for the population; de-shadowing of economy, freedom of competition, the development of domestic production, granting low-interest loans; replacement of the corporate income tax with the cash-flow tax; launching of the land market); (6) “Every Ukrainian must become a shareholder of Ukraine” (i.e., everyone gets their share of the benefits from economic growth); (7) “Not fighting corruption, but victory over it” (strengthening penalties for corruption, increasing the transparency in the public sector); (8) “Healthy and educated nation” (transition to medical insurance, vouchers for higher education, equality of public and private universities, the implementation of the ‘life-long education’ principle); (9) “Comfortable country” (high quality youth education, soft loans to entrepreneurs, transition to a contributory pension system, construction of roads, decentralization, improved environmental standards); (10) “Digital country” (digitalization of the society). All these provisions went under programming “we – circle” slogan “Let’s change Ukraine together” which is a continuation of the programming appeal formulated before the start of the election campaign (“We shall write a program together,” January 2019). The program had two and a half times more points compared to the incumbent’s one, and the egotropic motives (appeal to the individual) were pronounced much stronger here, the economic problems carried a very subtle meaning.
A comparison of both programs (Table 4 in Annex) showed that, despite the apparent pretentiousness of the main provisions of both, there were noticeable differences in the individual accents in policies dedicated to the most important needs of the society.
It can be assumed that the rational voter that thinks strategically; in the case they make the choice solely based on the programs of the candidates, they will vote for the incumbent, because it is the strategic transformation of institutions that is able to provide the long-term growth of the public and private welfare (Slukhai and Borshchenko, 2019). However, the outcomes of the presidential election of 2019 showed the opposite: by a large margin, it was Zelenskyy who won. It is clear that the voters’ choice was determined neither by the declarations set out in the candidate programs which only a small fraction of voters was familiar with, nor by the real economic situation.
So, there is a reason to raise a question: what really caused such a clear disproportion of the electoral sympathies in Ukraine in 2019?
5.2. Economy performance or profiling voter preferences?
As our models showed an insufficient role of economic factors on the vote in the course of the year 2019 election, it is worth assessing the actual results of the national economy in the pre-election period in order to understand whether they could exert the positive impact on the vote at least ‘in theory’.
If we evaluate Ukraine’s economic performance during the incumbent’s presidency (2014–2019) in terms of the personal well-being and economic development, then the data in Table 5 give reason to conclude that it looked rather modest, although the reasons for this were largely due to the external factors (namely, the war against the Russian Federation).
Table 5. Core indicators of social and personal well-being for Ukraine, 2014–2018 (percent to the level of the preceding year)
|
2014 |
2015 |
2016 |
2017 |
2018 |
|
|
Gross domestic product index |
93.4 |
90.2 |
102.4 |
102.5 |
103.3 |
|
Unemployment rate |
9.3 |
9.1 |
9.3 |
9.5 |
8.8 |
|
Real disposable income index |
88.5 |
79.6 |
102.0 |
110.9 |
110.9 |
|
Consumer price index |
124.9 |
143.3 |
112.4 |
113.7 |
109.8 |
Source: compiled by the authors based on data of the State Statistics Service of Ukraine.
According to the official statistical data presented above, the negative trends in the national economy were observed in 2014–2015. The sharp deterioration of economy was caused by the aggressive actions of the Russian Federation, including the military ones, in the course of which, the country suffered significant economic losses due to the destruction of the public and private assets in the occupied territories and the economic wars by which the Russian Federation sought to economically weaken Ukraine. In 2016–2018, the negative trends gave way to positive ones which allowed to virtually restore the year 2013 level of the social and personal well-being by the year 2019.
So, the actual economic situation under the incumbent looked not as bad as it could be. Then, why did the voter not take this fact into account?
The answer could lie in both exaggerated public expectations and the artful manipulation of the mass consciousness which triggered a situation in which the voter got concentrated on the good future promises and ignored any information disproving their belief.
It should be mentioned that, during the period between the presidential elections, the Ukrainian society became the object of permanent information aggression from Russia. Through the distortion of the information flow, an attack was orchestrated on the socio-psychological stability of the Ukrainian society with the aim of disorienting Ukrainians, humiliating their dignity, raising the ‘horizon of evil’ (negating all aspects of the society), simplifying ideological matrices, profiling consciousness (Slukhai, N., 2018); in such a psychologically unstable state, the society approached the 2019 presidential election. In this way, a fertile soil to make the common Ukrainian citizen rely upon heuristics, not real facts, was prepared.
In our opinion, the 2019 election outcome was due not so much to the actual economic situation under the incumbent’s rule, but due to the presidential campaign background: by the moment of election the crisis events of the years 2014–2015 had to a certain extent been resolved, the military actions in Eastern Ukraine had been reduced to some sporadic fights, thus creating for most people the impression of peaceful existence; the positive economic dynamics contributed to the feeling of stability. Therefore, the incumbent’s ‘rally-around-the-flag’ rhetoric lost its initial potential, whereas his opponent’s rhetoric (such as “I will stop the war”) received considerable public resonance. Namely, the hope of resolving the armed conflict must be the strongest motive for the Ukrainian voter that is supported by our panel model (see Table 2). With regard to this #1 concern of Ukrainians (war), the incumbent had a clear position (“fight the aggressor”) that was thoroughly presented to the society. However, as the 2019 election outcomes show, the voter did not give credit to his appeal; moreover, this position cost him a sizable fraction of the votes that leaked in favor of his opponent. The polarization in the society (in the Ukrainian case, concerning the resolution of the war issue) could greatly contribute to the attenuation of the link between the economic performance and the incumbent’s electoral support, as recent studies demonstrate (Ellis and Ura, 2021).
Not only profiling the voters’ preferences concerning the war issue, but also the economy performance played a significant role in the 2019 election outcome. In other words, the neutrality of individual preferences was heavily damaged.
It is well-known that the modern communication means deliver the most powerful techniques of influence on the psyche of people while making the political choice; they have become one of the key instruments used for the ‘breaking’ of mass consciousness for the benefit of the stakeholders aiming to achieve a particular political result. In the 2019 election in Ukraine, namely, television, but not the social media, played a leading role in shaping the public perceptions of the rivals as the personality is always of great importance, especially in the presidential election.
Therefore, it makes sense to pay attention to how the public perception of the candidates was formed. Frequently, the challenger uses higher amounts of populist key messages and style elements without resorting to direct communication with the opponent(s) or journalists. Due to the wide coverage of the television audience, the media managed to form a positive image of the contestant and a negative image of the incumbent. As for Zelenskyy, the major means of furthering the image of the future president were: discursive markers of proximity to the people presented in the candidate’s program; a system of competently created slogans; skillful use of television and social media; activation of cognitive effects; background in the popular TV series called Servant to the People where the presidential candidate played the star part, as well as the front-man positions in popular TV shows. Poroshenko as a presidential candidate had none of these advantages, so he had limited possibility to give an adequate communicative response to his opponent. In this way, the public attention had been diverted from the dull issues of economy to the comparison of the personality images formed by the mass media whose most important message sounded, roughly: elect a new person who was not involved in the dirty politics, and you will get all the problems solved.
5.3. Some additional factors contributing to the rejection of the economic vote hypothesis
There are some additional factors which might have contributed to the observed presidential election outcomes in Ukraine and aggravated the popular bias to ignore the economy performance while casting the vote.
Delay in learning and ignorance. The experience of many post-socialist countries shows that, as democracies are maturing, voters “have learned to become classical economic voters, rewarding the government for good times, punishing it for bad” (Stegmaier and Lewis-Beck, 2009: 769). It is obvious that, in order to express EV, the voter must be aware that economy is an important factor for taking a decision on who to vote for, and the comprehension of this fact by the public consciousness must take some time. Thus, a cross-country study supported the claim that EV manifestation depends on the maturity of the democracy: in most countries denoted by young democracies, the initial stages of the democratic development (20–25 years long on average) are characterized by lack of EV (Bochsler and Hänni, 2019). The fact that the EV non-existence has persisted for a longer time in Ukraine (about 30 years since gaining independence) can be explained in the following way: Ukraine is one of the countries with the least reformed economy and socio-political system in the CEE region, and that is why the nation needs slightly more time than the average in order ‘to learn EV importance’.
As we have shown, the Ukrainian voter usually has given no credit for the achievements of the incumbent in the economy and other public spheres (and/or the government on which he has relied). If we take into account the latest (2019) election, these achievements include many things that happened in the period of 2014–2019: the restoration of the army, the introduction of a visa-free entry into the EU countries, the stabilization of the national economy after the recession caused by the Russian aggression, the restructuring of external economic relations towards Europe, the elimination of energy dependence on the aggressor, reduction of the level of corruption, the implementation of several reforms in the public administration and other spheres, among which, the most successful was decentralization, etc. However, the voter did not appreciate these reforms partly because of the dominating negativity, partly because of ignorance: a pre-election survey conducted in 2018 showed “a clearly insufficient awareness level of Ukrainian citizens concerning the reform content and the expected results” (Razumkov Center, 2018). It turned out that, on average, only 2–10% of citizens were well informed about the reforming activities; when assessing the impact of the reforms on their personal well-being, the vast majority of the respondents (60–75%) did not see any connection. All this could mean that whatever the incumbent tried doing in economy, it could still be not appreciated by the voter; thus, the economy performance, along with the economic reforms that could be assigned to the incumbent’s credit, not necessarily would boost his popularity as we have seen, especially in the case of the 2019 presidential election.
Ignorance gives rise to a simplified perception of reality. “When people decide whether to devote mental effort to the dry facts vital for intelligent political choice, or to irrelevant fluff, they choose the latter” (Caplan, 2006: 96). Voters did not want to know what the politicians did or intend(ed) to do. In the case of Ukraine, when the majority was not sufficiently informed, the observed prospectivity of the vote can be explained by irrationality (irrational, mythologized thinking is typical for Ukrainians, according to the observations of researchers in the field of social psychology). Moreover, as the majority of voters appeared to be ignorant, the information on the economy performance or the future economic policies would not significantly affect the decision concerning whichever candidate deserves the vote. Noteworthy is the fact which the opinion polls revealed: those voting for the contender in 2019 were, in general, worse informed about his intensions concerning the public policy in comparison to those who supported the incumbent (see Table 5 in Annex). In such a case, some other factors must affect the political choice, namely, heuristics.
Relying on heuristics and emotions. The ignorance concerning the economy performance and other public spheres is clearly observed, especially in the course of the year 2019 election; it enhances the role of heuristics in the political choice of Ukrainians. Heuristics makes the choice easier, thus allowing people to economize mental efforts in the choosing process because they provide the voter with a signal that allows, stereotypically, to automatically identify those candidates who are close to the voter’s preferences at no extra effort. However, relying on heuristics is often incompatible with a rational choice, thus it can bear significant negative consequences for the society. As the heuristics inherently involves cognitive biases, so it can lead to the respective voter’s perception distortions. An ever stronger information flow, its multi-vectorness, the multichannel nature, multi-subjectivity in the information presentation, a huge number of simulacra (fakes) of the information space with virtually unlimited possibilities for constructing the image of the position seeker – all of these speak in favor of the emerging constructed illusion heuristic (CIH). Relying on CIH made the Ukrainian voter believe that the situation in the economy before the election was bad, and that things will only get worse instead of taking into account the actual (slightly positive) trends in the economy achieved in the pre-election years. The prevailing CIH could be – to some extent – responsible for the negative sign by the GRP variable for the year 2019 model.
CIH played an important role, especially in the year 2019 election, where the candidate’s personality information was widely utilized by the media in order to construct the contender’s narrative. The criteria of the voter’s choice appeared to be not the merits, but rather the personal qualities of the candidate, as noted by 43.3% of the respondents to a KIIS poll just before the presidential elections. Expressive rhetoric and intensive voter treatment via television managed to form the image of the future president whose personal qualities corresponded to those of the contender. The main criteria of sympathy for him according to the KIIS poll were: the novelty in politics, views, honesty and independence from the oligarchs. The incumbent was presented by most media in the opposite way: as the one who is responsible for the long-lasting war, an oligarch, a bad public manager, a person with a doubtful background; thus the bulk of the electorate was triggered by the CIH stemming from the cognitive effect of negativity distortion.
The EV manifestation depends on the degree of polarization of the electorate, as well as on the political and psychological factors which can overcompensate for the voter’s inclination to vote based on the achievements of the economy. When casting the vote in 2019, people expressed their negative attitude towards the incumbent backed by the fact that he was a top public official when the war broke out in 2014. The media intentionally pushed up the expressive vote by using the age-old dislike of Ukrainians for the state.
The irrational individual is often characterized by the following way of thinking: if a position seeker promises something that pleases the voter and speaks ‘the language of the voter’, (s)he can be trusted just because ‘(s)he is one of us’ (the Semmelweis effect: the assessment does not depend on the argument power, but on how ‘what is heard’ matches the already rooted ideas). The image is of great importance for the uninformed voter (‘honest’ appearance, rhetoric, etc.) as well as the ways of presenting information which makes the voter an object of manipulation through cognitive effects (the halo effect that means the attribution to a person of the undeveloped positive qualities subject to the general positive impression of the person, e.g., Zelenskyy’s acting as the front-man in TV shows). The effect of the sensory reduction when a person is evaluated according to the sensory (usually physiognomic) data (younger, in good physical shape, with lively facial expressions and a sincere smile) also played a role. Another effect that is traceable when assessing the contender’s unexpected political popularity is the Dr. Fox effect, according to which, a candidate with weak knowledge but good communication skills (charismatic, quick in dialogue, accustomed to the stage, such as Zelenskyy) is in the absolute advantage in influencing the masses. All these effects were being skillfully used while furthering the challenger in the Ukrainian political market by the interested groups.
Sporadically, some other cognitive effects appeared in the campaign: those of mythologized illusory future (as in the epigraph to the contender’s presidential program), of intra-group favoritism (Ze!Team), of elusiveness, or greater attractiveness of a person who artificially limits the possibilities of communicating with him (the challenger avoided public debates, and he had only one face-to-face discussion with the incumbent).
It follows from our analysis: there is a reason to believe that the Ukrainian voter in 2019 did not focus on the candidates’ program concepts or achievements, but rather on their personal images created by the media.
Our explanation of the political choice finds its justification in the attitudes of the population. As the cross-county studies show, the less happy voters do not tend to vote for the incumbent, thus hoping that the new president will improve their well-being, establish order in the country, etc. (Ward, 2019). According to the surveys conducted by Gallup International in 2017 and 2018, Ukrainians appeared to be one of the least happy nations on the planet with the Happiness Index +8 (2017), occupying the 138th place in the pre-election year 2018; secondly, they were characterized by the generally pessimistic mood regarding the immediate future (Hope Index in 2018 and 2019, as defined in the previous year, amounted to, respectively, +2 and +4); the Economic Optimism Index in 2017 was negative and scored -38. The data of a Gallup International 2019 survey show that, after the presidential and parliamentary elections, Ukrainians began feeling slightly happier: the Happiness Index reached +33, which can be considered as manifestation of the public optimism about electing Zelenskyy to the position of the President.
The pessimism concerning the nearest future, disregarding whether it has real grounds or not, played its role in the year 2019 election outcome as it contributed to social negativity. As the prospect theory in its application to politics predicted, in difficult times, the incumbent loses popularity to the contestant in the voters’ eyes (Quattrone and Tversky, 1988). So, with regard to public pessimism, the incumbent was doomed to lose in 2019.
Aftermath. The choice of Ukrainians in 2019 has its cost as the nation under new leadership must overcome many old and newly emerging challenges, among which, there is the war against Russia, an economic crisis which started in 2019, and the COVID-2019 pandemic outbreak. Whether the new Ukrainian leader will find the right way to cope with these issues is still a question as there are some signs of weakening the national public sector institutions being observed. It is somewhat too early to judge the results of the change of the person taking over the president’s office after two post-election years; however, some dangerous signals from economy have become obvious. When assessing the Ukrainian economy performance, the data on which became available for 2019–2020, then it might be suggested that most indicators demonstrated a downsized trend after the election (Table 6).
Table 6. Dynamics of the economy performance indicators for Ukraine
|
Indicator |
2017 |
2018 |
2019 |
2020 |
|
GDP growth rate (per cent)a |
2.5 |
3.4 |
3.3 |
-4.0 |
|
Unemployment ratea |
9.5 |
8.8 |
8.2 |
9.7 |
|
Inflation ratea |
13.7 |
9.8 |
4.1 |
5.0 |
|
Corruption Perception Indexb |
30 |
32 |
30 |
33 |
|
Economic Mood Indicatora |
99.7 |
104.1 |
107.9 |
88.4 |
|
Share of households with expenditures lower than actual subsistence level (percent)a |
47.3 |
43.2 |
38.5 |
45.0 |
Source: aState Statistics Service of Ukraine; bTransparency International.
The data presented above demonstrate that Ukraine’s economy performance indicators before the 2019 presidential election moved in the positive direction, thus showing that the state performed its functions well enough; however, in 2020, after the election, we observe a reverse move for most of these. These negative trends, as well as the ongoing military conflict with Russia in the East of the country, also explain why the brand-new president’s popular support significantly dropped by the beginning of 2021 as the recent polls witnessed. In order to restore the positive economy trends, a lot should still be done, but, most urgently, it is necessary to raise the quality of public administration because specifically this sphere has become nowadays the most problematic one in Ukraine in comparison to the other CEE countries as emphasized in the Transition Report 2020–21.
Concerning the prospects of the research, the authors suggest building a model to disclose what it is that influences the voters’ choice in Ukraine. However, we assume that constructing such a model will entail many difficulties with regard to incompleteness of information, as noted by us in a recent paper (Slukhai, S., 2021). In order to overcome this issue, much work should still be undertaken, e.g., we need to carry out regular nation-wide polls and panel studies in order to reveal information on the individual and public perception of vital economic issues.
6. Conclusions
Our study showed that the political choice in a transition nation poses many challenges which can offset the economic vote that is characteristic for the (more) mature democracies. Such factors as the negativity bias, imperfectness of information and reliance on heuristics, the emotions of the electorate, as well as the pessimistic social mood reinforced through manipulative influence of the modern media – all of these could make meaningless the economy performance in the public perception. As a result, cognitive illusions may prevail over rational thinking; the imaginary world may replace the real one, which inevitably provokes further social dissatisfaction, while the voter will be facing the after-election reality, but not the inspired illusions or dreams. The Ukrainian voter has still ‘not learned’ to correctly assess the real state of economy and political performance, the politicians’ personality and to ‘separate the wheat from the chaff’. The voter appeared to be unable to adequately process the expanding flow of the political and economic information; the voter is being driven by emotions, the voter uses the rule of thumb and, therefore, the voter is doomed to be regularly disappointed by their choice.
We believe that an approach offered in this study (vote regional crosscut regressed by a set of economic and political variables) allowed looking at the Ukrainian political market from a new standpoint, which gives reasonable explanation to the outcome of the election. It also makes it possible to obtain a significant econometric model while operating by data of only one national election. Our study made some input into analyzing of how the voter’s preferences are formed under unstable democracy and how they are realized in the political choice, the prospect of understanding the factors that affect the voters’ perception of information, the role of the media in exogenizing political preferences.
Some new possibilities of analyzing the political choice in Ukraine could be further opened if we apply the methodology developed here to parliamentary elections. In this case, the study may be grounded on a more solid statistical base.
References
Abrams, B. A., and Butkiewicz, J. L. (1995). The Influence of State-Level Economic Conditions on the 1992 U.S. Presidential Election. Public Choice, 85(1/2), 1–10.
Bochsler, D., and Hänni, M. (2019). The Three Stages of the Anti-Incumbency Vote: Retrospective Economic Voting in Young and Established Democracies. European Journal of Political Research, 58, 30–55. https://doi.org/10.1111/1475-6765.12269
Brennan, G. (2008). Psychological Dimensions in Voter Choice. Public Choice, 137, 475–489.
Brennan, G., and Buchanan, J. (1984). Voter Choice: Evaluating Political Alternatives. American Behavioral Scientist, 28(2), 185–201.
Bustrikova, L. and Zechmeister, E. J. (2017). Voting in New(er) Democracies. In Arzheimer, K., Evance, J., and Lewis-Beck, M. (Eds.), The SAGE Handbook of Electoral Behaviour (pp. 92-133). London: SAGE Publications Ltd.
Caplan, B. (2006). The Myth of the Rational Voter: Why Democracies Choose Bad Policies. Princeton and Oxford: Princeton University Press.
Downs, A. (1957). An Economic Theory of Democracy. New York: Harper Collins.
Ellis, Ch. R, and Ura, J. D. (2021). Polarization and the Decline of Economic Voting in American National Elections. Social Science Quarterly, 102(1), 83–89. https://doi.org/10.1111/ssqu.12881
Frey, B. S., and Schneider, F. (1975). An Econometric Model with an Endogenous Government Sector. Discussion Papers, Series I 59, University of Konstanz, Department of Economics.
Jastramskis, M., Kuokštis, V., and Baltrukevičius, M. (2019). Retrospective Voting in Central and Eastern Europe: Hyper-Accountability, Corruption or Socio-Economic Inequality? Party Politics. https://doi.org/10.25384/SAGE.c.4709144.v1 [Accessed April 25 2020]
Kahneman, D. (2012). Thinking, Fast and Slow. Penguin Books.
Kramer, G. H. (1971). Short-Term Fluctuations in U.S. Voting Behavior: 1896–1964. American Political Science Review, 65(1),131–143. https://doi.org/10.2307/1955049
Lewis-Beck, M. S., and Ratto, M. C. (2013). Economic Voting in Latin America: A General Model. Electoral Studies, 32(3), 489–493. https://doi.org/10.1016/j.electstud.2013.05.023
Lewis-Beck, M. S. and Stegmaier, M. (2019). Economic Voting. In Congleton, R.D., Grofman, B.N., and Voigt, S. (Eds.), The Oxford Handbook of Public Choice (pp. 247-265). Oxford: Oxford University Press.
Nannestad, P., and Paldam, M. (1994). The VP-Function: A Survey of the Literature on Vote and Popularity Functions after 25 Years. Public Choice, 79(3/4), 213–245.
Ostrom, E. (1998). A Behavioral Approach to the Rational Choice Theory of Collective Action. American Political Science Review, 92(1), 1–22. https://doi.org/10.2307/2585925
Quattrone, G. A. and Tversky, A. (1988). Contrasting Rational and Psychological Analyses of Political Choice. American Political Science Review, 82, 719–736. https://doi.org/10.2307/1962487
Razumkov Center (2018). Riven’ poinformovanosti naselennya Ukrayiny pro reformy, otsinka vplivu reform na osobyste stanovyshche hromadyan. Available at: http://razumkov.org.ua/napriamky/sotsiologichni-doslidzhennia/riven-poinformovanosti-naselennia-ukrainy-pro-reformy-otsinka-vplyvu-reform-na-osobyste-stanovyshche-hromadian [Accessed March 27 2020].
Slukhai, N. (2018). Narratives of the “Other” in Times of Worldview Wars: True Face, Masked Face. Ante Portas – Studia nad Bezpieczeństwem, 2(11), 345–365.
Slukhai, S. (2021). Explaining Political Choice: Prospects for Economic Theory. Bulletin of Taras Shevchenko National University of Kyiv. Economics, 214, 27–33. https://doi.org/10.17721/1728-2667.2021/214-1/4
Slukhai, S., and Borshchenko, T. (2019). Social Welfare Dynamics in Post-Socialist Countries: Unveiling the Secrets of Success. Public Sector Economics, 43(2), 167–194. https://doi.org/10.3326/pse.43.2.3
Stegmaier, M., and Lewis-Beck, M. (2009). Learning the Economic Vote: Hungarian Forecasts, 1998-2010. Politics & Policy, 37(4), 769–780.
Talving, I. (2018). Economic Voting in Europe: Did the Crisis Matter? Comparative European Politics, 16, 695–723.
Tullock, G. (2002). The Theory of Public Choice. In Tullock, G., Seldon, A., and Brady, G. L. (Eds.), Government Failure. A Primer in Public Choice (pp. 3–82). Washington, D. C.: Cato Institute.
Valdini, M. E., and Lewis-Beck, M. S. (2018). Economic Voting in Latin America: Rules and Responsibility. American Journal of Political Science, 62(2), 410–423. https://doi.org/10.1111/ajps.12339
Ward, G. (2019). Happiness and Voting Behavior. In Helliwell, J. F., Layard, R., and Sachs, J. D. (Eds.), World Happiness Report 2019 (pp. 47-66). Available at: https://s3.amazonaws.com/happiness-report/2019/WHR19.pdf [Accessed May 4 2020].
ANNEX
Table 1. Descriptive statistics of the panel model variables
|
Variable |
Mean |
Minimum |
Maximum |
Standard deviation |
Skewness |
Kurtosis |
|
Ve |
19.186 |
0.700 |
70.400 |
17.014 |
1.052 |
0.741 |
|
Ve-1 |
53.442 |
3.800 |
96.000 |
24.609 |
-0.3289 |
2.3816 |
|
GRPt-1 |
-0.966 |
-21.100 |
11.400 |
9.034 |
-0.579 |
-1.009 |
|
Ut-1 |
9.887 |
5.300 |
15.100 |
2.545 |
-0.379 |
1.696 |
|
W |
0.333 |
0.000 |
1.000 |
0.474 |
0.707 |
-1.500 |
Note: The results of unit root testing show that variables are stationary in levels. For this purpose, the Levin, Lin & Chu criteria (for the common unit root process) have been used.
Table 2. Correlation matrix of explanatory variables for the panel model
|
GRPt-1 |
U |
Ve-1 |
W |
|
|
GRPt-1 |
1.000000 |
|||
|
U |
0.341305 |
1.000000 |
||
|
Ve-1 |
-0.124194 |
-0.051424 |
1.000000 |
|
|
W |
0.340324 |
-0.175200 |
-0.022859 |
1.000000 |
Table 3. Cross-section effects of panel data model
|
Region |
The cross-section effect |
|
Region |
The cross-section effect |
|
AR Crimea |
-6.180569 |
|
Vinnytsia |
-7.082565 |
|
Volyn |
4.394719 |
|
Dnipro |
-2.072348 |
|
Donetsk |
-2.230813 |
|
Zhytomyr |
-4.198697 |
|
Zakarpattya |
3.147211 |
|
Zaporizzya |
-4.436982 |
|
Ivano-Frankivsk |
15.31690 |
|
Kyiv |
-1.381855 |
|
Kirovohrad |
-8.545030 |
|
Luhansk |
-6.384366 |
|
Lviv |
22.29129 |
|
Mykolayiv |
-6.968483 |
|
Odesa |
-0.005993 |
|
Poltava |
-11.29641 |
|
Rivne |
5.967622 |
|
Sumy |
-4.237962 |
|
Ternopil |
17.00097 |
|
Kharkiv |
-6.016149 |
|
Kherson |
-2.774565 |
|
Khmelnytskyi |
0.460517 |
|
Cherkasy |
-5.411151 |
|
Chernivtsi |
7.439206 |
|
Chernihiv |
-6.478878 |
|
Kyiv City |
6.242932 |
|
Sevastopol City |
2.071900 |
Table 4. Reflection of the main Ukrainians’ concerns and approaches to addressing them in the programs of the candidates for the presidency
|
|
Poroshenko (incumbent) |
Zelenskyy (challenger) |
|
War in the East of Ukraine |
Political and diplomatic efforts to return Crimea; protection of the territorial integrity of the country in the East |
End the war; return of the occupied territories; receive compensation from the aggressor |
|
Standard of living |
Implementation of institutional changes in the economy (judicial reform and promotion of competition) on the basis of which welfare growth will be achieved; fight against corruption; development of economic relations with the EС |
Every Ukrainian should receive their share of the sale of natural goods; youth should get quality education and job opportunities; business should get reduction of the tax pressure; pensioners should be paid a contributory pension |
|
Economic situation |
Development of competitive markets; protection of property rights; reduction of the tax burden; creation of a free trade zone with the EC; agricultural sector development |
Tax reduction, business unshadowing; transparent land market; increased penalties for corruption; road construction; decentralization; raising environmental standards |
|
Safety |
Strengthening the army as a guarantor of safety; de-escalation of the military conflict with Russia; ensuring the irreversibility of the European vector of development; energy independence of the country |
Achieving peace for Ukraine; professionalization of the army; movement towards NATO; law enforcement agencies should not interfere in business, but rather to ensure the safety of citizens |
Source: compiled by the authors basing on the candidates’ election programs.
Table 5. A degree of voter awareness in the 2019 presidential election concerning the main aspects of their candidate’s policies (percentage of those highly informed)
|
Issue |
Poroshenko’s voter |
Zelenskyy’s voter |
|
How to achieve peace in Donbas |
40.1 |
20.8 |
|
Policy towards Russia |
50.8 |
18.0 |
|
Reforming judiciary and law-enforcement agencies |
27.8 |
14.1 |
|
Reform of Armed Forces |
47.6 |
10.2 |
|
Fight against corruption |
35.8 |
30.3 |
|
Social reforms |
45.5 |
20.4 |
|
European integration |
61.5 |
21.1 |
|
Entry to NATO |
62.0 |
16.2 |
|
Land reform |
25.1 |
9.9 |
|
Economic growth |
41.2 |
21.8 |