Ekonomika ISSN 1392-1258 eISSN 2424-6166
2022, vol. 101(2), pp. 92–108 DOI: https://doi.org/10.15388/Ekon.2022.101.2.6
The Efficiency of Educational and Healthcare public expenditures in Kosovo: A Data Envelopment Analysis Technique
Lekë Pula
Department of Economics, Economic Faculty, University of Prishtina “Hasan Prishtina”, Kosovo
Email: leke.pula@uni-pr.edu
Alban Elshani*
Department of Banking and Finance, Economic Faculty, University of Prishtina “Hasan Prishtina”, Kosovo
Email: alban.elshani@uni-pr.edu
Abstract. This paper evaluates the performance and efficiency of the government public expenditure in the education and health sectors in the emerging economies context, specifically comparing Kosovo with the Western Balkan countries. The indicators of education and health sectors were used to assess a Public Sector Performance Index (PSP) and the Public Sector Efficiency Index (PSE). Also, this study uses the nonparametric method DEA (Data Envelopment Analysis) to evaluate the input-output oriented efficiency. This study finds that education score of performance ranges from 0.43 which is the minimum to 1.48 which is the maximum. And in the health sector, the PSP score ranges from 0.81 which is the minimum to 1.09 which is the maximum. Kosovo ranks 41st out of 42 countries in this sample, in terms of the education sector, with a performance index of 0.67, which is 37% below the average of 1.00, whilst in terms of the health sector it ranks 39th out of 42 countries in the sample.
In the analysis of the input output efficiency model in the education sector, the results show that the countries included in the study achieve an efficiency of 76.69 and it means that countries can reduce relevant public expenditure by 23.3% and maintain the same level of PSP in the education sector. Kosovo is assessed in this analysis as an inefficient country. The value of the input-oriented index is 40.24, which means that Kosovo can achieve the same level of performance in the education sector by using 60% less relative public expenditure, whilst, on the other hand, the input-output efficiency results for the health sector show that the efficiency score for countries is 47.64, and denotes that the countries in the sample could reduce 53% in health expenditure to achieve the same performance in the health sector. Thus, Kosovo compared to other countries in the sample is within the limits of production opportunities and uses public expenditure on health and education inefficiently.
Keywords: government public expenditure; health sector; education sector; Kosovo.
_______
* Corresponding author.
Received: 05/11/2021. Revised: 02/02/2022. Accepted: 13/03/2022
Copyright © 2022 Lekë Pula, Alban Elshani. Published by Vilnius University Press. This is an Open Access article distributed under the terms of the Creative Commons Attribution License, which permits unrestricted use, distribution, and reproduction in any medium, provided the original author and source are credited.
1. Introduction
Many authors of economic theories have argued that the increase in public expenditure during the twentieth century and early twenty-first century has not brought the necessary additional results in economic and social well-being, however, they suggest and justify that public expenditure in industrialized countries may be much smaller, without compromising certain political and economic objectives (Stiglitz, 1980; Kimaro, et al., 2017). Therefore, the optimal role of public expenditure continues to be a permanent and main topic of discussion for all developed and developing countries (Grigoli & Kapsoli, 2018; Ghosh & Gregoriou, 2008; Pula & Elshani, 2018).
There have been many papers in the economic literature that have evaluated and analyzed the effects of stabilization, allocation, and distribution of public expenditure (Rodrik, 2000). However, measuring the performance and efficiency of public expenditure as an important part of fiscal policy used by the public sector has become one of the key issues in public finances and the subject of increasing economic literature (Heller & Hauner, 2006; Montes, et al., 2019). Many economists believe that public activities should generate maximum benefits for the population, and they also demand that the redistribution and use of economic resources towards predefined strategic priorities be efficient (Pula & Elshani, 2018; Azhykulova, 2015). Improving the efficiency of public expenditure not only helps to achieve and sustain fiscal discipline but also allows increased value for money by achieving better results with the same level of expenditure (Manddl, Dierx, & Ilzkovitz, 2008). Moreover, Pitlik and Schratzenstaller (2011), Heller and Hauner (2006), Afonso, Schuknecht, and Tanzi (2005), Kimaro, et al. (2017) indicate that the public sector can perform well and can only be efficient if the level of public spending is small and used appropriately.
Therefore, small changes in public expenditure efficiency have a significant impact on GDP and the achievement of predetermined government objectives (Herrer & Pang, 2005). However, Tanzi (2010) in his study exploring the role of performance and efficiency of the public sector, suggests that “achieving multiple objectives of stabilization, growth, and equity requires not only cost reduction but more importantly, improved composition efficiency”. On the other hand, if the public expenditure is not supported by efficiency-enhancing policies, then they do not lead to improvements in public services (Bhanumurthy, et al., 2018). Whereas, Haunter and Kyobe (2008) emphasize that demographic, geographical, and corruption control play an important role in increasing the efficiency of public expenditure because different forms of its use have been shown to negatively affect the efficiency of public spending. Moreover, Azhykulova (2015) believes that countries that have an efficient public sector tend to have a much lower cost of economic growth, greater foreign investment attractiveness, more positive credit ratings, better public service delivery, encourage higher levels of human capital accumulation and acceleration of technological innovation.
The aim of this paper is to examine the performance and efficiency of the government public expenditure in the education and health sector in Kosovo, compared to 42 countries, especially the countries of the Western Balkans, during the period 2007–2016. The rationale of this study is: first, Kosovo is in the early stages of consolidating the economic development trajectory, and public expenditure is used as an important instrument of economic growth; second, recently there has been much discussion about public expenditure efficiency as a significant driver of public sector performance; third, public pressure to increase public spending by raising the public debt.
Beyond the introduction, the rest of the paper is organized as follows. Section 2 describes the empirical evidence of the input-output efficiency along with the Production Frontier Technique. Section 3 presents the methodology used to measure the education and health government expenditure efficiency, while Section 4 presents the empirical results. Finally, Section 5 consists of the main concluding remarks.
2. Literature review
Many empirical studies have shown that there is a wide debate about public sector efficiency. The debate focuses mainly on strategies for increasing the efficiency of the public sector in order to increase economic competitiveness and promote economic growth (Zugravu & Sava, 2012), (Ibanez, et al., 2020). Certainly, according to Manddl, Dierx, and Ilzkovitz (2008), Dincă, et al. (2020), Flores (2017), Afonso, Schuknecht, and Tanzi (2005), Moreno-Enguix and Bayona (2017), one of the best and most serious activities to increase the efficiency of the public sector is to increase the efficiency of economic resources.
Herrer and Pang (2005) in their paper, to evaluate the input output efficiency of the public sector, have applied two nonparametric approaches: the FDH methodology and the DEA, based on a sample of 140 countries for the period 1996–2002. The paper focused on only two sectors, the health sector, and the education sector. The final results of this paper show that the countries with the highest level of spending, score lower in efficiency.
Another study by Grigoli (2012) that analyzed the composition of public expenditure in the Slovak Republic for education and health compared to the EU and OECD countries, using DEA methods, shows that regardless of low expenditures in the education sector, outcomes are efficient. Moreover, increased expenditure in the health sector has not improved outcomes, and reducing expenditure in the health sector could save up to 3.5 percent of GDP without sacrificing health outcomes.
Hauner and Kyobe (2008) in their study computed PSP, PSE, and DEA scores for education and the health sectors for 114 advanced and developing countries, from 1980 through 2004. The strong evidence that they released is that efficiency in the respective sectors declines with increasing public spending. Also, they find that government accountability and corruption control can determine economic growth.
In their paper, Gupta, Honjo and Verhoeven (1997) assess the efficiency of public spending on education and health for 38 African countries for the years 1984–1995, as well as the ratio of these countries compared to countries in Asia and the Western Hemisphere. The contribution of this paper lies in the application of FDH analysis to measure the efficiency of public spending for these developing countries. Results show that African countries are more inefficient compared to countries in Asia and the Western Hemisphere, although there is much evidence that public spending performance in African countries has improved significantly since the mid-1980s. The results also show that the rate of inefficiency is higher at higher levels of public spending per capita, compared to countries with lower levels of public spending.
Ciro and Garcial (2018), in their study, examined the efficiency of secondary education expenditure for 37 developing and developed countries using DEA (Data Envelopment Analysis) methodology, for the period 2012 - 2015. The study obtained a significant result that a developing country in both inputs, PISA, and enrolments indicators can increase an average score between 16% to 20%, by improving efficiency expenditure on education. Similary, Šonje, Deskar-Skrbic, and Sonje (2018) in their paper assess the efficiency of public expenditure on secondary and tertiary education in the New Member States (NMS) in the EU, with a particular target on Croatia, using Data Envelopment Analysis (DEA). The results show that Croatia’s input variables, which are public expenditure on education are inefficient compared with states in the sample. The final contribution of this paper is that only efficient government expenditure can generate appropriate economic growth.
Afonso and Aubyn (2004) assess efficiency in education and health sectors across OECD countries, using two different nonparametric methods – Free Disposable Hull (FDH) analysis and Data Envelopment Analysis (DEA). The results presented are that, in the education sector, the average input inefficiency is 0.52 in DEA and 0.89 in FDH, depending on the model, and on the other hand, in the health sector, the average input inefficiency is 0.73 in DEA and 0.95 in the FDH model. So, in general, less efficient countries can achieve better outcomes using the same public expenditure on these two sectors. Similarly, Lavado and Cabanda (2009) analyze the efficiency of government expenditure on the education and health sectors for the Philippines, using Data Envelopment Analysis, Free Disposable Hull, and Malmquist-DEA. The scholars came up with the conclusion that the provinces that receive a larger portion of the budget are among inefficient provinces.
Table 1. Results of papers that have evaluated input-output efficiency of the sectors
Results of papers that have evaluated input-output efficiency of the sectors |
|||
|
Authors |
Input–Output Methodology |
Sectors |
Conclusions |
|
Afonso and Aubyn (2004) |
DEA and FDH |
Education and Health |
Both methods have shown that countries with higher levels of public spending score lower in public sector performance due to the inefficiency of public spending |
|
Herrer & Pang (2005) |
DEA and FDH |
Education and Health |
Countries with a higher level of public expenditure attained better results with a lower public spending |
|
Ahmed, et al. (2019) |
DEA |
Health |
Asian countries can improve health output using the current level of health expenditure spending |
|
Hauner & Kyobe, (2008) |
DEA |
Education and Health |
Higher public sector expenditures relative to GDP are associated with lower efficiency |
|
Gupta, Honjo, & Verhoeven, (1997) |
FDH |
Education and Health |
The inefficiency rate is higher in countries with higher levels of public spending |
|
Tanzi, Afonso, Schuknecht (2010) |
DEA |
Opportunity and Musgrave indicators |
Countries can use 45% fewer resources to attain the same level of efficiency |
|
Afonso and Kazemi (2016) |
DEA |
Opportunity and Musgrave indicators |
Countries with a higher level of public spending are less efficient than a countries with a lower level of public spending |
|
Antonelli, De Bonis (2018) |
FDH and DEA |
Education and level of GDP |
Countries with higher efficiency of expenditure score higher level of education and higher level of GDP |
|
Grigoli (2012) |
DEA |
Education and Health |
To be a well-performing country, it is not necessarily to increase public spending but to use this spending efficiently |
|
Afonso, Romero and Monslave (2013) |
DEA |
Opportunity and Musgrave indicators |
Output capacity could increase 19% with the same level of inputs |
3. Methodology
The assessing of education and health performance and efficiency is very important when we determine the relationship between public relevant expenditure, defined as inputs, and the benefits that society derives from these inputs, defined as outcomes. In this study, we determine the performance and efficiency of the education and health sectors using the indices and methodology developed by Tanzi, Afonso, Schuknecht and Veldhuis (2007). These indicators were developed for education and health sectors, defined as outcomes of public government activities for all 42 countries in the sample. The methodology used in this paper consists of two phases. The first phase expounds how we design performance and efficiency scores in these two areas, while the second phase provides an approach for analyzing the input-output efficiency using Data Envelopment Analysis (DEA) Techniques
3.1. Education and Heath Performance Index (PSP)
Education and health performances are defined as the output generated by public activities and are an important instrument to influence the improvement of public sector performance. The evaluation of the performance in the education and health sectors is based on social indicators, that are classified as “Process” or “Opportunity Indicators” in terms of evaluation (Afonso, Schuknecht, & Tanzi, 2006).
The opportunity indicator consists of four sub-indicators, focusing on the role of government that secures rule of law and promotes equality for all individuals in the market economy. These sub-indices express the government’s performance in areas of administration, education, public infrastructure, and health performance. In other words, the four first groups of sub-indicators could be called “process” or “opportunity” indicators. These indicators represent the quality of interaction amid fiscal policy and market process and the influence that these indicators have on the individual opportunity (Afonso, Schuknecht, & Tanzi, 2005; Afonso & Aubyn, 2004; Herrer & Pang, 2005). According to Tanzi, Afonso and Schuknech (2007), these sub-indicators are results derived from public activities. Moreover, “opportunity” indicators express the role of government as a promoter of equal opportunities in the market economy. The above indicators are called microeconomic because they attempt to measure the efficiency of particulate categories of public expenditure.
This paper has been focused on two sub-indicators that we measured by the composition of the following indices:
Table 2. Opportunity indicators
Opportunity indicators |
||
|
Output (performance) |
Sub-indicators |
Operationalization |
|
Health performance |
Infant mortality rate |
Mortality rate, infant per 1,000 live births |
|
Life expectancy |
Life expectancy at birth, total years |
|
|
Education Performance |
Secondary school enrolment |
Secondary school enrolment (% of gross).* |
|
Primary teacher to student ratio |
The number of primary students divided by the number of teachers in primary school. |
|
* The gross enrollment ratio can exceed 100% due to the inclusion of over-aged and under-aged students because of early or late school entrance and grade repetition.
Indicators of education and health are needed to construct the performance index of these two sectors. Once all the data have been collected, the measurements are normalized to obtain identical distribution values. This is achieved by dividing the value of one country by the average of the indicator for all countries in the sample. This calculation is done to provide a suitable platform for comparing the results. For the facilitation purpose, the average for the countries in the sample is set at 1.00 for all indicators (Ahec Šonje, et al., 2018; Arias Ciro & Torres García, 2018).
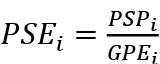
3.2. Education and Heath Efficiency Index (PSE)
The education and health performance indices do not ensure us any information on the efficient or inefficient use of relevant public expenditure. Consequently, in order to compute the education and heath efficiency index (PSE), it is necessary to consider the cost at which the education and health sector has achieved a certain level of performance index (PSP) (Afonso, Schuknecht, & Tanzi, 2005). Therefore, to compile the education and heath efficiency index (PSE), the performance index (PSP) is weighted with relevant categories of government public expenditure for the sector (GPE) and is presented as follows:
 , and
, and 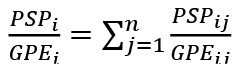
However, the marginal product implied as output falls during the increase of the level of relevant government public expenditure and is calculated as follows:
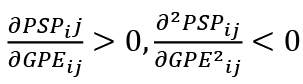
Here GPEij shows the public government expenditure of state i in divers areas j, which are indicators of government performance, and thus determine the overall efficiency in a state i. According to Afonso, Schuknecht, and Tanzi (2006), the inputs for the evaluation opportunities indicators are:
|
Input |
Output |
|
|
Opportunity indicators |
Health Expenditure |
Health performance |
|
Education Expenditure |
Education Performance |
3.3. Nonparametric technique (DEA)
Most of papers use nonparametric methods, Free Disposable Hull (FDH) and the Data Envelopment Analysis (DEA) for the relationship between inputs and outputs for the inefficiency terms. Among the different nonparametric methods, the Free Disposal Hull (FDH) method imposes the fewest number of restrictions. Comparing the two methods the DEA technique tends to assign efficiency to fewer countries than the FDH method does. Also, main advantages of the nonparametric DEA technique is that it can be utilized in multi-input--output frameworks (Manddl, et al., 2008). Moreover, DEA technique is a linear programming method that lies between these efficient countries , in contrast to the vertical step-ups of FDH technique (Herrer & Pang, 2005). The limitations of these two nonparametric methods derive mostly from the sensitivity of the results to sampling variability, to the quality of the data and to the presence of outliers, and providing the basis for normative and prescriptive policy recommendations (Herrer & Pang, 2005; Simar & Wilson, 2000).
Data Envelopment Analysis (DEA) was first used by Farrell (1957) and Charnes, Cooper and Rhodes (1978) who wanted to measure the input-output efficiency. Recently, the DEA method has found a wide variety of applications in various activities (Cooper W., 2002). It is regarded to be one of the most suitable methods in operations analyses (Thanassoulis, 2001). It has brought the potential to identify the best measures in many applied studies (Cooper W. W., 2011). Technically, the DEA assumes the existence of a convex output frontier developed using linear programming methods that lies between these observations, and the comparison between cost and output (Coelho & Watt, 2006; Antonelli & De Bonis, 2019). Another advantage of this method is that it can treat many outputs and inputs simultaneously, relationships (constraints) that arise when other techniques are used (Cooper W., 2002). Furthermore, DEA (Data Envelopment Analysis) is a flexible technique that can be easily adapted to the specific goals and needs of the application as it approaches estimation from a multidimensional perspective, also this parametric approach has an advantage because minimal assumptions are needed for frontier assessment.
In this study, we construct the DEA method to measure input and output efficiency scores and country rankings along with the Production Frontier Technique (Afonso, Schuknecht, & Tanzi, 2006). Moreover, this concept is paraphrased as the maximum performance of the social goods (health, education) that can be achieved by a given level of relevant public expenditure, and is presented as the following function (Tanzi, et al., 2007):
yi = f(xi), I = 1, ..., n
Here Yi is output, composite of social indicators measurement; Xi is input, relevant expenditure measurement. If yi > f(Xi) then we conclude that this country uses inputs efficiently, and vice versa, if yi < f(Xi) then a country is showing inefficiencies in the use of inputs.
This study evaluates the two mathematical approaches for compilation of DEA methodology, the input-oriented approach and the output-oriented approach (Charnes, et al., 1978). Kazemi (2016) asserts that to specify the input- and output-oriented approach, it is assumed that there are comparative units, each comparative unit uses K inputs to produce M outputs. If X is the input matrix KxI and Y is the output matrix MxI for all comparative units, then Xi is a vector input column and Yi is a vector output column for all comparative units.
Table 3. Input- and output-oriented efficiency
|
Data Envelopment Analysis (DEA) |
|
|
Output oriented |
Input oriented |
|
Max ρ, λδ Subject i – ρyi + Yλ ≥ 0 Xi – Xλ ≥ 0 n1 ' λ = 1 λ ≥ 0 |
Min ρ, λδ Subject i – yi + Yλ ≥0 ρXi – Xλ ≥ 0 n1 ' λ = 1 λ ≥ 0 |
In the above equations, ρ is scalar, while 1/ρ specifically implies the outcome efficiency and satisfies the assumption 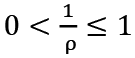 . According to Farrell (1957), ρ measures the distance from one country to another or the units of comparison along the efficiency frontier in our case. If ρ =1, then the comparison unit is efficient, and conversely, if
  , the comparison unit is inefficient. On the other hand, λ(I×1) is a vector of constants that measures the weight used to compile the location of an inefficient comparative unit. While the constraint n1 ' λ = 1 imposes frontier of convexity by calculating the variable return (CRS) in the DEA analysis, the disappearance of this constraint means accepting that the rate returns are constant (VRS; Afonso, Schuknecht, & Tanzi, 2006).
However, the DEA methodology evaluates the input–output efficiency analysis assuming that the technology is constant or variable return to scale (CRS1 and VRS2) (Gavurova, et al., 2017).
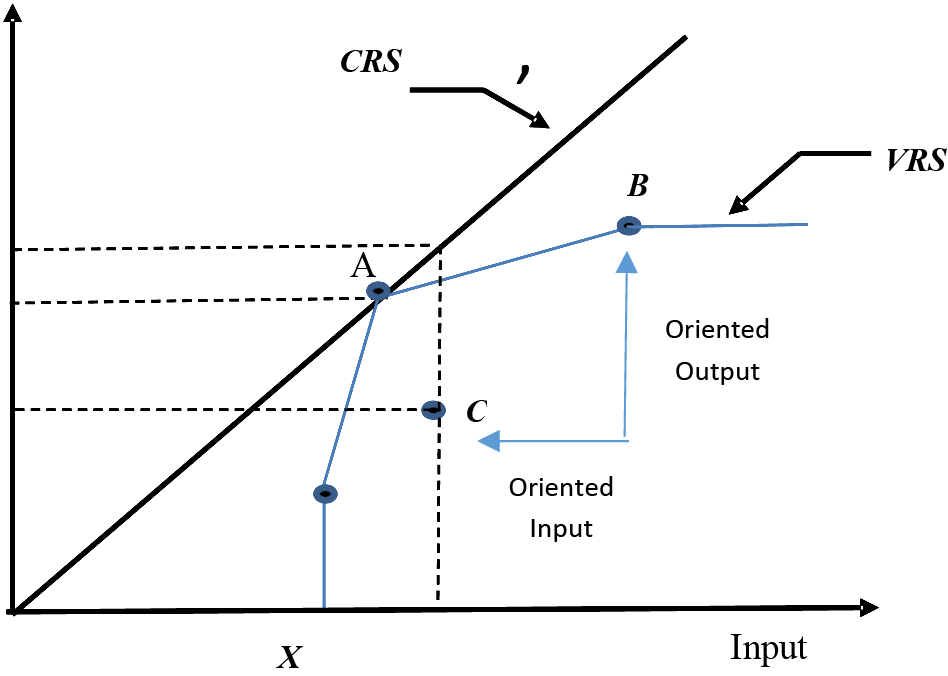
Figure 1. (DEA) Production Frontier Technique
Source: (Kazemi, 2016)
Therefore, it is important to note that from a modeling point of view, both types of DEA generate similar identification along the efficiency frontier curve (Afonso & Kazemi, 2016).
4. Computing education and health performance and efficiency
The following table shows results of the education and health performance and efficiency for the period 2007–2016, for input indicator, while for opportunity sub-indicators as output we used the only year 2016. The countries with a better result than the average of the sample countries which is 1.00 are considered as countries with the best value of performance and efficiency. Countries with lower performance index lower than the average 1.00 are considered as countries with lower efficiency public spending.
Performance and Efficiency of Education and Health indicators
Table 4. Summary results
|
Country |
PSP Education |
PSE Education |
PSP Health |
PSE Health |
Country |
PSP Education |
PSE Education |
PSP Health |
PSE Health |
|
Albania |
0.95 |
0.89 |
0.89 |
1.72 |
Latvia |
1.09 |
1.20 |
0.91 |
1.27 |
|
Armenia |
0.89 |
1.02 |
0.84 |
2.43 |
Lithuania |
1.01 |
1.06 |
0.97 |
1.16 |
|
Austria |
0.92 |
0.86 |
1.07 |
0.91 |
Luxembourg |
0.99 |
0.93 |
1.09 |
1.31 |
|
Belgium |
1.48 |
1.11 |
1.06 |
0.78 |
(FYROM) |
0.79 |
0.90 |
0.96 |
1.23 |
|
B&H |
0.90 |
1.09 |
0.97 |
0.83 |
Malta |
0.89 |
0.78 |
1.04 |
0.99 |
|
Bulgaria |
0.94 |
1.20 |
0.88 |
1.25 |
Montenegro |
0.90 |
1.02 |
0.98 |
1.49 |
|
Croatia |
0.93 |
1.26 |
0.99 |
0.85 |
Netherlands |
1.22 |
0.95 |
1.06 |
0.77 |
|
Cyprus |
0.93 |
0.95 |
1.06 |
1.84 |
Norway |
1.01 |
0.79 |
1.08 |
0.82 |
|
Czech Rep. |
1.03 |
1.12 |
1.04 |
0.79 |
Poland |
1.01 |
1.18 |
1.00 |
1.19 |
|
Denmark |
1.18 |
0.97 |
1.06 |
0.71 |
Portugal |
1.10 |
1.08 |
1.07 |
0.88 |
|
Estonia |
1.01 |
0.93 |
1.02 |
1.12 |
Romania |
0.92 |
1.39 |
0.91 |
1.15 |
|
Finland |
1.34 |
0.99 |
1.08 |
0.79 |
Russia |
1.03 |
1.17 |
0.85 |
1.29 |
|
France |
1.09 |
1.02 |
1.08 |
0.77 |
Serbia |
0.43 |
0.57 |
0.94 |
0.83 |
|
Germany |
0.96 |
0.76 |
1.06 |
0.86 |
Slovakia |
0.90 |
1.30 |
0.97 |
0.79 |
|
Greece |
0.95 |
1.34 |
1.06 |
1.16 |
Slovenia |
0.99 |
1.02 |
1.07 |
0.90 |
|
Hungary |
0.97 |
1.40 |
0.97 |
1.07 |
Spain |
1.19 |
1.32 |
1.08 |
0.97 |
|
Iceland |
1.03 |
0.82 |
1.10 |
0.83 |
Sweden |
1.27 |
1.14 |
1.09 |
0.89 |
|
Ireland |
1.19 |
0.91 |
1.06 |
0.78 |
Switzerland |
0.94 |
0.64 |
1.08 |
2.26 |
|
Italy |
0.96 |
1.06 |
1.09 |
0.86 |
Turkey |
0.99 |
1.31 |
0.87 |
1.12 |
|
Kazakhstan |
1.04 |
1.19 |
0.81 |
1.97 |
Ukraine |
0.91 |
0.79 |
0.86 |
1.21 |
|
Kosovo |
0.67 |
0.72 |
0.88 |
0.99 |
U.K. |
1.05 |
0.94 |
1.06 |
0.81 |
|
Western Balkans |
0.77 |
0.86 |
0.94 |
1.18 |
|||||
|
EU Countries |
1.05 |
1.08 |
1.03 |
0.99 |
|||||
|
Average |
1.00 |
1.00 |
1.00 |
1.00 |
|||||
|
Maximum |
1.48 |
1.34 |
1.09 |
2.43 |
|||||
|
Minimum |
0.43 |
0.57 |
0.81 |
0.77 |
|
|
|
|
|
Note: Western Balkan include a mean for six countries: Albania, B&H, Montenegro, Kosovo, Republic of North Macedonia, and Serbia. While UE Countries include twenty-seven countries. Source: Calculation by the author
The above table shows that the education score ranges from 0.43, the minimum, to 1.48, the maximum. By the analysis of the results, Belgium (1.48), Finland (1.33), and Sweden (1.26) are ranked as the countries with the best education performance, while North Macedonia (0.79) and Kosovo (0.67), and Serbia (0.43), are ranked as the countries with the lowest index of performance from all countries in the sample. Kosovo in this index ranks 41st out of 42 countries in this sample, with a performance index of 0.67, 35 percent below the average of 1.00. The health score performance ranges from 0.80, the minimum, to 1.1, the maximum, countries like Iceland (1.10), Luxemburg (1.09), and Italy (1.09) are of best performance in this sector. On the other hand, Russia (0.85) and Armenia (0.83) are considered as countries with low indicator of performance. Kosovo, in this area, ranks 39th out of 42 countries, with a performance index of 0.87, 15 percent below the average of 1.00. Whereas, following the table above, the efficiency score for the indicator of health (PSE) shows that countries that are considered with the best performance index of indicator, are not amidst the countries that are treated as having an efficient level index. Many countries that have performed relatively well on PSP index indicators, are ranked low in PSE index indicators. The ratio of performance and relevant expenditures shows that the countries with the lowest expenditures have achieved better efficiency in the education and health sectors. Further, we can indicate that the ratio of performance indicators of social goods (health, education) and increasing level of relevant public expenditure are inversely correlated (Nenkova & Mihaylova-Borisova, 2020). These findings support the hypothesis that a higher level of relevant public expenditure concludes with a lower efficiency index on the education and health sector (Afonso, Romero, & Monsalve, 2013; Prasetyo & Zuhdi, 2013; Wang, et al., 2020; Herrera & Ouedraogo, 2018; Sun, 2017; Albassam, 2020; Liu & Xia, 2019).
5. Computing Data Envelopment Analysis (DEA)
5.1. Input-output efficiency analysis; Education sector
The following table shows the results of the data processing with the DEA model, using normalization of public expenditure on education as input, while PSP results in the education sector as output.
Table 5. Summary results of model performed with the DEA method
|
Input – education expenditure |
Input-oriented |
Output-oriented |
||
|
Output –TPSP |
Assumption CRS |
Assumption VRS |
Assumption CRS |
Assumption VRS |
|
Mean |
72.78 |
76.69 |
72.78 |
79.43 |
|
DS |
14.26 |
14.55 |
14.26 |
12.71 |
|
Min |
40.24 |
45.7 |
40.24 |
41.44 |
|
Max |
100 |
100 |
100 |
100 |
|
Efficiency Country |
HU |
BE, HU, ES |
HU |
BE, HU, ES |
|
Number of efficient seats out of total |
1 |
3 |
1 |
3 |
Note: CRS – Constant Returns to Scale; VRS – Variable Returns to Scale; DS – Standard Deviation; HU – Hungary, BE – Belgium, SP – Spain.
Source: Calculation by the author
In the analysis by computing the input-oriented efficiency, it is assumed that countries can achieve the same level of output without changing the level of input used. According to the results from the table above, countries like Hungary, Belgium, and Spain are the countries that have achieved a 100% efficiency score and are considered the most efficient countries in terms of education spending among the all sample countries. Based on the obtained results, it was noticed that the average of the countries included in the study reached an efficiency of 76.69. This result shows that these countries can reduce relevant public expenditure by 24% and maintain the same level of education performance.
While the output-oriented efficiency assumed that countries could have increased the level of results in education with the same amount of resources. The results obtained from the output-oriented efficiency analysis show that the countries included in the sample achieved an efficiency of 79.43, interpreting it so that the countries in the sample could have increased the level of output in this sector by 21% using the same level of public expenditure on education (inputs).
Kosovo is assessed in this analysis as an inefficient country. The value of its input-oriented index is 40.24, which means that Kosovo can achieve the same level of performance in the education sector by using 60% less of relative public expenditure. While the value of the output-oriented index is 45.26, which means that Kosovo has been able to increase the level of output in the education sector by 55% using the same level of relative public expenditure. Thus, Kosovo compared to other countries in the sample is within the limits of production opportunities and uses public expenditure on education inefficiently.
5.2. Input-output efficiency analysis; Health sector
To evaluate the input-output efficiency analysis, in this model PSP health is used as output, while normalization of health expenditures is used as input. The results obtained from the analysis of the DEA model are summarized in the table below.
Table 6. Summary results of model performed with the DEA method
|
Input - Health Expenditure |
Input-oriented |
Output-oriented |
||
|
Output – TPSP |
Assumption CRS |
Assumption VRS |
Assumption CRS |
Assumption VRS |
|
Mean |
47.64 |
53.19 |
47.64 |
90.05 |
|
DS |
16.71 |
20.02 |
16.71 |
6.92 |
|
Min |
31.3 |
31.53 |
31.3 |
78.17 |
|
Max |
100 |
100 |
100 |
100 |
|
Efficiency Country |
1 |
4 |
1 |
4 |
|
Number of efficient seats out of total |
CH |
CH, LUX AR, IS |
CH |
CH, LUX AR, IS |
Note: CRS – Constant Returns to Scale; VRS – Variable Returns to Scale; DS – Standard Deviation; LUX – Luxemburg, AR – Armenia, CH – Switzerland.
Source: Calculation by the author
According to the results of the input-output efficiency along the production opportunity curve, it is noticed that Luxembourg, Switzerland, and Armenia have achieved the efficiency result of 100% from all countries in the sample. All of these states are on the verge of productivity and are treated as efficient states in terms of the health sector. Based on the results obtained from the input-oriented efficiency, it is concluded that the countries in the sample achieve an efficiency of 47.64. This result shows that these countries have the potential to reduce health expenditure by 53% and keep a constant level of output in the health sector. While the results obtained from the output-oriented efficiency show that the countries included in the sample achieve an efficiency of 90, interpreting it so that the countries in the sample could have increased the level of outputs by 10% using the same level of inputs.
In the analysis of the input-output efficiency model, Kosovo performed better in the health sector than the education sector. The value for the input-oriented efficiency is 47.3, and the value for the output-oriented efficiency is estimated at 80.12. So, according to the results achieved by PSP in health, it means that Kosovo could have increased output in this sector by 20% with the same level of public expenditure allocated to this sector. Kosovo is ranked among the all countries in the sample as a country with an average use of public spending on health, so among all countries in the sample it is ranked 24th. Although Kosovo has recently increased public spending in the health sector, increased social programs used to fight poverty and improve social welfare, it has not achieved the maximum benefits that society derives from these public resources compared to the sample countries. Moreover, according to this perspective, Kosovo needs to focus more on the efficiency of public spending on health in order to have a better performance in this sector, because Kosovo is on average below in terms of life expectancy. Also, health indicators included in this study, reflect high quality and access to health equity (Afonso, Schuknecht, and Tanzi, 2005). According to the World Bank, Kosovo needs to design reforms that are in line with the objectives of improving health outcomes and protecting financial risk.3
6. Conclusions and Implications
This study aimed to assess the performance and efficiency of the government public expenditure in the education and health sectors in Kosovo, compared to 42 countries, in particular to the countries of the Western Balkans, during the period 2007–2016 by examining Public Sector Performance (PSP), Public Sector Efficiency (PSE) and Data Envelopment Analysis (DEA) Techniques. Significant differences have been found in the level of education and health within Western Balkan countries and EU Countries. Kosovo in this study is ranked 41st out of 42 sample countries, in terms of the education sector. The health sector, on the other hand, performed better than the education sector, ranking 39th out of 42 sample countries.
We find similar results applying input-output efficiency analysis for the education and health sectors. According to Data Envelopment Analysis (DEA), for the education sector, the countries in the sample can reduce relevant public expenditure by 24% and maintain the same level of education performance. Whereas, results of the input-output efficiency along the production opportunity curve, for health sector, show that Luxembourg, Armenia and Switzerland, are treated as efficient states in terms of the health sector. Based on the results obtained for the input-oriented efficiency, it is concluded that the countries in the sample achieve an efficiency of 47.64. This result shows that these countries have the potential to reduce health expenditure by 53% and keep a constant level of output in the health sector.
The results obtained show that majority of countries that have performed relatively well in PSP index indicators are ranked low in PSE index indicators. The ratio of performance and relevant expenditures shows that the countries with the lowest expenditures have achieved better efficiency in these sectors. For more, we can state that the ratio of performance indicators of social goods (health, education) and increasing level of relevant public expenditure are inversely correlated. These findings support the hypothesis that a higher level of relevant public expenditure results in a lower outcome efficiency achieved. This paper provides important implications for policymakers. Policymakers in emerging economies, like Kosovo, can generate adequate economic growth and achieve significant budget savings by increasing the efficiency of public expenditure.
Limitations and future research
This study is not without limitations. Due to a lack of data, some important sub-indicators have been omitted from the study. Namely, the quality of math and science education index, number of hospital days, and health outcomes that can be measured by the number of patients able to return to a productive life were not included. Future studies should include these indicators.
Moreover, the use of DEA in cross-country comparisons in health sector efficiency remains inconclusive (Spinks & Hollingsworth, 2009). The methods lack robustness and the research falls short in providing policy implications.
Bibliography
Afonso, A. & Aubyn, M. (2004). Non-Parametric Approaches to Education and Health Expenditure Efficiency in OECD Countries. SEG-UTL Economics Working Paper No. 1/2004/DE/CISEP/UECE.
Afonso, A. & Kazemi, M. (2016). Assessing Public Spending Efficiency in 20 OECD Countries. WORKING PAPERS, Lisbon School of Economics and Management. Departament of Economics .
Afonso, A., Romero, A. & Monsalve, E. (2013). Public Sector Efficiency Evidence for Latin America. Inter-American Development Bank.
Afonso, A., Schuknecht, L. & Tanzi, V. (2005). Public sector Efficiency; An international comparison. Public Choice,123, 321–347. https://doi.org/10.1007/s11127-005-7165-2
Afonso, A., Schuknecht, L. & Tanzi, V. (2006). Public Sector Efficiency, Evidence for new EU member states and Emerging Markets. Europian Central Bank. https://www.ecb.europa.eu/pub/pdf/scpwps/ecbwp581.pdf
Afonso, A., Schuknecht, L. & Tanzi, V. (2007). Public Sector Efficiency; Evidence for New EU Member States and Emerging Markets. Applied Economics, 2147-2164. https://doi.org/10.1080/00036840701765460
Ahec Šonje, A., Deskar-Škrbić, M. & Šonje, V. (2018). Efficiency of public expenditure on education: comparing Croatia with other NMS.. MPRA, Munich Personal RePEc Archive, 2317-2326.
Ahmed, S. et al. (2019). Measuring the efficiency of health systems in Asia: a data envelopment analysis. BMJ open, Volume 3. http://dx.doi.org/10.1136/bmjopen-2018-022155
Albassam, B. A. (2020). Government spending and economic growth in the Middle East and North Africa region. International Review of Administrative Sciences. https://doi.org/10.1177%2F0020852320969802
Antonelli, M. A. & De Bonis, V. (2017). Social Spending, Welfare and Redistribution; A Conmperative Analysis of 22 European Countries. Modern Economy,8(11). https://doi.org/10.4236/me.2017.811087
Antonelli, M. A. & De Bonis, V. (2019). The efficiency of social public expenditure in European countries: a two-stage analysis. Applied Economics, 51(1), 47–60. https://doi.org/10.1080/00036846.2018.1489522
Arias Ciro, J. & Torres García, A. (2018). Economic efficiency of public secondary education expenditure: how different are developed and developing countries? Desarrollo y Sociedad , 80, 119–154.
Azhykulova, P. D. C. A. (2015, September 9-11). Efficient and Effective Public Spending for Sustainable Economic Growth. International Conference on Eurasian Economies, Kazan, Russia. https://doi.org/10.36880/C06.01384
Bhanumurthy, N. R., Prasad, M. & Jain, R. (2018). Public expenditure, governance and human development. Economic & Political Weekly, 53(14), 36–46.
Charnes, A., Cooper, W. & Rhodes, E. (1978). Measuring the efficiency of decision making units. European Journal of Operational Research, 2(6), 429–444. https://doi.org/10.1016/0377-2217(78)90138-8
Ciro, J. A. & Garcial, A. G. (2018). Economic efficiency of public secondary educationexpenditure: How different are developed anddeveloping countries? Revista Desarollo y Sociedad, 80(4), 119–154.
Coelho, M. C. & Watt, P. (2006). The Efficiency Of English Local Governments. http://webh01.ua.ac.be/pubsector/madrid/papers/paper%20coelho%20watt.doc..
Dincă, G., Dincă, M. S. & Andronic, M. L. (2020). The efficiency of the healthcare systems in EU countries–A DEA analysis. Acta Oeconomica , 70(1), 19–36.
E.Stiglitz, A. B. (1980). Lecture on Public Economics. s.l.:McGrave-Hill.
Farrell, M. J. (1957). The Measurement of Productive Efficiency. Journal of the Royal, 120(3), 253–290.
Flores, I. (2017). Modelling efficiency in education: how are European countries spending their budgets and what relation between money and performance. Sociologia, Problemas e Práticas, 83, 157–170.
Gavurova, B., Kocisova, K., Belas, L. & Krajcik, V. (2017). Relative efficiency of government expenditure on secondary education. Journal of International Studies , 10(2), 329–343. https://doi:10.14254/2071-8330.2017/10-2/23
Ghosh, S. & Gregoriou, A. (2008). The Composition of Government Spending and Growth: Is Current or Capital Spending Better ?. Oxford Economic Papers, 60, 484–516.
Grigoli, F. (2012). Public Expenditure in the Slovak Republic: Composition and Technical Efficiency. International Monetary Fund.
Grigoli, F. & Kapsoli, J. (2018). Waste not, want not: The efficiency of health expenditure in emerging and developing economies. Review of Development Economics, 22(1), 384–403. https://doi.org/10.1111/rode.12346
Gupta, S., Honjo, K. & Verhoeven, M. (1997). The Efficiency of Government Expenditure: Experiences from Africa. IMF Working Paper.
Hauner, D. & Kyobe, A. (2008). Determinants of Government Efficiency. IMF Working Paper - Fiscal Affairs Department.
Herrera, S. & Ouedraogo, A. (2018). “Efficiency of public spending in education, health, and infrastructure: an international benchmarking exercise.. World Bank Policy Research Working Paper.
Herrer, S. & Pang, G., n.d. Efficiency of Public Spending in Developing Countries: An Efficiency Frontier Approach.
Ibanez, J. S., Garraton, M. C. G. & Soto, M. A. (27.09.2020). A literature review of DEA efficiency methodology in defence sector. Academia Revista Latinoamericana de Administracion.
Kazemi, M. (2016). Assessing Public Spending efficiency in 20 OECD country. Lisboa, School of Economics & Management.
Kimaro, E. L., Keong, C. C. & Sea, L. L. (2017). Government expenditure, efficiency and economic growth: a panel analysis of Sub Saharan African low income countries. African Journal of Economic Review , 5(2), 34–54.
Kimaro, E. L., Keong, C. C. & Sea, L. L. (2017). Government expenditure, efficiency and economic growth: a panel analysis of Sub Saharan African low income countries. African Journal of Economic Review, 5(2), 34–54.
Lavado, F. & Cabanda, C. (2009). The efficiency of health and education expenditure in the Philippine. Central European Journal of Operations Research, 17(3), 278–291. http://dx.doi.org/10.1007/s10100-009-0095-1
Liu, W. & Xia, Y. H. J. (2019). Health expenditure efficiency in rural China using the super-SBM model and the Malmquist productivity index. International journal for equity in health, 18(1), 1–13. https://doi.org/10.1186/s12939-019-1003-5
Manddl, U., Dierx, A. & Ilzkovitz, F. (2008). The Effectiveness and efficiency of public Spending. Econonic and Financial Affairs.
Montes, G. C., Cesar, J., Bastos, A. & de Oliveira, A. J. (2019). Fiscal transparency, government effectiveness and government spending efficiency: Some international evidence based on panel data approach. Economic Modelling, 79, 211–225. https://doi.org/10.1016/j.econmod.2018.10.013
Moreno-Enguix, M. D. R. & Bayona, L. V. L. (2017). Factors Affecting Public Expenditure Efficiency in Developed Countries. Politics&Policy, 45(1), 105–143. https://doi.org/10.1111/polp.12194
Nenkova, P. & Mihaylova-Borisova, G. (2020). Government expenditure efficiency and macroeconomic performance of Balkan countries: DEA approach. Economic and Social Development: Book of Proceedings, 439–448.
Pitlik, H. & Schratzenstaller, M. (2011). Growth implications of structure and Size of Public Sector. No.404 WIFO, Working papers.
Prasetyo, A. D. & Zuhdi, U. (2013). The Government Expenditure Efficiency towards the Human Development. Procedia Economics and Finanace.
Pula, L. & Elshani, A. (2018). Role of public expenditure in economic growth: Econometric evidence from Kosovo 2002–2015. Baltic Journal of Real Estate Economics and Construction Management , 6(1), 74–87.
Pula, L. & Elshani, A. (2018). The Relationship between Public Expenditure and Economic Growth in Kosovo: Findings from a Johansen Co-Integrated Test and a Granger Causality Test. Ekonomika, 97(1), 47–62. https://doi.org/10.15388/Ekon.2018.1.11778
Rodrik, D. (2000). Instutions for high-quality growth; What they are and how to Acquire them. NBER Working Paper.
Rothstein & Teorell, n.d. Defining and measuring quality of government. http://iis-db.stanford.edu/docs/623/rothstein%teorell2012.pdf.
Simar, L. & Wilson, P. (2000). Statistical inference in non-parametric frontier models: The state of the art. Journal of Productivity Analysis, 13, 49–78.
Spinks, J. & Hollingsworth, B. (2009). Cross-country comparisons of technical efficiency of health production: a demonstration of pitfalls. Applied Economics, 41(4), 417–427. https://doi.org/10.1080/00036840701604354
Sun, D. H. A. T. L. a. W. Z. (2017). Evaluation of the performance of national health systems in 2004-2011: an analysis of 173 countries. PLoS ONE, 12(3), e017334612(3). https://doi.org/10.1371/journal.pone.0173346
Tanzi, V. (2010). Public Sector efficiency: evidence for new EU member states and emerging markets. Applied Economics, 581, 2147–2164.
Tanzi, V., Afonso, A., Schuknecht, L. & Veldhuis, N. (2007). Public Sector Efficency: An International Comparison. Fraser Alert, Market Solutions of public policy problems.
Tanzi, V. & Zee, H. (1997). T Fiscal policy and long-run growth. IMF Staff Papers. IMF Staff Papers 44, 179–209.
Wang, M., Gilmour, S., Tao, C. & Zhuang, K. (2020). Does scale and efficiency of government health expenditure promote development of the health industry? International Journal of Environmental Research and Public Health, 17(15), 5529. https://doi.org/10.3390%2Fijerph17155529
Zugravu, B.-G. & Sava, A.-S. (2012). Recent Changes in public sector efficiency in Romania; Determinants and implications. Procedia - Social and Behavioral Sciences, pp. 423-433.