Ekonomika ISSN 1392-1258 eISSN 2424-6166
2022, vol. 101(2), pp. 70–91 DOI: https://doi.org/10.15388/Ekon.2022.101.2.5
Development of Energy Supply Infrastructure Based on Industry 4.0 (on the Example of Ukraine and Turkey)
Serhii Voitko
Department of International Economics, National Technical University of Ukraine
the “Igor Sikorsky Kyiv Polytechnic Institute”, Ukraine
Email: s.voytko@kpi.ua
Serhii Naraievskyi
Department of International Economics, National Technical University of Ukraine
the “Igor Sikorsky Kyiv Polytechnic Institute”, Ukraine
Email: s.naraevsky@ukr.net
Olena Trofymenko
Department of Economic Cybernetics, National Technical University of Ukraine
the “Igor Sikorsky Kyiv Polytechnic Institute”, Ukraine
Email: o.o.trofymenko@gmail.com
Abstract. The object of research was to identify the field of renewable energy for ensuring the process of gradual transition from traditional energy to carbon-free technologies. The article compares the opportunities for energy development, taking into account current trends in sustainable development. The conducted analysis of energy resources in the section of renewable energy is based on the processing of available sources of analytical and statistical information. The study investigates the structure and features of the functioning of the energy sector of Ukraine and Turkey. There have been revealed several common problems of functioning of energy spheres in Ukraine and Turkey. The article investigates the possibilities of using technological solutions and principles of Industry 4.0 in ensuring energy security through the development of the electric car market. The analysis consists of calculations of the efficient functioning of solar and wind energy for Ukraine and Turkey. The article provides recommendations for the development of possible mutually beneficial cooperation between Ukraine and Turkey in the field of renewable energy.
Key words: energy market transformation, renewable energy; Industry 4.0, installed capacity efficiency.
_________
Received: 14/01/2022. Revised: 19/02/2022. Accepted: 30/06/2022
Copyright © 2022 Serhii Voitko, Serhii Naraievskyi, Olena Trofymenko. Published by Vilnius University Press. This is an Open Access article distributed under the terms of the Creative Commons Attribution License, which permits unrestricted use, distribution, and reproduction in any medium, provided the original author and source are credited.
1. Introduction
The development of partnership relations between Ukraine and Turkey is mutually beneficial because both countries have identical problems and common interests in different areas: trade, investment, transport infrastructure development, defense, and energy. These areas are interrelated and successful development even in one sphere requires significant progress in others (Official internet office of President of Ukraine, 2021). Thus, the gradual transformation of energy complexes of both countries is complicated without appropriate investment, using high level of technological equipment, development of supply networks, etc. Although, special attention needs to be paid to the application of the principles of Industry 4.0 in the field of energy.
Ukraine and Turkey are dependent on energy imports. Mutually beneficial development and operation of transport corridors for energy supplies from Asia to Europe, as well as active development of Black Sea resources, should reduce such dependence, expand the range of energy suppliers and countries that can be consumers of these resources, and contribute to the additional inflow of funds into the economy of each country. This article is a continuation of scientific work (Voitko et al., 2021).
Energy in both countries, taking into account the requirements Sustainable Development Goals (SDGs) (Goal 6. Affordable and Clean Energy) or Global Goals (Department of Economic and Social Affairs), needs to be transformed by reducing energy production through different technologies of burning traditional energy resources (oil, natural gas, coal) and products of their processing through the active development of carbon-free energy production technologies, particularly solar energy (photovoltaics) and wind energy. The development of these areas of renewable energy is quite successful in the leading countries of Europe, China, and the United States. Ukraine and Turkey should take into account global trends, including the principles of Industry 4.0. In addition, the “Energy Strategy of Ukraine until 2035” was implemented in Ukraine. It includes the development of renewable energy as one of the priority areas of energy development in general (Official internet office of President of Ukraine, 2021). This should facilitate not only the reduction of the harmful impact on the environment but also the gradual transition to a new technological level of Industry 4.0, the involvement of highly qualified specialists (Ilyash et al. 2021).
The dynamic development of electric vehicles involves a complete change in relations in the field of production and operation of vehicles. The essential part of European countries and some other countries in the world plan to ban the sale of cars with internal combustion engines during the period from 2030 to 2035. An appropriate network of filling stations and the sphere of technical support service of electric vehicles should be ready for such a transition. The active development of electric transport creates a problem of its further processing and utilization, which hardly anyone mentions nowadays. In addition, electric cars are particularly a product of Industry 4.0.
In this research, we will try to determine whether it is possible to replace traditional energy sources (oil, gas, coal) with renewable energy, including solar and wind, and to calculate how much capacity in Ukraine and Turkey will be needed to put into operation for such transformation.
2. Literature Review
Different areas of alternative energy development are explored in the reports of international organizations. One of the most complete and detailed is the annual report of the Renewable Energy Policy Network for the 21st Century (REN21). It (Renewables 2021 Global Status Report) analyses the general situation in the global overview; policy landscape in various areas of energy, transport, industry, environmental protection; market and industry trends; distributed renewables for energy access; investment flows; energy efficiency; renewables and decarbonization; demand for renewable energy (REN 21, 2021).
The International Renewable Energy Agency (IRENA) publishes a large amount of various information and analytical reports in various areas on its website: renewable energy technologies, trends and rates of development of various spheres of renewable energy, new kinds of transport, employment in various fields, renewable energy, regional reviews, etc. Thus, IRENA reports analyze: Renewable Capacity Statistics 2021 – the amount of input capacity for various renewable energy technologies in some regions and countries (IRENA, 2021); Renewable Power Generation Costs in 2020 – changes in the cost of energy for various renewable energy technologies (IRENA, 2021); Renewable Energy and Jobs. Annual Review 2020 – employment in various fields of renewable energy in some regions and countries (IRENA, 2020).
The statistical reports of the British oil company BP (Statistical Review of World Energy 2021) provide detailed information on the production, consumption, export and import of traditional energy resources (oil, natural gas, coal). They show volumes of electricity production in the electric power industry, in general, and in nuclear energy and hydropower, in particular; installed capacities and volumes of electricity production from alternative energy (wind energy, solar energy, bioenergy, other types of technologies); volumes of biofuel production by individual countries and regions of the world (BP Statistical Review of World Energy, 2021).
There are industry organizations that study the situation only in wind energy (The World Wind Energy Association (WWEA)), or solar energy (International Solar Energy Society (ISES)) and others.
One of the main documents based on which Ukraine’s energy should be developed is the “Energy Strategy of Ukraine until 2035” (Ministry of Energy of Ukraine, 2020).
The Ukrainian Renewable Energy Association provides on its website information on the dynamics of renewable energy development in Ukraine for the period from 2009 to 2019 (Ukrainian Renewable Energy Association, 2019).
The Ministry of Energy and Natural Resources (Turkish: Enerji ve Tabii Kaynaklar Bakanlığı) operates in Turkey. The Strategic Energy Development Plan of Turkey for the period from 2019 to 2023 is currently in force (Ministry of Energy and Natural Resources of Turkey, 2020).
3. Methodology
The main scientific hypotheses of the study are: 1) mutually beneficial cooperation in key areas (trade, investment, transport, defense, energy) will allow countries to develop based on the latest trends in Industry 4.0; 2) change the structure of the energy balance in the studied countries from the dominance of traditional energy in favour of renewable energy.
Investigating energy development trends in Ukraine and Turkey during the period 2010–2020, methods of structural analysis and comparative analysis were used. The share of each form of energy resources in primary energy consumption was singled out and the impacts on the economy and ecology were analyzed. This provided an opportunity to further substantiate the feasibility of a gradual transition to wider use of renewable resources.
Analyzing problematic issues in the energy sector of Ukraine and Turkey, the method of analogy was used. It was pointed out that despite some differences in the structure of generation, energy problems in both countries are the same and approaches to overcome them may be similar, and higher results can be achieved by sharing experiences and joining forces.
When assessing the development of electric vehicles, one should be guided by the method of historical chronology, through the study of trends in oil prices and through the use of the method of comparative analysis to determine the feasibility of producing cars with internal combustion engines or electric vehicles at the appropriate level of oil prices.
The main purpose of the study is to substantiate the possible transition to more environmentally friendly technologies of electricity production, namely, the replacement of existing thermal power plants with solar and wind power plants, which should help reduce the harmful impact on the environment.
Volume of electricity production by thermal energy in Ukraine in 2020 was 55.8 billion kWh ; some energy sources for this amount were: oil – 0.7 billion kWh, gas – 13.9 billion kWh, coal – 41.2 billion kWh. In Turkey, thermal energy produced 176.2 billion kWh in 2020; some energy sources for this amount were: oil – 0.1 billion kWh, gas – 70.0 billion kWh, coal – 106.1 billion kWh (BP Statistical Review of World Energy, 2021). The most harmful for the environment source of energy is coal. The installed capacity utilization rate in thermal energy is considered appropriate at the level of 50.0–70.0%, although in recent years in Ukraine it did not exceed 30.0%, which is related with equipment deterioration of the main generating capacity and dependence on fuel imports from abroad, which can be deficient during the heating season. For NPPs, the installed capacity utilization ratio is in the range of 70.0–90.0%.
We will calculate what amount of electricity can be substituted (generated during the calendar year) by introducing a capacity of 1,000 MW in solar or wind energy. In addition, we need to analyze how much capacity should be put into operation to replace thermal power capacity in Ukraine and Turkey. To get accurate results, it is advisable to determine the possible, based on calculations from existing data, percentage of installed capacity in wind and solar energy. According to the research Renewables 2021 Global Status Report conducted by REN21, the percentage of installed capacity is: in solar energy (photovoltaics) – 10.0–25.0%; in land-based wind energy – 25.0-40.0%; in offshore wind energy – 35,0–45.0%. According to the same research, the investment costs are: for solar energy (photovoltaics) – 1,200–1,950 dollars / kW; in land-based wind energy – 1,500–1950 dollars / kW; in offshore wind energy – 4,500–5,500 dollars /kW. The cost of electricity generated by such power plants is: in solar energy (photovoltaics) – 14–34 cents / kWh; in land-based wind energy – 4–16 cents / kWh; in offshore wind energy – 15–23 cents / kWh (REN 2021).
The statistical reports of the British oil company BP (BP Statistical Review of World Energy, 2021) provide information on the volume of electricity production in solar and wind energy, as well as the volume of installed capacity for the calendar year in many countries around the world.
Taking the ratio of the volume of electricity produced (kWh) to the volume of installed capacity (kW) , we determine the Indicator of using installed capacity of electric power station (Ie) of solar and wind energy in Ukraine and Turkey.
 (1)
(1)
where WGen is the amount of generated electricity for the corresponding calendar year (kWh); WIns is volume of installed capacities at the end of the respective calendar year (kW).
The sequence of research is implemented by the following stages: analysis of energy resources in the sections of traditional energy and carbon-free technologies; the processing of available sources of analytical and statistical information about renewable energy; study of the structure and features of the functioning of the energy sector of Ukraine and Turkey; identification of common problems in the energy spheres of Ukraine and Turkey; study of the possibilities of using the principles of Industry 4.0 in ensuring energy security on the example of the development of the electric vehicle market; analysis of calculations of the efficiency of solar and wind energy; providing proposals for the development of mutually beneficial cooperation between Ukraine and Turkey in the field of renewable energy based on Industry 4.0.
New capacities in these directions of energy are embedded in rather significant volumes and it happens during a calendar year. The information in terms of introduction and connection to a network of new capacities is absent in free access. To increase the objectivity of the results, we assume that the new capacity is embedded evenly throughout the calendar year. For instance, the tools of Industry 4.0 will be able to provide control over the operation of both new capacity and, with appropriate modernization, already installed power generation capacity. To do this, we will reduce the capacity of each calendar year by half. The maximum value of the calculated indicator can be 8,760 kWh / kW (24 hours per day multiplied by 365 days per year). In the case of dividing the obtained number by 8,760 kWh / kW and multiplying by 100.0%, we obtain the percentage (share) of use of the installed power. As a result of such addition the formula (1) on the calculation of efficiency ( ) of use of the established capacity will get the following form:
 (2)
(2)
where WGen is the amount of electricity produced for the calendar year (kWh); WIns is total volume of installed capacity at the end of the respective calendar year (kW); WIns(new) is volume of new installed capacity for the respective calendar year (kW).
At present, it is impossible to achieve such a value in renewable energy. Solar radiation, reaching the earth’s surface, has different intensities, depending on the season (higher intensity in summer and lower in winter), weather conditions (clouds, fog, rain), part of the day (at night decreases to almost zero). In wind energy, wind flows are also not stable, and additional obstacles can be caused by the terrain, which reduces the final result. In the case of dividing the obtained number by 8,760 kWh / kW and multiplying by 100%, we get the percentage (share) of the installed power ( ).
).
 (3)
(3)
4. Retrospective analysis of energy development
The transition of human society from the use of one energy source to another occurred in world history many times. The use of wood as a fuel began about one and a half million years ago. Along with wood, the energy of the sun, wind, water and muscular strength of animals and humans was used. The use of coal as a fuel has been known since ancient Greece and China, but the subsequent transition from the use of wood as the main energy source to coal was caused by the Industrial Revolution in the eighteenth century. The development of metallurgy required more and more wood, which was no longer enough in Europe. The most developed European countries were the first to join this transition, first of all, England, and then the Netherlands, Belgium, Germany and France (Plachkova, S. & Plachkov, I., 2005).
The use of oil in the Middle East began as early as 6,000 BC, but on an industrial scale oil production began in the second half of the nineteenth century, and at the turn of the nineteenth and twentieth centuries, thanks to the invention of gasoline and diesel engines. Natural gas began to be used in the early nineteenth century for street and house lighting, first in London and then in other major European cities. On an industrial scale, the use of natural gas began in the 20s and 30s of the twentieth century (Plachkova, S. & Plachkov, I., 2005).
Since the XXI century, the beginning of a new transition to renewable energy can be traced, but coal, oil and natural gas continue to be the main energy sources in the world economy. According to the results of 2020, the share of each of these energy sources in the global consumption of energy resources (556.63×10¹⁸ J ) was: coal – 27.2% (151.42×10¹⁸J), oil – 31.21% (173.73×10¹⁸ J) , natural gas – 24.72% (137.62×10¹⁸ J). In total, these three types of energy resources provided 83.13% of global energy consumption, renewable resources in total – 5.7% (31.71×10¹⁸ J) and hydropower, which is sometimes also considered as a renewable resource, the remaining 6.85% (38.16×10¹⁸ J). In 2000, the total share of all renewable resources in global energy consumption (394.47×10¹⁸ J) was only 0.67% (2.64×10¹⁸ J), which confirms the growth of this indicator during this period by 8.5 times (BP Statistical Review of World Energy, 2021).
Nowadays, one of the popular directions of energy development is the development of electric vehicles. The development of electric transport in general and electric vehicles, in particular, is not new. The electric car appeared in the XIX century and this happened earlier than a car with an internal combustion engine appeared. In the early twentieth century, electric cars were widely used in the United States. Later, rising oil production and falling prices for gasoline and diesel fuel led to the transition to cars with internal combustion engines and the decline in the production of electric vehicles. During the twentieth century, the resurgence of significant interest in electric vehicles has occurred at least twice. The first time was in the 1960s and 1970s during the oil crises, but further declining of oil prices has led to a loss of interest in the development of electric transport. The second time happened in the 1990s, but due to certain agreements between automakers, oil companies and the US government, the development of electric vehicles was stopped again (Who Killed the Electric Car, 2006). Currently, the interest in the development of electric vehicles is primarily due to environmental factors. In the transition to mass production, cars with electric motors should be cheaper than similar cars with internal combustion engines, as the first option is much simpler from a technical point of view.
It is the innovative development of the energy sector that will ensure the development of the socio-economic sphere in the context of the Sixth Technological System, the Post-Industrial Age, the Knowledge Economy, and the Fourth Industrial Revolution (Industry 4.0). As well as compliance with the provisions of sustainable development, resource-saving, energy-saving, environmental protection for future generations.
5. Structure and features of functioning of the energy sector of Ukraine and Turkey
The structure of energy in Ukraine and Turkey has significant differences, but also some identical problems.
In Ukraine, total energy consumption tends to decrease gradually (Fig. 1). Thus, in 2010 energy consumption in Ukraine was 4.5×10¹⁸ J, and in 2020 decreased to 3.31×10¹⁸ J or 26.4%. The main reasons for this situation can be considered as crises situations in the economy of Ukraine and the reduction of the total population, hostilities in Crimea and the East. In Turkey, on the contrary, the total consumption of energy resources tends to increase, and for the period from 2010 (4.5×10¹⁸ J) to 2020 (6.29×10¹⁸ J) increased by 39.8%, due to economic growth and population growth (BP Statistical Review of World Energy, 2021). The volumes of primary energy consumption in Ukraine and Turkey for the period from 2010 to 2020 are shown in Figure 2 (BP Statistical Review of World Energy, 2021).
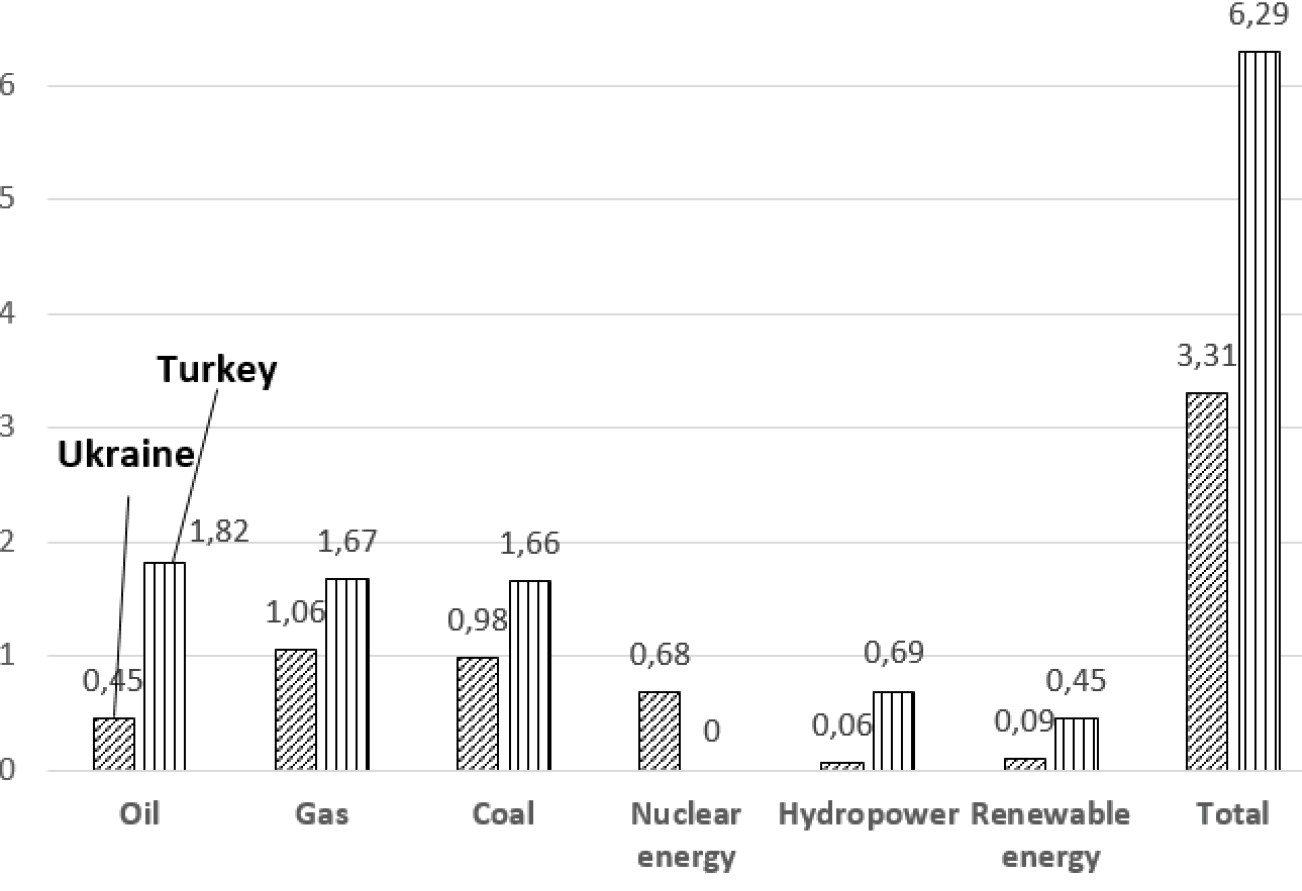
Figure 1. Volumes of primary energy consumption in Ukraine and Turkey in 2020, in 1018 J (calculations based on BP Statistical Review of World Energy, 2021)

Figure. 2. The volumes of primary energy consumption in Ukraine and Turkey for the period from 2010 to 2020 (BP Statistical Review of World Energy, 2021)
In terms of total primary energy consumption in 2020, Turkey (6.29×10¹⁸ J) is almost twice as high as Ukraine (3.31×10¹⁸ J), but if we take into account the indicator per person, nowadays the level of energy consumption in both countries will be at the same level: Turkey – 74.6 Gigacalories / person, Ukraine – 77.7 Gigacalories / person. However, as in general consumption, the trend is to decrease in Ukraine (in 2010 it was 111.3 Gigacalories / person, the reduction by 2020 was 30.2%) and to increase in Turkey (in 2010 it was 60.4 Gigacalories / person, growth by 2020 was 23.5%) (BP Statistical Review of World Energy, 2021). The volumes of primary energy consumption in Ukraine and Turkey per capita for the period from 2010 to 2020 are shown in Figure 3 (BP Statistical Review of World Energy, 2021).
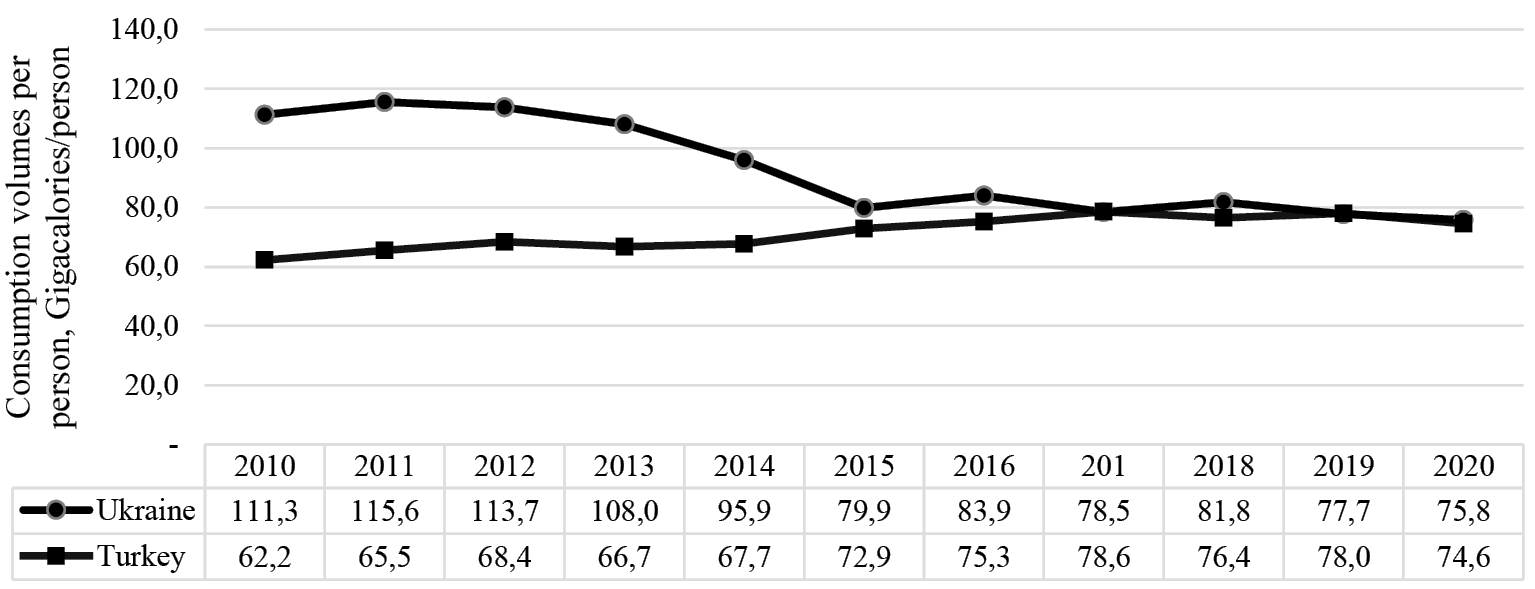
Figure 3. The volumes of primary energy consumption in Ukraine and Turkey per capita for the period from 2010 to 2020 (BP Statistical Review of World Energy, 2021)
The basis of energy in both countries are traditional energy resources: coal, oil, gas, and nuclear energy in Ukraine. Thus, in Ukraine the share of certain types of energy resources is: gas – 31.9%, coal – 29.7%, nuclear energy – 20.4%, oil – 13.6%, renewable energy – 2.7%, hydropower – 1.7%. In Turkey, the share of certain types of energy is: oil – 29.0%, gas – 26.5%, coal – 26.4%, hydropower – 11.0%, renewable energy – 7.1%. There are currently no operating nuclear power plants in Turkey, but since 2020, the Akkuyu nuclear power plant has been under construction in the south of the country by the Russian project with a total capacity of 4,800 MW (4 units of 1,200 MW) (BP Statistical Review of World Energy, 2021).
The structure of electricity production in Ukraine and Turkey also has significant differences. The main difference is the absence of nuclear power plants in Turkey, and a much larger share in the production of electricity by hydropower and renewable energy compared to Ukraine (Fig. 4).
The share of certain types of energy resources in the production of electricity in Ukraine was: nuclear energy – 51.1%, coal – 27.7%, gas – 9.3%, renewable energy – 6.5%, hydropower – 4.2%, oil – 0.5%, other types of resources in general – 0.7%. In Turkey, the share of certain types of energy resources in electricity production was: coal – 34.7%, hydropower – 25.6%, gas – 22.9%, renewable energy – 16.3%, oil – 0.03%, other types of resources in general – 0.4% (BP Statistical Review of World Energy, 2021).
Thus, the basis of Ukraine’s energy is nuclear energy and more than a third is coal and gas. In Turkey, more than half of electricity production is provided by coal and gas. The existing energy capacity of Ukraine allows to produce about 300 billion kWh of electricity per year in their normal functioning, and production volumes in 2020 (149 billion kWh) were about half of this figure. In Turkey, the available capacity allows to produce about 400 billion kWh, and production in 2020 (305.4 billion kWh) was 76.4% of available capacity.
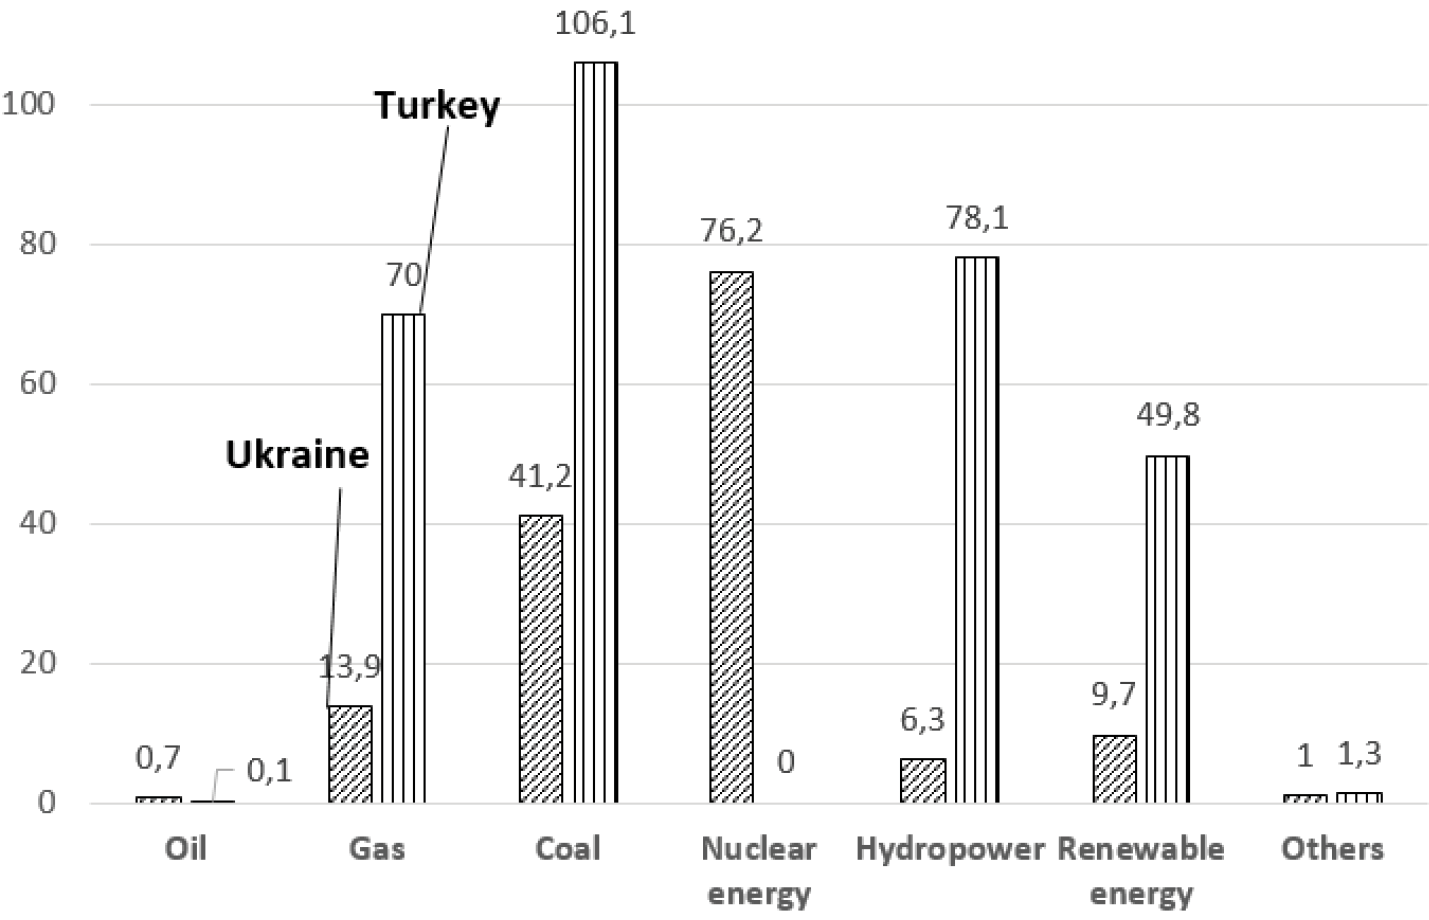
Figure 4. Volumes of electricity production in Ukraine and Turkey in 2020, in kWh (calculations based on BP Statistical Review of World Energy, 2021)
6. Common energy problems of Ukraine and Turkey and possible ways to overcome them
Despite significant differences in the sources of energy supply and the structure of electricity generation in Ukraine and Turkey, both countries have a list of identical problematic issues in their energy, in general, and in electricity in particular. The first common problem for both countries is their dependence on the supply of fuel and energy resources from abroad. Ukraine’s economy imports more than half of its energy resources (Ukrainian Institute of the Future, 2019), and Turkey receives about three-quarters of its energy resources from abroad (OECD, 2019). To overcome this problem, it is advisable to increase energy production using carbon-free technologies (wind energy, solar energy).
The next problem is the narrow range of suppliers of imported energy resources. For Ukraine, the main volume of fuel and energy resources comes from the Russian Federation. Other suppliers include Belarus, which supplies most of Ukraine’s imported fuel for motor transport which is made from Russian oil, as well as Azerbaijan and Kazakhstan. Ukraine imports nuclear fuel for its nuclear power plants in full (approximately 60.0% from Russia, and up to 40.0% from Sweden); up to a third of coal (approximately 90.0% of imports come from Russia, from the United States – up to 8.0%); about a third of natural gas (re-exports from European countries) (Ukrainian Institute of the Future, 2019). For Turkey, the main suppliers of energy resources are the Russian Federation, Azerbaijan, and Iran.
The third common problem arising from the previous one is the inefficient use of the transit potential of both countries, in general, and as a transit corridor for the transportation of energy resources from Asia to Europe. For Ukraine, first of all, it is an increase in the transit of hydrocarbons (oil and gas) from the countries of the Caspian Sea basin. The route can pass through Azerbaijan and Georgia, the Black Sea, Ukrainian seaports with further use of railway and pipeline transport of Ukraine to the western borders (Ministry of Infrastructure of Ukraine, 2021; National Institute for Strategic Studies, 2020; How to revive the transit potential of Ukraine, 2020). For Turkey, the transit of energy through its territory can be divided into several separate directions. One of them, as for Ukraine, is the transportation of energy from the countries of the Caspian region; the second is the supply of energy from Russia; the third is from the Persian Gulf countries. In the first case, there are already significant successes. The Trans-Anatolian gas pipeline from Azerbaijan through Turkey to the border with Greece began operating in 2019. In the second case, the Turkish Stream gas pipeline from Russia along the Black Sea to the European part of Turkey began operating in 2020 with further branching to the Balkan Peninsula. There are many obstacles to the successful implementation of the third direction, in particular, because of the military actions in Syria and the unstable situation in Iraq and other countries of the region.
Nevertheless, despite all obstacles, the Persian Gulf region has the largest known hydrocarbon reserves in the world, and the supply of oil and gas pipelines through Turkey could provide the shortest route to Europe, at the lowest cost.
The fourth problem is that the main energy sources in both countries are traditional energy resources: oil, natural gas, coal. Thus, according to the results of 2020, the share of these three energy resources in Ukraine’s energy consumption was 75.3% and taking into account nuclear energy, it increases to 95.7%. In Turkey, the share of the three main traditional energy sources is 81.9% (BP Statistical Review of World Energy, 2021).
In the production of electricity in Ukraine, the share of the three main energy resources is 37.4%, and in Turkey – 57.7%. Taking into account nuclear energy, this share in Ukraine reaches 88.6% (BP Statistical Review of World Energy, 2021). Such high indicators of traditional energy resources in primary energy consumption and electricity production indicate a significant negative impact of energy-generating equipment on the environment in both countries.
The fifth problem is the deterioration of power plant equipment. This problem is more relevant for Ukraine, as thirteen of the fifteen power units at the NP P were built during the Soviet era and in the coming years should reach the deadline and will require decommissioning. Only one unit at Khmelnytsky and Rivne NPPs was put into operation in the XXI century and their design life is calculated until 2034–2035. The thermal power plants of Ukraine, in the vast majority, have fulfilled their design life (40 years, or 100 thousand hours of operation for a single power unit) and need to be replaced.
Turkey’s thermal power plants are newer, but a significant part of them use low-grade domestic coal as fuel (the share of coal in energy consumption in 2020 was 26.4%, and in electricity production – 34.7%). This causes significant damage to the environment and, taking into account (Paris Climate Agreement, carbon footprint, etc.) it would be appropriate to replace such generating capacity with more environmentally friendly generation facilities.
Therefore, to overcome most of the problems described above, one of the best options is the development of energy technologies with low or zero emissions of harmful substances into the environment based on Industry 4.0. Solar energy (photovoltaics) and wind energy can transform.
7. Development of the automobile market based on electric transport
Global sales of electric vehicles in 2020 increased by 39.0% compared to the previous year and reached 3.1 million units, given that the total volume of the automotive market in 2020 decreased by 14.0%. In 2020, European countries as a whole (1.33 million units) were ahead of China (1.25 million units) in the number of purchased new electric vehicles. 296 thousand new electric cars were sold in the USA. In terms of market share of electric cars among sales of new cars, the leading positions were as follows: Norway – 74.8%, Iceland – 45.0%, Sweden – 32.2%. In the global ranking, the share of electric cars among new car sales, European countries occupied the top ten positions and 13 places out of the top 15. In China, this figure in 2020 was 6.2%, and in the United States – 2.3%. In 2021, the market for new electric vehicles is estimated at 5 million units, which should be about 7.0% of the global market for new cars (REN 2021, 2021, p. 208).
The market of electric cars, especially new ones, in Ukraine is developing at a rather slow pace compared to world leaders. According to the results of 2020, 799 new electric cars were sold on the automobile market of Ukraine, which is 22.7% higher than the previous year, but it does not exceed 1.0% of the total sales of new cars in Ukraine. In the first half of 2021, the volume of sales of new electric vehicles increased by 31.0% compared to the corresponding period of 2020, but it was only 0.88% of the total market of new cars in Ukraine. Most electric cars sold in Ukraine are already in use. The total volume of electric vehicles (new and those that were already in use) registered in Ukraine on July 1, 2021, was 28,772 units. The main reasons for the slow development of the automotive market in Ukraine are not the shortage of gas stations with electric charging, ignorance of buyers, but the low income of most citizens of Ukraine. The cheapest new electric car that is officially sold in Ukraine is a Nissan Leaf worth UAH 962,340 (at the official exchange rate of UAH 26.98 / USD, its cost will be about USD 35.7 thousand), which is significantly higher than the new cheapest cars with internal combustion engines, the price of which is about 10 thousand dollars (Autoconsulting, 2021).
The main reasons for the slow development of the automobile market in Ukraine are not the shortage of gas stations with electric charging, lack of knowledge of buyers, but the low level of income of the majority of Ukrainian citizens.
This conclusion is confirmed by the study “Electric cars: lower-income countries fall behind, with uptake linked to GDP per capita” conducted by the European Automobile Manufacturers Association (ACEA). The results of this study showed that a higher standard of living in the country (GDP per capita) provides a higher share of electric vehicles in total sales of new cars in this country and vice versa, the lower the standard of living, the lower this share. According to the results of 2020, the first five countries with the highest share of new electric cars among the countries of the European Union were the following countries: Sweden – 32.2% (GDP and per capita is 45,610 euros ), the Netherlands – 25.0% (45,790 euros), Finland – 18.1% (42,940 euros), Denmark – 16.4% (53,470 euros), Germany – 13.5% (40,070 euros). Accordingly, the bottom five of this ranking were the following countries: Cyprus – 0.5% (23,580 euros), Lithuania – 1.1% (17,460 euros), Estonia – 1.8% (20,440 euros), Croatia – 1.9% (12,130 euros), Poland – 1.9% (13,600 euros). The same applies to charging stations. The largest number of them is in the wealthy countries of Western Europe: the Netherlands – 66,665 units (29.7% of the total number in EU countries), France – 45,751 units. (20.4%), Germany – 44,538 units. (19.9%) For comparison, in Romania there are only 493 charging stations (0.2%) (Automobile Manufacturers Association (ACEA), 2021). Figure 5 shows the leading and outsider countries in terms of the share of electric cars in total sales in the EU, and Figure 6 shows the GDP per capita in the leading and outsider countries (ACEA, 2021).
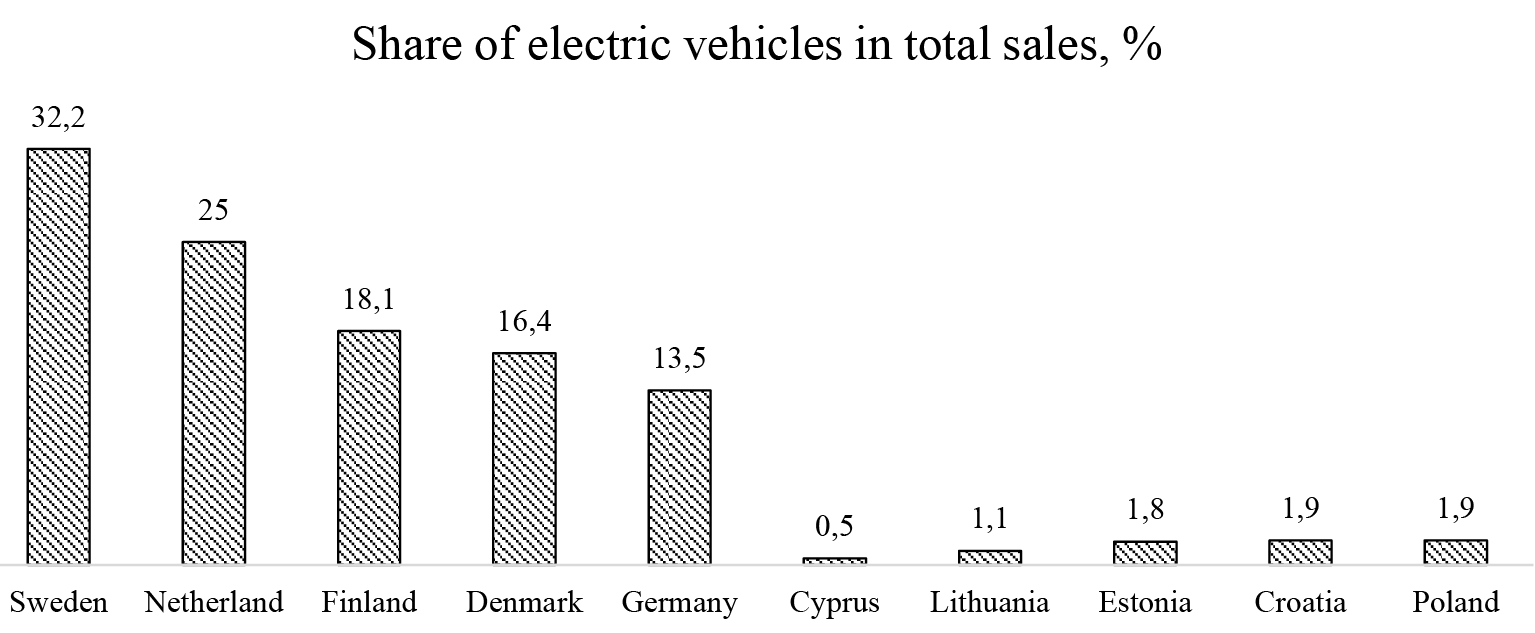
Figure 5. Leading countries (Sweden, Netherland, Finland, Denmark, Germany) and outsiders (Cyprus, Lithuania, Estonia, Croatia, Poland) in the share of electric cars in total car sales in the EU, % (ACEA, 2021)
At present, only some attempts are being made in Ukraine to support the production of electric vehicles. In particular, in Ukraine (15.07.2021) two legislative acts were adopted: №3476, the Law “On Amendments to the Tax Code of Ukraine and Certain Legislative Acts of Ukraine on Stimulating the Development of the Ecological Transport Sector in Ukraine”; №3477, the Law “On Amendments to the Customs Code of Ukraine to stimulate the development of environmental transport in Ukraine” (Ukravtoprom, 2021; The official web portal of the Parliament of Ukraine, 2020; Verkhovna Rada of Ukraine, 2021). These laws should promote the development of production of electric vehicles, chargers and components. In particular, they must be exempt from value-added tax on imported equipment until January 1, 2031 manufacturers who will produce cars equipped only with electric motors.
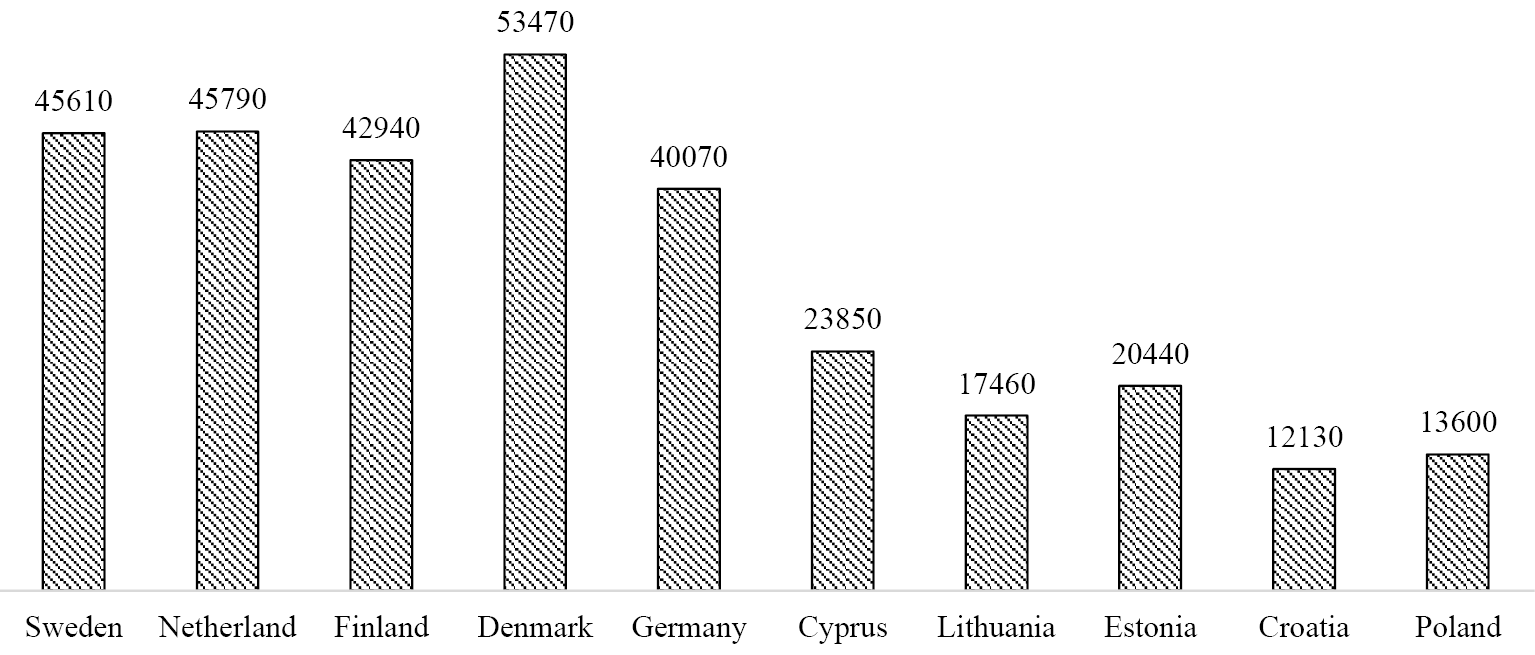
Figure 6. GDP per capita (PPS) in the leading countries (Sweden, Netherland, Finland, Denmark, Germany) and outsiders (Cyprus, Lithuania, Estonia, Croatia, Poland) by the share of electric cars in total car sales in the EU, euro (ACEA, 2021)
The next legislative changes that are still under consideration are a ban on the import of used cars with internal combustion engines into Ukraine from 2027, and a ban on the import of new cars with internal combustion engines from 2030. The average age of a car in Ukraine is 22.7 years (43.0% of cars were produced before 2000). For comparison, in Turkey the average age of cars is 12.0 years, the EU average is 10.7 years. In Ukraine, about 100,000 new cars are bought a year, and electric cars make less than one percent of them. Without appropriate legislative changes, the transition to electric vehicles could be significantly delayed. And in case of their acceptance and considered state support, capacities can be created for the production of up to 100 thousand electric cars in Ukraine per year (Ministry of Infrastructure of Ukraine, 2021).
Turkey has a strong automotive industry, which, for the most part, is represented by foreign manufacturers. In 2020, the total volume of car production in Turkey amounted to 1,298 thousand units (14th place in the world), 855 thousand of which are motor cars and 443 thousand are commercial vehicles. Exports of Turkish automotive products in 2020 amounted to about 25 billion dollars, and in the first half of 2021 – to 14.7 billion dollars (International Organization of Motor Vehicle Manufacturers (OICA), 2020; Automotive Manufacturers Association, 2021).
In support of the development of electric transport, Turkey has moved much further than Ukraine. In Turkey, there is a state program for the development of electric vehicles, which in 2018 established the company Turkey’s Automobile Joint Venture Group Inc. (TOGG), a plant is being built near the city of Bursa, and the total investment is 3.7 billion dollars. The release of new models is scheduled for 2022 (crossover) and 2024 (sedan). Prototypes of cars were presented in 2019 with the support of the Italian company Pininfarina (TOGG, 2019). Thanks to this project, Turkey plans to create a powerful national car manufacturer and enter a new market for electric vehicles. In addition, for the normal functioning of electric vehicles, Turkey has developed a state program for the development of electric charging stations (almost all of these stations contain elements of Industry 4.0), according to which there would be 251 thousand units by 2030. But now, despite these measures, the market share of electric cars in total sales of new cars is extremely small, although it increased in the first 4 months of 2021 from 0.1% to 0.2% (Daily Sabah, 2021).
In general, for both Ukraine and Turkey, a rapid increase in sales of electric vehicles should not be expected before the price is equal to the cost of new cars with internal combustion engines, or the state will compensate for this difference, through tax breaks or other incentives. The case of Ukraine is rather disputable.
8. The results of calculations
The results of the calculations will be presented in the form of Table 1 (efficiency of solar and wind energy in Ukraine) and Table 2 (efficiency of solar and wind energy in Turkey). There is currently no offshore wind energy in Ukraine or Turkey. The comparison was made based on data from 2016 to 2020 for more objectivity and following the current trends in changing the efficiency of solar and wind energy in both countries. Until 2016, the amount of installed capacity was insignificant and this led to the distortion of the results.
Table 1. The efficiency of the use of the installed capacity of solar and wind energy in Ukraine in 2016–2020 (calculations based on BP Statistical Review of World Energy, 2021)
|
Indicator |
Direction (technology) of energy |
2016 |
2017 |
2018 |
2019 |
2020 |
|
Ukraine |
||||||
|
Output data |
||||||
|
Electricity production, billion kWh |
Solar energy |
0.5 |
0.7 |
1.1 |
2.9 |
6.2 |
|
Wind energy |
1.0 |
1.0 |
1.2 |
2.0 |
3.2 |
|
|
Installed capacity, MW |
Solar energy |
955 |
1,200 |
2,003 |
5,936 |
7,331 |
|
Wind energy |
526 |
553 |
621 |
1,258 |
1,402 |
|
|
New installed capacity, MW |
Solar energy |
114 |
245 |
803 |
3,933 |
1,395 |
|
Wind energy |
12 |
27 |
68 |
637 |
144 |
|
|
The efficiency of use of the installed capacity |
||||||
|
Efficiency, |
Solar energy |
546.6 |
669.9 |
691.6 |
738.9 |
932.5 |
|
Wind energy |
1,834.4 |
1,822.8 |
2,024.9 |
2,150.8 |
2,385.1 |
|
|
Efficiency, % |
Solar energy |
6.2 |
7.6 |
7.9 |
8.4 |
10.6 |
|
Wind energy |
20.9 |
20.8 |
23.1 |
24.6 |
27.2 |
|
In the solar energy of Ukraine, during the period from 2016 to 2020 there is a steady trend to increase the efficiency of installed capacity from 546.6 kWh / kW (6.2%) in 2016 to 932.5 kWh / kW (10.6%) in 2020. However, only in 2020, the calculated indicator exceeds the lower limit of 10.0%, which is considered appropriate according to the REN21 report for solar energy (10.0–25.0%). In the wind energy of Ukraine, during the calculation period there is also a tendency to a gradual increase, except in 2017, when the lowest value was recorded – 1,822.8 kWh / kW (20.8%). The highest value of this indicator was in 2020 – 2,385.1 kWh / kW (27.2%). As in solar energy, only the indicator of 2020 – 2,385.1 kWh / kW (27.2%) is in the normal range according to the REN21 report for land-based wind energy (25.0–40.0%).
Table 2. The efficiency of the use of the installed capacity of solar and wind energy in Turkey in 2016–2020 (calculations based on BP Statistical Review of World Energy, 2021)
|
Indicator |
Direction (technology) of energy |
2016 |
2017 |
2018 |
2019 |
2020 |
|
Turkey |
||||||
|
Output data |
||||||
|
Electricity production, billion kWh |
Solar energy |
1.0 |
2.9 |
7.8 |
9.2 |
10.8 |
|
Wind energy |
15.5 |
17.9 |
19.9 |
21.7 |
24.8 |
|
|
Installed capacity, MW |
Solar energy |
833 |
3,421 |
5,063 |
5,995 |
6,667 |
|
Wind energy |
5,751 |
6,516 |
7,005 |
7,591 |
8,832 |
|
|
New installed capacity, MW |
Solar energy |
584 |
2,588 |
1,642 |
932 |
672 |
|
Wind energy |
1,248 |
765 |
489 |
586 |
1,241 |
|
|
The efficiency of use of the installed capacity |
||||||
|
Efficiency, |
Solar energy |
1,928.1 |
1,358.4 |
1,838.7 |
1,673.0 |
1,711.4 |
|
Wind energy |
3,026.5 |
2,919.0 |
2,950.7 |
2,977.5 |
3,015.5 |
|
|
Efficiency, % |
Solar energy |
22.0 |
15.5 |
21.0 |
19.1 |
19.5 |
|
Wind energy |
34.5 |
33.3 |
33.7 |
34.0 |
34.4 |
|
In the solar energy of Turkey, during the period from 2016 to 2020, the lowest value of the calculated indicator was in 2017 – 1,358.4 kWh / kW (15.5%), and the highest in 2016 – 1,928.1 kWh / kW (22.0%). The indicator in 2020 was 1,711.4 kWh / kW (19.5%). Throughout the period, the calculated indicators of solar energy efficiency in Turkey were within the limits according to the REN21 report for solar energy (10.0–25.0%) and exceeded the corresponding indicators of Ukraine. In the wind energy of Turkey, as well as in solar energy, the lowest value of the calculated indicator was in 2017 – 2,919.0 kWh / kW (33.3%), and the highest in 2016 – 3,026.5 kWh / kW (34.5%). The indicator in 2020 was 3,015.5 kWh / kW (34.4%). As in the case of solar energy, during the whole period, the calculated indicators of wind energy efficiency in Turkey were within the limits according to the REN21 report for land-shored wind energy (25.0–40.0%) and exceeded the corresponding indicators of Ukraine.
The excess of solar energy efficiency in Turkey over the corresponding indicators in Ukraine, in the vast majority, is caused by the higher intensity of solar radiation in this country. In Ukraine, the intensity of solar radiation is in the range of 900–1,400 kWh / m2, and in Turkey – 1,100–1,900 kWh / m2 (Research Gate, 2006).
The excess of the relevant indicators in the work of wind energy in Turkey over the indicators of Ukraine has many other reasons. The natural factor also takes place. Turkey has a much longer coastline (access to the coast). A mountainous country contributes to stronger wind flows. Other components of this advantage are more experience, a better approach to the selection of sites for wind turbines and the choice of the equipment itself.
According to the received calculations, due to the commissioning of the capacity of 1,000 MW, Ukraine can generate electricity in solar energy in the range of 546.6–932.5 million kWh, and in the wind energy in the range of 1,822.8–2,385.1 million kWh. For Turkey, the corresponding indicators will be: for solar energy – 1,358.4–1,928.1 million kWh, for wind energy – 2,919.0–3,026.5 million kWh.
Next, we will determine what amount of capacity should be embedded in the solar or wind energy of Ukraine and Turkey. Analyzing data, we can make recommendations for substituting the electricity generated individually by oil, gas, coal and total indicators. We will make calculations in the form of Table 3 (volumes of required capacities in Ukraine) and Table 6 (volumes of required capacities in Turkey).
The minimum and maximum values of electricity production were taken for the period from 2016 to 2020 for individual energy sources (oil, gas, coal). The total indicator was taken not as the sum of minimum or maximum values, but as the largest and, accordingly, the smallest volume of electricity production for a calendar year, during the specified period in the thermal energy of Ukraine and Turkey.
Analyzing the obtained results, it should be noted that to implement such a replacement (complete replacement of thermal energy) with the minimum efficiency of only solar energy would be quite difficult. However, the maximum efficiency of solar energy in Ukraine requires the introduction of a capacity of 59,839.1 MW at minimum production volumes in 2020 and 77,962.5 MW with maximum production volumes in 2016. In Turkey, the corresponding values will be at the level of 88,429 MW with minimum production volumes in 2019 and 108,500.6 MW with the maximum production volumes that were in 2017. According to the results of 2020, Germany had the largest amount of installed capacity in solar energy among European countries – 53,781.0 MW. However, the territory of Germany is 357.0 thousand km2, and the territory of Ukraine – 603.5 thousand km2 (43.1 thousand km2 or 7.1% of the territory is occupied), Turkey – 783.6 thousand km2 (Research Gate, 2006). Therefore, such substitutions can be implemented taking into account only the geographical component (available areas).
Table 3. Replacement of thermal energy capacity due to solar or wind energy in Ukraine according to the data of 2016–2020 (calculations based on BP Statistical Review of World Energy, 2021)
|
Direction (technology) of energy |
Indicator value |
Volumes of electricity production at capacities of 1,000 MW |
Minimum and maximum volumes of electricity production due to the corresponding energy source for the period 2016–2020, billion kWh |
|||||||
|
Oil |
Gas |
Coal |
Total |
|||||||
|
min |
max |
min |
max |
min |
max |
min |
max |
|||
|
0.7 |
1.6 |
7.4 |
13.9 |
41.2 |
61.2 |
55.8 |
72.7 |
|||
|
Volumes of required capacities in solar or wind energy to replace the corresponding capacities in thermal energy, MW |
||||||||||
|
Solar |
Min |
546.6 |
1,280.6 |
2,927.2 |
13,538.2 |
25,429.9 |
75,375.0 |
111,964.9 |
102,085.6 |
133,004.0 |
|
Max |
932.5 |
750.8 |
1,715.8 |
7,935.7 |
14,906.2 |
44,182.3 |
65,630.0 |
59,839.1 |
77,962.5 |
|
|
Wind |
Min |
1,822.8 |
384.0 |
877.8 |
4,059.7 |
7,625.6 |
22,602.6 |
33,574.7 |
30,612.2 |
39,883.7 |
|
Max |
2,385.1 |
293.5 |
670.8 |
3,102.6 |
5,827.8 |
17,273.9 |
25,659.3 |
23,395.2 |
30,480.9 |
|
It will be even easier to do this by using only wind energy. In Ukraine, it is necessary to introduce for complete replacement the production of electricity in thermal energy: at minimum efficiency – 30,612.2 MW and 39,883.7 MW; at maximum efficiency – 23,295.2 MW and 30,480.9 MW. For Turkey, the relevant indicators will be: at minimum efficiency – 58,440.4 MW and 71,668.4 MW; at maximum efficiency – 56,335.7 MW and 69,122.7 MW. According to the results of 2020, Germany which was already mentioned has the largest amount of installed capacity in wind energy among European countries – 62,184.0 MW . This significantly exceeds the required amount of capacity for Ukraine, with maximum efficiency of wind energy – more than twice.
Different types of technologies must be combined for more efficient operation of energy, using elements of Industry 4.0 such as Cloud technology, artificial intelligence, blockchain. This is because wind energy can produce more electricity per unit of installed capacity in winter than in summer, due to stronger wind currents during this period, and solar energy, on the other hand, can produce more electricity in summer due to higher solar radiation than in winter. In addition, for a more stable operation of the power system, wind and solar power plants should be equipped with battery capacity. Hydro-storage stations may be the best batteries, but they require height differences and two reservoirs between which water will move. Other types of batteries can be electrochemical systems (electric batteries), compressed air, flywheels, supercapacitors. Electric batteries are now becoming more common.
A lucrative area of cooperation in the development of renewable energy in Ukraine and Turkey may be the development of wind potential in the Black Sea. The technically achievable potential of offshore wind energy in the Black Sea is estimated at 435 GW, 70 GW of which can be built in Turkish seawater, and 251 GW in Ukraine. In total, Ukraine’s wind potential is estimated at 320 GW land-based capacity (IRENA) and 146 GW of offshore capacity (National Renewable Energy Laboratory (NREL)), in total – 466 GW. According to the estimates of the domestic Institute of Renewable Energy of the National Academy of Sciences of Ukraine there is 438 GW of land-based capacity, 250 GW of the offshore capacity, in total – 688 GW. The full realization of this potential can provide electricity generation in the following volumes: land-based IRENA – 858 billion kWh, offshore NREL – 570 billion kWh, total – 1,428 billion kWh. According to the Institute of Renewable Energy of the National Academy of Sciences of Ukraine, land-based – 1,190 billion kWh, offshore – 984 billion kWh, total – 2,174 billion kWh (Ukrainian Wind Energy Association, 2021; Knysh. & Kudrya, 2021).
Table 4. Replacement of thermal energy capacity due to solar or wind energy in Turkey according to the data of 2016–2020 (calculations based on BP Statistical Review of World Energy, 2021)
|
Direction (technology) of energy |
Indicator value |
Volumes of electricity production at capacities of 1,000 MW |
Minimum and maximum volumes of electricity production due to the corresponding energy source for the period 2016–2020, billion kWh |
|||||||
|
Oil |
Gas |
Coal |
Total |
|||||||
|
min |
max |
min |
max |
min |
max |
min |
max |
|||
|
0.1 |
1.9 |
57.3 |
110.5 |
92.3 |
113.2 |
170.5 |
209.2 |
|||
|
Volumes of required capacities in solar or wind energy to replace the corresponding capacities in thermal energy, MW |
||||||||||
|
Solar |
min |
1,358.4 |
73.6 |
1,398.7 |
42,182.0 |
81,345.7 |
67,947.6 |
83,333.3 |
125,515.3 |
154,004.7 |
|
max |
1,928.1 |
51.9 |
985.4 |
29,718.4 |
57,310.3 |
47,871.0 |
58,710.6 |
88,429.0 |
108,500.6 |
|
|
Wind |
min |
2,919.0 |
34.3 |
650.9 |
19,630.0 |
37,855.4 |
31,620.4 |
38,780.4 |
58,410.4 |
71,668.4 |
|
max |
3,026.5 |
33.0 |
627.8 |
18,932.8 |
36,510.8 |
30,497.3 |
37,402.9 |
56,335.7 |
69,122.7 |
|
9. Conclusions
Ukraine and Turkey have significant experience of mutually beneficial cooperation in various fields, including trade, investment, transport infrastructure, defense, energy and, in particular, Industry 4.0. In the last few years, Ukraine has begun to pay much more attention to cooperation for improving defense capabilities and energy security. An example of this is the use of a high-tech Bayrakhtar drone, which is a product of Industry 4.0.
Based on statistical reports from the international organization REN21 and the British oil company BP, the structure and features of the energy system in both countries were analyzed. A significant difference is a trend in the overall consumption of energy resources. A gradual reduction of this consumption is noticeable in Ukraine (from 2010 to 2020, the reduction in energy consumption was 26.4%). On the contrary, there is a gradual increase in energy consumption resources in Turkey (from 2010 to 2020, the growth of energy consumption was 39.8%), which is due to opposite trends in economic development and the corresponding changes in population. But the level of energy consumption per capita in both countries is at the same level (Ukraine – 77.7 Gigacalories / person, Turkey – 74.6 Gigacalories / person) and the basis of energy in both countries are traditional energy resources (oil, gas, coal). In Ukraine, the share of certain types of traditional energy resources is: gas – 31.9%, coal – 29.7%, oil – 13.6%; and in Turkey the share of certain types of energy is: oil – 29.0%, gas – 26.5%, coal – 26.4%.
Some common interdependent problems in the energy sector of Ukraine and Turkey have been identified. The possible ways to overcome them have been suggested. Among the main problems are the dependence of both countries on imports of traditional energy resources, a narrow range of suppliers of these energy resources, inefficient use of its transit potential, the predominance of traditional energy resources in energy consumption, equipment deterioration in thermal energy, especially in Ukraine. To overcome these problems, it is advisable to increase the possibilities of transporting traditional energy resources through its territory, to develop production in renewable energy, and to develop more actively the resources of the Black Sea.
An analysis of the situation related to the development of electric transport in both countries showed that Ukraine is making only the first attempts in the form of relevant legislation to stimulate the development of the electric vehicle market. Turkey already has its state program for the development of electric transport, in which was invested 3,7 billion dollars, the construction of a plant for the production of electric vehicles is almost completed, prototypes of cars have been developed; the production of the first one should start at the plant in 2022. Nevertheless, according to the analysis of the European Automobile Manufacturers Association, for the dynamic development of electric vehicles, a new electric car should be affordable for people, or the prices of electric cars should be equal to the prices of cars with internal combustion engines. Currently, in both Ukraine and Turkey, the share of electric vehicles in total sales of new cars does not exceed 1.0%.
Based on statistical information from the analytical report of the British oil company BP, the efficiency of solar and wind energy in Ukraine is calculated (solar energy from 546.6 kWh / kW (6.2%) to 932.5 kWh / kW (10.6%), wind energy from 1,822.8 kWh / kW (20.8%) to 2,385.1 kWh / kW (27.2%)), and the same for Turkey (solar energy from 1,358.4 kWh / kW (15.5%) to 1 928.1 kWh / kW (22.0%), wind energy from 2,919.0 kWh / kW (33.3%) to 3,026.5 kWh / kW (34.5%)). The obtained results proved the higher efficiency of solar and wind energy operation in Turkey. Turkey’s advantages in solar energy are mainly due to natural factors. The reasons for efficiency in wind energy are the available experience and the level of using the equipment. It is advisable to use elements of Industry 4.0 and blockchain in energy distribution. The obtained results are compared with the information published in the analytical report REN21.
Based on the obtained data, the possibility of replacing traditional energy resources (oil, gas, coal) separately and as a general indicator has been determined, considering the development of solar and wind energy. It is determined that wind energy for such replacement will require fewer new capacities. In Ukraine, to replace completely the production of electricity in thermal energy, it is necessary to introduce wind energy facilities with a total capacity of minimum efficiency – 30,612.2 MW and 39,883.7 MW; of maximum efficiency – 23,295.2 MW and 30,480.9 MW. For Turkey, the relevant indicators will be: at minimum efficiency – 58,440.4 MW and 71,668.4 MW; at maximum efficiency – 56,335.7 MW and 69,122.7 MW.
It is proposed to combine the capacities of solar and wind energy for more efficient operation of energy, as well as to consider the possibility of supplementing them with accumulating capacities. A lucrative area of cooperation between Ukraine and Turkey is the development of wind resources of the Black Sea, which is due to the significant wind potential of this region and the availability of specialists in this field in both countries.
In further research, it is advisable to dwell more thoroughly on the possibility of replacing energy based on coal as the most harmful energy source for the environment through the development of renewable energy and analyze the possibilities of collective production of relevant equipment in Ukraine and Turkey.
References
Autoconsulting. (2021). Which cars are available from official dealers in Ukraine, how much do they cost and can drive? Retrieved from https://www.autoconsulting.com.ua/article.php?sid=49306.
Autoconsulting. (2021). Why electric cars are poorly sold in Ukraine and the infrastructure of charging stations is not developed. Retrieved from https://www.autoconsulting.com.ua/article.php?sid=49229.
Automobile Manufacturers Association (ACEA). (2021). Electric cars: lower-income countries fall behind, with uptake linked to GDP per capita. Retrieved from https://www.acea.auto/press-release/electric-cars-lower-income-countries-fall-behind-with-uptake-linked-to-gdp-per-capita/.
Automotive Manufacturers Association (Turkey). (2021). Retrieved from http://www.osd.org.tr/osd-publications-/statistics/.
BP Statistical Review of World Energy 2021. (2021). Retrieved from http://www.bp.com/content/dam/bp/excel/Energy-Economics/statistical-review-2021/bp-statisticalreview-of-world-energy-2021-workbook.xlsx.
Daily Sabah. (2021). Electric, hybrid car sales in Turkey surge over 200% in 4 months. Retrieved from https://www.dailysabah.com/business/automotive/electric-hybrid-car-sales-in-turkey-surge-over-200-in-4-months.
Department of Economic and Social Affairs. Sustainable Development. United Nations. Retrieved from https://sdgs.un.org.
How to revive the transit potential of Ukraine? (2020). Retrieved from https://zn.ua/ukr/macrolevel/yak-reanimuvati-tranzitniy-potencial-ukrayini-327380_.html.
Ilyash O., Lupak R., Vasyltsiv T., Trofymenko O., & Dzhadan I. (2021). Modelling of the Dependencies of Industrial Development on Marketing Efficiency, Innovation and Technological Activity Indicators. Ekonomika, 100(1), 94-116. https://doi.org/10.15388/Ekon.2021.1.6
Ilyash, O., Trofymenko, O., Dzhadan, I., & Tsarova, T. (2021). Ecological and economic effects of industrial and Technological Development. IOP Conference Series: Earth and Environmental Science, 915(1), 012004. https://doi.org/10.1088/1755-1315/915/1/012004
International Organization of Motor Vehicle Manufacturers (OICA). (2020). Retrieved from https://www.oica.net/category/production-statistics/2020-statistics/.
Knysh, K. & Kudrya, S. (2021) White Paper 2021. Offshore wind energy and “green” hydrogen: opening new frontiers of Ukraine’s energy capacity. Kyiv, Institute of Renewable Energy of the National Academy of Sciences of Ukraine.
Ministry of Energy and Natural Resources of Turkey. (2020). 2019-2023 Strateji’k Plani. Retrieved from https://enerjiapi.etkb.gov.tr/Media/Dizin/SGB/Stratejik_Plan/2019-2023_Stratejik_Plan%C4%B1.pdf
Ministry of Energy of Ukraine (2017). Energy Strategy of Ukraine until 2035. Retrieved from http://mpe.kmu.gov.ua/minugol/control/uk/doccatalog/list?currDir=50358.
Ministry of Infrastructure of Ukraine. (2021) Notice of promulgation of the draft Law of Ukraine “On Amendments to the Law of Ukraine” On Some Issues of Importation into the Customs Territory of Ukraine and the First State Registration of Vehicles “. Retrieved from https://mtu.gov.ua/news/32935.html?fbclid=IwAR16MwGA4cYT6ql5qm3gcNCOKcKuCBTLYs1ZIrkmc0fqERagMrkp_cPUIGM.
Ministry of Infrastructure of Ukraine. (2021). Transit opportunities of Ukraine. Ukraine is a convenient transport hub between Europe and Asia. Retrieved from https://mtu.gov.ua/content/tmu.html.
National Institute for Strategic Studies. (2020). Restoration of transit potential in the context of increasing the competitiveness of Ukraine in the international market of transport services. Retrieved from http://old2.niss.gov.ua/articles/1844/.
OECD Environmental Performance Reviews: Turkey 2019. (2019). Retrieved from https://www.oecd-ilibrary.org/environment/oecd-environmental-performance-reviews-turkey-2019_9789264309753-en.
Official internet office of President of Ukraine (2021). Joint Declaration of the 9th meeting of the High-Level Strategic Council between Ukraine and the Republic of Turkey. Retrieved from https://www.president.gov.ua/news/spilna-deklaraciya-devyatogo-zasidannya-strategichnoyi-radi-67909
Plachkova, S. & Plachkov, I. (2005). Book 1. From fire and water to electricity - energy: history, present and future. Retrieved February 01, 2022, from http://energetika.in.ua/ua/books/book-1
Renewable capacity statistics 2021. IRENA Secretariat. International Renewable Energy Agency (IRENA). (2021). Abu Dhabi: IRENA Secretariat.
Renewable Energy and Jobs. Annual Review 2020. IRENA Secretariat. International Renewable Energy Agency (IRENA). (2020). Abu Dhabi: IRENA Secretariat.
Renewable Power Generation Costs in 2020. IRENA Secretariat. International Renewable Energy Agency (IRENA). (2021). Abu Dhabi: IRENA Secretariat.
Renewables 2021 Global Status Report. Renewable Energy Policy Network for the 21st Century (REN 21). (2021). Paris: REN21 Renewables Academy.
Research Gate. (2006). Photovoltaic Solar Electricity Potential in European Countries. Retrieved from https://www.researchgate.net/figure/Yearly-sum-of-global-irradiance-in-Europe-JRC-a-2006_fig2_275017905.
The official web portal of the Parliament of Ukraine. (2020). The Law “On Amendments to the Tax Code of Ukraine and Certain Legislative Acts of Ukraine Concerning Stimulation of Development of the Ecological Transport Sector in Ukraine” was adopted. Retrieved from https://www.rada.gov.ua/news/Povidomlennya/212507.html.
The World Fact Book. Central Intelligent Agency. Retrieved from https://www.cia.gov/the-world-factbook/.
TOGG. (2019). Turkey’s Automobile Made Its Debut! Retrieved from https://togg.com.tr/content/automobile.
Ukrainian Institute of the Future. (2019). Ukraine in 5 years - an energy independent country, in 10 years - an energy supplier to Europe. Retrieved from https://strategy.uifuture.org/ukraina-cherez-5-rokiv-energonezalezhna-kraina.html.
Ukrainian Renewable Energy Association. (2019). Production of electricity from renewable sources. Retrieved from http://uare.com.ua/images/stat2019UARE06ukr.pdf.
Ukrainian Wind Energy Association. (2021). International webinar “Offshore wind farms in the Black Sea: Ukraine and Turkey”. Retrieved from http://uwea.com.ua/ua/news/entry/mezhdunarodnyj-vebinar-offshornye-ves-v-chernom-more-ukraina-i-turciya/.
Ukravtoprom (2021) The Verkhovna Rada adopted Laws on Stimulating the Development of the Ecological Transport Sector in Ukraine. Retrieved from https://ukrautoprom.com.ua/verhovna-rada-pryjnyala-zakony-shhodo-stymulyuvannya-rozvytku-galuzi-ekologichnogo-transportu-v-ukrayini.
Verkhovna Rada of Ukraine, (2021). The Law “On Amendments to the Customs Code of Ukraine to Stimulate the Development of the Ecological Transport Sector in Ukraine” was adopted. Retrieved from https://iportal.rada.gov.ua/news/Povidomlennya/212508.html.
Voitko, S., Trofymenko, O., & Moghaddamı, S. (2021). Analysis of the factors that ensure the possibility of developing economic relations in the field of renewable energy between Ukraine and Turkey. Journal of Economy Culture and Society, 63, pp. 127-147.
Who Killed the Electric Car? (2006). Retrieved February 01, 2022, from http://www.whokilledtheelectriccar.com/