Ekonomika ISSN 1392-1258 eISSN 2424-6166
2022, vol. 101(2), pp. 38–51 DOI: https://doi.org/10.15388/Ekon.2022.101.2.3
Do Gender and Age Matter in Employment – Sectoral Growth Relationship Over the Recession and Expansion
Mindaugas Butkus
Vilnius University Šiauliai Academy, Institute of Regional Development, Šiauliai, Lithuania
Email: mindaugas.butkus@sa.vu.lt
Laura Dargenytė-Kacilevičienė
Vilnius University Šiauliai Academy, Institute of Regional Development, Šiauliai, Lithuania
Email: aura.dargenyte-kacileviciene@sa.stud.vu.lt
Kristina Matuzevičiūtė
Vilnius University Šiauliai Academy, Institute of Regional Development, Šiauliai, Lithuania
Email: kristina.matuzeviciute-balciuniene@sa.vu.lt
Dovilė Ruplienė
Vilnius University Šiauliai Academy, Institute of Regional Development, Šiauliai, Lithuania
Email: dovile.rupliene@sa.vu.lt
Janina Šeputienė
Vilnius University Šiauliai Academy, Institute of Regional Development, Šiauliai, Lithuania
Email: janina.seputiene@sa.vu.lt
Abstract. This paper examines age- and gender-specific employment sensitivity to growth across different economic sectors. The study applies a nonlinear panel specification of Okun’s first-difference equation on EU-28 countries for 1995–2019 and uses OLS to estimate age-, gender-, and sector-specific employment intensities of growth. Our study examines the ability of growth in different sectors to generate total employment opportunities. Results show that regardless of gender or age, employment growth is mainly driven by the services sector growth. Still, if we consider the share of a sector in the economy, the construction sector is found to be the most employment-intensive. Our estimates show that the male and female employment intensities of growth in services are quite equal. Considering the employment opportunities by gender, the main differences were found in the construction sector. Expansion and recession were confirmed to have a significantly different effect on the employment rate only in the construction sector regardless of age and gender. Contrary to findings in studies on the unemployment version of Okun’s law, we do not find significantly higher employment-output elasticity for youth compared to total employment.
Keywords: employment intensity; economic sectors; economic growth; youth employment; gender
__________
Received: 28/01/2022. Revised: 11/04/2022. Accepted: 30/06/2022
Copyright © 2022 Mindaugas Butkus, Laura Dargenytė-Kacilevičienė, Kristina Matuzevičiūtė, Dovilė Ruplienė, Janina Šeputienė. Published by Vilnius University Press. This is an Open Access article distributed under the terms of the Creative Commons Attribution License, which permits unrestricted use, distribution, and reproduction in any medium, provided the original author and source are credited.
Acknowledgements: This work was supported by the project “Jobless growth: interaction between demographic, sectoral, and institutional aspects” (acronym “INTERA”) financed by the Research Council of Lithuania, Contract No. S-MIP-22-18. We would like to thank the editor and the reviewers for their valuable comments, which helped us improve the present article.
Introduction
High employment (low unemployment) level is one of the fundamental concerns of macroeconomic policy. The Great Recession showed varied effects on employment and unemployment across countries worldwide and prompted numerous studies on employment (unemployment) elasticity of output. The Coronavirus crisis and its consequences on the labour market have further increased the relevance of this topic.
The literature analysing the impact of economic growth on employment confirms the different responsiveness of employment to output growth across countries, groups of countries and over time (Burggraeve, 2015; El-Hamadi et al., 2017; Ben-Salha & Zmami, 2021). The main findings implicate the higher employment–output elasticity in more developed regions compared with less developed and increasing (Adegboye et al., 2019) or decreasing (Ghazali & Mouelhi, 2018) employment sensitivity to output growth over time. Part of the literature concentrates on employment intensity of growth at the sectoral level: sectoral employment intensity of sectoral value-added (Guisan & Exposito, 2017; Thuku et al., 2019; Zaki et al., 2020), sectoral employment intensity of overall economic growth (Ghazali & Mouelhi, 2018; Gelfer, 2020), and total employment intensity of sectoral value added (Arias-Vazquez et al., 2012; Ben-Salha & Zmami, 2021). Regardless of the analysis type, in the majority of the research, the service sector was found as the most job-intensive. Research scarcely discusses the age- and gender-specific employment sensitivity to economic growth across different economic sectors. The previous findings of Anderson & Braunstein (2013), and Anderson (2016) indicate the higher female employment sensitivity to output growth and the studies of Kapsos (2005), and Adegboye et al. (2019) – the lower employment–output elasticity for youth.
Our research aims to estimate age- and gender-specific employment intensities of sectoral output growth and provides several contributions to the literature. First, we investigate employment rate sensitivity to sectoral output growth. This strand of research mainly investigates sectoral employment elasticities of total GDP growth or value-added in particular sectors. In line with Arias-Vazquez et al. (2012), Ben-Salha & Zmami (2021), our study examines the ability of growth in different sectors to generate total employment opportunities. In addition, complementing scarce empirical evidence on age- and gender-specific employment intensities of total output growth (Kapsos, 2005; Anderson & Braunstein, 2013; Anderson, 2016; Adegboye et al., 2019), we investigate the impact of sectoral growth on male, female, and youth employment rates. O’Reilly et al.’s (2019) cross-country comparison shows that youth employment is very sector-specific. The highest concentration of youth among total employment was observed in four sectors (accommodation and food, wholesale and retail, construction, and manufacturing), and these results allow us to expect varying youth employment–output elasticities across sectors.
Our research examines age- and gender-specific employment sensitivity to the economic growth in the EU-28 countries. Despite some differences in their economic development, these countries are united by a common market and free movement of labour; therefore, general trends in the response of these countries’ labour markets to economic growth are alike. EU countries have significantly lower employment rates than other developed Western economies, such as the United States, Canada, Australia and Japan, and have had a stronger response to the recession of 2008–2009. It is also worth noting that the EU is characterised by stricter labour market regulation, leading to heterogeneous employment elasticity of different labour force groups to economic fluctuations.
Our results suggest that regardless of gender or age, employment growth is mainly driven by the expansion of the services sector. However, if we consider sector share in total value-added, the output growth in the construction sector is found to be the most employment-intensive. Regardless of age and gender, only the construction sector’s expansion and recession were confirmed to have a significantly different effect on the employment rate. Results also show that male and female employment intensities of growth in services are quite equal. Considering male and female employment intensity of growth, the main differences were found in the construction sector, which has twice larger effect on males’ than females’ employment rate. At the same time, we do not find significantly higher employment–output elasticity for youth.
The rest of the paper is organised as follows: Section 2 provides a theoretical background of why employment responsiveness to growth might be age-, gender- or sector-specific, Section 3 presents the developed specification of the model, estimations strategy, and data, Section 4 discusses the main estimation results, and finally, in Section 5, we conclude presenting policy implications.
Literature review
Employment intensity of growth at the sectoral level: theoretical background
There is a close relationship between changes in output, employment and unemployment. The output variations influence firms’ decision to hire or lay off workers, changing employment and, in turn, unemployment. The literature estimating the output elasticity of employment or the employment intensity of growth derives from Okun’s Law (Ghazali & Mouelhi, 2018). In the seminal paper Okun (1962) has estimated that a 1 per cent increase in US gross national product lowers the unemployment rate by 0.3 percentage points. This relationship is known as Okun’s law, and the output elasticity of the unemployment rate refers to Okun’s coefficient.
Various approaches are applied to study the output–employment relationship at the sectoral level: sectoral employment intensity of sectoral value-added, sectoral employment intensity of overall economic growth, and total employment intensity of sectoral value-added. Studies on how sectoral employment responds to sectoral value-added (Hartwig, 2014; Burggraeve et al., 2015; Sassi & Goaied, 2016; Guisan and Exposito, 2017; Thuku et al., 2019; Zaki et al., 2020; Dauda et al., 2021). Hartwig (2014) for Switzerland and Burggraeve et al. (2015) for Belgium found that the highest elasticity of employment to output is in market service and the lowest is in construction and nonmarket service sectors. No statistical evidence of the ability to generate jobs was found for the agriculture sector. Sassi and Goaied’s (2016) empirical estimations based on panel data of 15 Tunisian industries indicate the highest responsiveness of employment to sectoral output growth in the service sector and some export-oriented manufacturing industries. Authors find a very weak ability of the agriculture sector to generate employment. Estimations of Guisan and Exposito (2017), who examined the employment–output elasticities for five European Union countries, confirm the findings of Burggraeve et al. (2015), Sassi and Goaied (2016), Thuku et al. (2019), etc. about the highest responsiveness of employment to sectoral output growth in the service sector and the lowest in agriculture. Thuku et al. (2019) examine the employment elasticities for six sectors in Kenya. They find the lowest elasticity for agriculture and the highest for the information and communication sector. Zaki et al. (2020) estimated the employment intensity of growth for ten sectors in Egypt and Jordan. Empirical estimations indicate the difference between analysed countries. The most job-intensive economic sector in Egypt is manufacturing. However, in Jordan, the highest responsiveness of employment to sectoral output growth was found for services. Dauda et al. (2021) examined employment–output elasticities in agriculture, industry and service sectors. They found negative employment–output elasticities in agriculture and industry sectors and the positive impact of service sector growth on employment, indicating the low ability of agriculture and industry sectors to generate jobs in Nigeria.
Other studies investigate how overall economic growth generates employment opportunities in specific sectors. Upender (2011) find that the output elasticity of employment in the Indian economy varies across different industries. The point estimates for the same industry vary between private and public organised sectors. Richter and Witkowski (2014), using various panels of advanced and developing economies, find higher industrial employment intensity of growth compared to service sector employment. The impact of GDP growth is insignificant on agricultural employment. Gelfer (2020) uses the employment version of Okun’s law applying a couple of estimation techniques to data for the US. Estimations show the highest impact of GDP growth on employment growth in the manufacturing and construction sectors. Some studies compare how sectoral employment responds to value-added in the corresponding sector and to overall economic growth. In a sample of 139 economies, Kapsos (2005) found that the elasticity of services employment both to total GDP and to value-added created in this sector was nearly three times larger than the corresponding figures for agriculture and industry. It implies that the service sector generates employment at a considerably faster rate than other sectors. The same conclusion holds for Tunisian sectors (Ghazali and Mouelhi, 2018). Estimated employment elasticities of both sectoral value-added and total GDP vary considerably across sectors and across the same sector over time. Results suggest that growth in the nonmanufacturing sector is more job-intensive compared to the manufacturing sector. The lowest association between employment and both sectoral and total output growth is observed for the agriculture and fishing sectors. In contrast with the findings of Ghazali and Mouelhi (2018), Aigheyisi and Edore (2021) found the weak responsiveness of service sector employment to economic growth in Nigeria during the period from 1991 to 2020.
We find very limited empirical evidence on total employment responsiveness to sectoral output growth. Arias-Vazquez et al. (2012), with a large panel of data, estimated the insignificant impact of growth in all 6 sectors on changes in total employment to population ratio except for the mining and utility sector, whose growth, as well as high-productivity sectors growth, is associated with decreasing employment. Ben-Salha and Zmami (2021) also estimated the service sector growth impact on changes in total employment in the GCC. Results confirm the ability of service sector growth to create jobs in the long run. Different results were found by Dahal and Rai (2019), who estimated employment elasticities in the main economic sectors of Nepal (agriculture, manufacturing, and services). The highest employment responsiveness to sectoral output growth during the analysed period was indicated in the manufacturing sector and the lowest in services.
Age- and gender-specific employment sensitivity to economic growth
The research on age- and gender-specific employment intensities of growth are relatively scarce. Kapsos (2005), with panel data for 160 economies, estimated higher female employment elasticities than male in each of the three periods, i.e., 1991–1995, 1995–1999, 1999–2003. But the opposite results were found for Japan. The estimates in the global sample show a significantly lower employment elasticity for young people (15–24 years) compared to the overall employment elasticity. Economic growth in North America has made quite a similar positive impact on both total and youth employment. In contrast, elasticities of youth employment in Western Europe were negative in each of the three analysed periods.
Anderson and Braunstein’s (2013) estimations of gender-specific employment elasticities in different groups of countries showed that gender-specific employment intensity of growth differs across countries and time. Estimated female employment elasticities for the global sample and the OECD group in all analysed periods (except for 2007–2010) were higher than estimated male employment elasticities. However, the last ones showed more stability over time. Different results were found estimating the impact of economic growth on gender-specific employment in non-OECD countries. The main findings did not show significant differences between female and male employment elasticities. Estimations of sectoral gender-specific employment elasticities indicate higher female than male employment responsiveness to service sector growth than in agriculture.
Anderson’s (2016) estimations in a panel of 80 countries showed higher women’s employment intensity of growth than men’s. The estimated intensities were regressed on a set of control variables, including women/men employment in the services and manufacturing sectors as a share of women/men in total employment. Higher shares in service and industrial sector employment have a positive impact on the employment intensity of both genders. Surprisingly, the point estimate for the industry was consistently higher than for services.
Adegboye et al. (2019), based on panel data of 38 Sub-Sacharian countries, estimated employment–output elasticities of different demographic groups (total, male/female, youth) over three periods 1991–1999, 2000–2009, 2010–2014. The highest employment–output elasticities were found during the expansion, i.e. 2010–2014. Estimated employment elasticities for both genders were similar to the overall employment intensity. However, female employment–output elasticity was a little bit lower than the estimated average employment elasticity. Moreover, the employment–output elasticities of young people were lower than total, male and female employment–output elasticities in almost all of the analysed periods. The share of industry and services compared to agriculture has a significant negative impact on employment-output elasticity for all groups.
The previous research presents various arguments on how age can affect unemployment (Butkus and Seputiene, 2019; Ahn et al., 2019; Butkus et al., 2020) or employment (Kapsos, 2005; Pattanaik and Nayak, 2014; Dixon et al., 2017; El-Hamadi et al. (2017), Adegboye et al., 2019) elasticity of output and we can state that youth employment is more vulnerable during the period of recession. Consequently, when the growth rates are slowing down, companies tend to lay off young workers as they have a lower level of human capital and also lack the experience which is needed for a specific workplace.
Model and the data
Okun (1962) originally estimated the relationship between aggregate output growth and changes in the unemployment rate. The employment version of Okun’s Law (IMF, 2010) explores the growth–employment relationship. We generate estimates of the strength of this relationship using the differenced version of Okun’s Law for a panel of countries:
 (1)
(1)
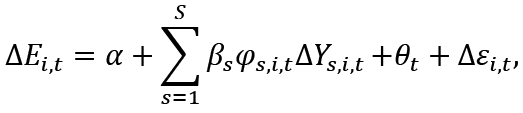
where ΔEi,t is the percentage point change of the employment rate between period t and t-1 in country i. ΔYi,t is the percentage change of the real output between t and t-1. The parameter β measures the elasticity of the employment rate with respect to output. α shows the employment change when the real output does not vary. θt represents unobserved time-varying effects, which are modelled using time dummies, and Δεi,t is the idiosyncratic error. Since Eq. (1) is a first-differenced equation of an unobserved effects model, the unobserved country-fixed effects do not appear in Eq. (1) because they have been “differenced away”.
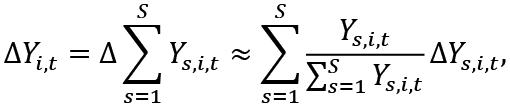
We aim to analyse how uneven growth in economic sectors is associated with changes in the employment rate by estimating a modified version of the employment version of Okun’s Law. To disaggregate output growth by sectors, we refer to the growth rate disaggregation method proposed by Anderton et al. (2014). We modified a technique that previously was used to disaggregate output growth by its expenditure components to disaggregate output growth by sectors:
 (2)
(2)
where s represents four economic sectors: agriculture (agr), industry (ind), construction (con) and service sector (ser), ΔYs,i,t is the gross value-added growth in sector s.
We re-specify Eq. (1) in terms of the various sectors of the economy, allowing for the parameter β to vary across sectors, by the following approximation:
 (3)
(3)
where βs represents the responsiveness of the employment rate to output growth in sector s. 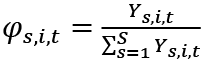 represents the share of sector s in the country’s economy. We assume φs,i,t as time-varying rather than constant share to ensure the accuracy of the approximation presented in Eq. (2). βsφs shows the elasticity of the employment rate with respect to output growth in each of the four sectors while βs shows estimates of the weighted β coefficients. The βsφs estimates are obtained by regressing employment change on output change in different sectors, i.e. ΔYs,i,t, while βs estimates are obtained by regressing on the weighted output change in different sectors, i.e. φs,i,tΔYs,i,t. Thus, we are able to isolate the distinct employment responsiveness (what we term as ‘employment intensity’), βs, for each sector rather than simply estimating the composite term, βsφs. However, βsφs is still interesting since it yields the distinct ‘component elasticities’ or the ‘proportional responsiveness’ of employment to change in each sectors’ output, i.e., the βsφs estimates show the change in the employment rate that is associated with a 1% increase in output of sector s.
The literature analysing the relationship between unemployment and output confirms a more robust unemployment reaction to recessions than expansions (Kim and Park, 2019; Aguiar-Conraria et al., 2020). Results showed asymmetric relationships between labour market variables and GDP within and between recession and expansion phases. Higher unemployment reaction to GDP changes was confirmed during the recession. Asymmetrical behaviour of unemployment and employment is related to labour market regulations, hiring, and firing costs, individual firms’ decisions to lay off workers during the recession but not to hire the new ones during expansion, expecting to compensate it by increased labour productivity (Butkus and Seputiene 2019; Pizzo 2020). It is worth noting that employment reaction to economic fluctuations depends on economic structure, demographic characteristics, and the business cycle.
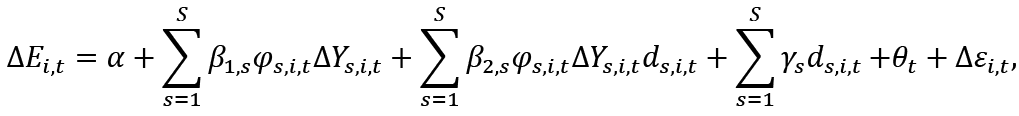
Although empirical research shows that unemployment is more sensitive to negative rather than positive output change (see Novák and Darmo 2019 for the review), such analysis is very limited in the case of employment. Burggraeve et al.’s (2015) research is one of the rare examples, and the results do not confirm any statistically significant deviations of employment–output elasticity over recession compared to nonrecession periods taking all crisis episodes together. Some significant differences are found for individual countries in separate recession periods and with different signs, except the last economic crisis indicating the lower employment–output elasticities over recession periods compared with nonrecession. In this study, we allow the β to vary not just across sectors but between expansion and recession phases as well:
 (4)
(4)
where ds,i,t is a binary dummy variable equal to 1 when output in sector s is decreasing, i.e. ΔYs,i,t<0, and 0 otherwise, β1,s represents the responsiveness of the employment rate to positive output growth (expansion) in sector s, whereas β1,s+β2,s represents the responsiveness of the employment rate to output decrease (recession) in sector s.
Equations were estimated by ordinary least-squares method, using Newey–West standard errors to reduce the probability that heteroscedasticity and serial correlation could lead to inefficient estimates with biased regular standard errors and misleading results.
The panel covers EU-28 countries for the period of 1995–2019. The data is collected from Eurostat. Table 1 shows summary statistics of variables.
Table 1. Summary statistics of the variables
|
Variable |
Mean |
SD. |
Min |
Max |
|
|
ET |
Total employment, %. |
64.3 |
6.5 |
46.9 |
78.2 |
|
EM |
Male employment, %. |
70.8 |
6.0 |
52.7 |
82.8 |
|
EF |
Female employment, %. |
57.8 |
9.0 |
31.8 |
75.9 |
|
EY |
Youth (15–24 years old) employment, %. |
35.0 |
12.8 |
11.8 |
70.4 |
|
ΔY |
Change in gross value added (all NACE Rev.2 activities) at constant (2010) prices, % |
2.6 |
3.4 |
-15.2 |
25.7 |
|
ΔYagr |
Change in gross value added (agriculture, forestry and fishing NACE Rev.2 activity A) at constant (2010) prices, % |
1.3 |
11.0 |
-45.9 |
54.6 |
|
ΔYind |
Change in gross value added (industry NACE Rev.2 activities B–E) at constant (2010) prices, % |
2.5 |
6.4 |
-20.9 |
80.9 |
|
ΔYcon |
Change in gross value added (construction NACE Rev.2 activity F) at constant (2010) prices, % |
2.2 |
10.0 |
-45.6 |
65.9 |
|
ΔYser |
Change in gross value added (services NACE Rev.2 activities G–U) at constant (2010) prices, % |
2.8 |
3.3 |
-27.9 |
18.2 |
Results and discussion
Table 2 represents the estimates based on Eq. (3). On the left side of the table, βsφs shows the change in the employment associated with a 1% increase in output in sector s. The results show that the output of the industry, construction and service sectors is significantly and positively related to changes in total employment. These results contradict Arias-Vazquez et al.’s (2012) results, who estimated the insignificant impact of growth in all six sectors on changes in total employment to population ratio except for the mining and utility sector.
Studies aiming to estimate sectoral employment elasticity of sectoral output growth mostly confirm the highest responsiveness in the service sector (Guisan and Exposito, 2017; Burggraeve et al., 2015; Sassi and Goaied, 2016; Thuku et al., 2019). In line with these results, we found that total employment is also most affected by the output change in the service sector. Its increase by 1% increases the total employment rate by 0.11 p. p. Our findings are in line with Ben-Salha and Zmami (2021), who confirmed the ability of service sector growth to create jobs. In the case of an individual country, it is possible that the service sector causes the lowest employment responsiveness to sectoral output growth, as obtained by Dahal and Rai (2019) evaluating the case of Nepal, but this may be related to the sector’s share in the economy. We believe that the most substantial positive impact of output growth in services in our case is related to the largest share of the service sector in the economy.
Table 2. Estimates of Eq. (3)
|
ΔETi,t |
ΔEMi,t |
ΔEFi,t |
ΔEYi,t |
φs |
ΔETi,t |
ΔEMi,t |
ΔEFi,t |
ΔEYi,t |
|
|
βsφs |
βs |
||||||||
|
α |
0.3667* |
0.2395 |
0.4783** |
-0.2531 |
0.3639* |
0.2748 |
0.4405** |
-0.2492 |
|
|
(0.2056) |
(0.2471) |
(0.2007) |
(0.3616) |
(0.2069) |
(0.2508) |
(0.1998) |
(0.3644) |
||
|
ΔYagr,i,t |
0.0070* |
0.0102** |
0.0040 |
0.0070 |
0.0278 |
0.0984 |
0.1145 |
0.0744 |
0.1255 |
|
(0.0038) |
(0.0046) |
(0.0037) |
(0.0067) |
(0.1153) |
(0.1397) |
(0.1113) |
(0.2031) |
||
|
ΔYind,i,t |
0.0198** |
0.0270*** |
0.0133* |
0.0283** |
0.2030 |
0.0614** |
0.0957*** |
0.0278 |
0.0867* |
|
(0.0078) |
(0.0093) |
(0.0076) |
(0.0136) |
(0.0285) |
(0.0345) |
(0.0275) |
(0.0501) |
||
|
ΔYcon,i,t |
0.0357*** |
0.0519*** |
0.0200*** |
0.0459*** |
0.0628 |
0.4574*** |
0.6877*** |
0.2348*** |
0.5558*** |
|
(0.0052) |
(0.0063) |
(0.0051) |
(0.0092) |
(0.0764) |
(0.0926) |
(0.0738) |
(0.1346) |
||
|
ΔYser,i,t |
0.1085*** |
0.1195*** |
0.0975*** |
0.0853** |
0.7060 |
0.1957*** |
0.2099*** |
0.1816*** |
0.1699*** |
|
(0.0191) |
(0.0230) |
(0.0187) |
(0.0336) |
(0.0268) |
(0.0325) |
(0.0259) |
(0.0473) |
||
|
n |
622 |
622 |
622 |
622 |
622 |
622 |
622 |
622 |
|
|
R2 |
0.4514 |
0.4853 |
0.3201 |
0.3143 |
0.4437 |
0.4690 |
0.3256 |
0.3028 |
|
*, ** and *** represent the 90%, 95% and 99% levels of significance, respectively.
The value in the brackets represents Newey–West standard error.
All estimates include time dummies
Comparing the impact of sectoral output on male and female employment, it can be seen that the output growth in the agriculture sector significantly increases only male employment. It is mainly due to a higher share of male labour than female labour in this sector. The industrial sector’s output has a twice more considerable effect on male than female employment, and its effect on female unemployment is less statistically significant. The construction sector’s output affects male employment much stronger than female employment since the construction sector usually employs more males than females. The output of the service sector has a similar impact on employment for both men and women. It is worth noting that the workers’ shares of men and women in the service sector are pretty identical. Our findings are in line with Anderson (2016), who estimated that a higher share in sector employment positively impacts employment intensity by gender. However, our results and Kapsos (2005) or Anderson and Braunstain (2013) do not confirm a tendency towards higher male or female employment elasticity.
Output changes in the agricultural sector do not have a significant impact on youth employment. It could be related to the fact that only a small share of the young labour force works in this sector. Kharaishvili et al. (2017) show that young people are less involved in agricultural activities due to low wages in this sector and lack of motivation to study in this area since it is not prestigious among young people. The βsφs estimates in industry and construction sectors are higher for youth employment compared to total employment. In service, it is slightly lower, but we found that the estimated difference between total and youth employment is insignificant, as the confidence intervals overlap.
The values of βsφs estimates depend on the share of the sector’s output in total gross value-added. The higher weight of the sector’s value-added is related to the more significant impact of that sector on the employment rate. In our research, services account, on average, for the largest share of value-added (71%). The average weight of industry is 20%, while agriculture and construction are 3% and 6%, respectively.
After accounting for the sector’s size, we found that output change in construction has the most significant impact on employment. It can be explained that this sector reacts strongly to output fluctuation. Thus, the unemployed can quickly enter this sector with minimal barriers. Besides, the construction sector is a labour-intensive industry with a higher demand for unskilled and skilled labour. This sector has a more than two times higher impact on overall employment than services and is more than seven times bigger than the industry sector. The change in construction output has a more significant impact on male than female employment. It can be explained by the fact that the construction sector is one of the most gender-segregated sectors where males constitute the most significant workers’ share. We found that the construction output change effect on youth employment is particularly substantial. The output change in manufacturing affects youth employment more strongly than total and female employment but less so than male employment. This could be related to the fact that this sector is labour intensive and attracts an unskilled young labour force who dropped out of school to enter the labour market. There are no significant differences between the impact of output change in services on total, male, female, and youth employment.
We also estimated (see Table 3) the impact of sectors’ output changes on employment separately for economic growth and downturn periods based on Eq. (4).
Our results confirm some differences comparing the periods of expansion with results for the general analysis. There is no significant impact of output changes in the industry on total, male and youth employment. The impact of output changes in the construction sector on total, female and youth employment also became insignificant. No significant differences are found in the service sector and in the agriculture sector of female and youth employment–output elasticities. The impact of the service sector’s output growth on female and youth employment comparing the recession period with the overall period became insignificant. The same conclusions can be made for the total, male and youth employment elasticities in the industry sector. In most of the cases, we do not find any significant differences comparing recession and expansion periods. Our results are partly consistent with Burggraeve et al. (2015), who found no significant differences in employment–output elasticities comparing recession periods with nonrecession.
Table 3. Estimates of Eq. (4)
|
ΔETi,t |
ΔEMi,t |
ΔEFi,t |
ΔEYi,t |
φs |
ΔETi,t |
ΔEMi,t |
ΔEFi,t |
ΔEYi,t |
|
|
Expansion (β1,sφs) |
Expansion (β1,sφs) |
||||||||
|
α |
0.6052*** |
0.5598** |
0.6505*** |
0.2288 |
0.6470*** |
0.6975*** |
0.5986*** |
0.2348 |
|
|
(0.2160) |
(0.2570) |
(0.2140) |
(0.3851) |
(0.2117) |
(0.2537) |
(0.2072) |
(0.3804) |
||
|
ΔYagr,i,t |
0.0018 |
0.0043 |
-0.0017 |
-0.0082 |
0.0278 |
-0.0851 |
-0.0252 |
-0.1797 |
-0.2073 |
|
(0.0062) |
(0.0074) |
(0.0062) |
(0.0111) |
(0.1511) |
(0.1811) |
(0.1479) |
(0.2716) |
||
|
ΔYind,i,t |
0.0088 |
0.0162 |
0.0017 |
0.0286* |
0.2030 |
0.0302 |
0.0625* |
-0.0026 |
0.0659 |
|
(0.0095) |
(0.0113) |
(0.0094) |
(0.0170) |
(0.0305) |
(0.0366) |
(0.0300) |
(0.0549) |
||
|
ΔYcon,i,t |
0.0125 |
0.0217** |
0.0036 |
0.0011 |
0.0628 |
0.1654 |
0.2872** |
0.0502 |
0.0685 |
|
(0.0083) |
(0.0098) |
(0.0082) |
(0.0147) |
(0.1057) |
(0.1266) |
(0.1034) |
(0.1899) |
||
|
ΔYser,i,t |
0.1018*** |
0.1028*** |
0.1000*** |
0.0813** |
0.7060 |
0.1663*** |
0.1459*** |
0.1849*** |
0.1271** |
|
(0.0225) |
(0.0268) |
(0.0223) |
(0.0402) |
(0.0317) |
(0.0380) |
(0.0310) |
(0.0570) |
||
|
β2,sφs |
β2,s |
||||||||
|
ΔYagr,i,t |
0.0166 |
0.0214* |
0.0145 |
0.0253 |
0.0278 |
0.5429* |
0.2503 |
0.8990*** |
0.6263 |
|
(0.0106) |
(0.0126) |
(0.0105) |
(0.0189) |
(0.3168) |
(0.3798) |
(0.3101) |
(0.5694) |
||
|
ΔYind,i,t |
0.0264 |
0.0097 |
0.0438* |
-0.0045 |
0.2030 |
0.1082 |
0.0272 |
0.1913* |
0.1015 |
|
(0.0231) |
(0.0275) |
(0.0229) |
(0.0412) |
(0.1153) |
(0.1383) |
(0.1129) |
(0.2073) |
||
|
ΔYcon,i,t |
0.0523*** |
0.0666*** |
0.0380*** |
0.0801*** |
0.0628 |
0.8052*** |
1.042*** |
0.5687*** |
0.9221** |
|
(0.0138) |
(0.0164) |
(0.0136) |
(0.0245) |
(0.2159) |
(0.2587) |
(0.2113) |
(0.3879) |
||
|
ΔYser,i,t |
0.0389 |
0.1258* |
-0.0326 |
-0.0222 |
0.7060 |
0.1272 |
0.3017*** |
-0.0274 |
0.0898 |
|
(0.0634) |
(0.0755) |
(0.0628) |
(0.1131) |
(0.0860) |
(0.1031) |
(0.0842) |
(0.1546) |
||
|
Recession (β1,sφs+β2,sφs) |
Recession (β1,sφs+β2,sφs) |
||||||||
|
ΔYagr,i,t |
0.0184** |
0.0257** |
0.0128 |
0.0171 |
0.0278 |
0.4578* |
0.2251 |
0.7194*** |
0.4190 |
|
(0.0085) |
(0.0101) |
(0.0084) |
(0.0151) |
(0.2743) |
(0.3288) |
(0.2685) |
(0.4930) |
||
|
ΔYind,i,t |
0.0351* |
0.0259 |
0.0455** |
0.0241 |
0.2030 |
0.1384 |
0.0897 |
0.1886* |
0.1674 |
|
(0.0209) |
(0.0248) |
(0.0207) |
(0.0372) |
(0.1108) |
(0.1328) |
(0.1084) |
(0.1991) |
||
|
ΔYcon,i,t |
0.0649*** |
0.0883*** |
0.0416*** |
0.0812*** |
0.0628 |
0.9706*** |
1.3290*** |
0.6189*** |
0.9906*** |
|
(0.0109) |
(0.0130) |
(0.0108) |
(0.0194) |
(0.1837) |
(0.2202) |
(0.1798) |
(0.3301) |
||
|
ΔYser,i,t |
0.1407** |
0.2285*** |
0.0674 |
0.0591 |
0.7060 |
0.2934*** |
0.4476*** |
0.1576** |
0.2169 |
|
(0.0591) |
(0.0703) |
(0.0586) |
(0.1054) |
(0.0796) |
(0.0954) |
(0.0779) |
(0.1430) |
||
|
n |
622 |
622 |
622 |
622 |
622 |
622 |
622 |
622 |
|
|
R2 |
0.4879 |
0.5288 |
0.3463 |
0.3420 |
0.4895 |
0.5232 |
0.3639 |
0.3335 |
|
*, ** and *** represent the 90%, 95% and 99% levels of significance, respectively.
The value in brackets represents Newey–West standard error.
All estimates include time and business cycle dummies
During the periods of expansion, the construction sector significantly impacts only male employment. The service sector’s output significantly impacts total, male, and female employment, but no difference was found between male and female employment. The impact of output change on youth employment during the periods of expansion was determined only in services.
After eliminating the influence of the industry size, we found that changes in the agricultural and industrial output do not significantly affect employment. The output changes in construction significantly affect only male employment. Services are the only sector where output changes affect total, male, female, and youth employment, and it can be explained by high labour intensity in this industry, but no significant differences were found between male, female and youth groups.
During the recession periods, total employment is significantly affected by the output changes in the agriculture, construction and service sectors, but the impact on the latter is much larger. Estimate β1,sφs+β2,sφs shows that a 1% decrease of output in the service sector decreases employment by 0.14 p. p. Studies on gender-specific Okun’s coefficient suggest that higher male unemployment sensitivity to output changes can be related to the higher shares of males in sectors sensitive to business cycles, such as manufacturing and construction (Kim and Park 2019). Our results confirm that changes in the construction sector’s output during the downturn affect male employment almost twice as strong as female employment. Still, the impact is significantly lower than that of services, especially in the case of male employment.
Youth employment shows a sensitive reaction only to a decrease in the output of the construction sector. This could be explained by the fact that the construction sector is more sensitive to economic downturns compared to other sectors and young people are less in demand during the recession as they are usually less skilled and experienced compared with older workers.
After eliminating the influence of the size of the sector, we found that output decrease in the construction sector has the most significant impact on employment during the recession. Its decline decreases the total, male and female employment about three times more than the output decrease in the service sector. The output decrease in the construction sector has a twice bigger effect on the male employment decrease than on female employment but the estimated difference between males and females during recession periods is insignificant, as the confidence intervals (not presented here) overlap. During the recession, this sector has a significant impact on youth unemployment, but it is not higher than on male employment.
Conclusion
Our study examines how total as well as male, female and youth employment rate responds to the output growth in different sectors. The results suggest that regardless of gender or age, employment growth is mainly driven by the expansion of the services sector. However, if we consider sector share in total value-added, the output growth in the construction sector is found to be the most employment-intensive. By separating the sector’s expansion and recession periods, we can conclude that countries with lower services share in total value-added can face the problem of jobless growth, as positive output growth in other sectors mostly has a weak and insignificant effect on the employment rate.
We found that the output growth of the agricultural sector has an effect only on male employment, but if we consider the sector share in total value-added, this effect becomes insignificant. The output growth of the industrial sector has a significant impact on total, male and youth employment. Still, we did not find a significant difference in the impact on these groups. After eliminating the influence of the industry size, significant effects persisted only for total and male employment, and the results suggest that the impact on male employment is greater than for total employment. Comparing the response of employment to the growth of agricultural and industrial output during periods of expansion and recession, we found a significant difference only in the case of female employment and only in response to changes in agricultural output when the size of the sector is taken into account. Female employment does not react positively to product changes during the expansion period but declines significantly during the downturn, and this reaction is stronger than in other sectors.
Point estimates show that male and female employment intensities of growth in services are quite equal. The same conclusion holds for expansion periods, yet output decrease in services has a more significant effect for males. Considering male and female employment intensity of growth, the main differences were found in the construction sector, which has twice larger effect on males’ than females’ employment rate. During this sector’s expansion periods, we do not find a significant effect on the female employment rate.
Only the construction sector’s expansion and recession were confirmed to have a significantly different effect on the employment rate (regardless of age and gender). Some caution should be taken when estimating male employment intensities of output growth and decline in the services sector, as results depend on this sector’s share in total value-added.
Studies on unemployment elasticity of output (Okun’s coefficient) mostly conclude that youth unemployment responsiveness to economic growth is more than twice larger than that of total unemployment. Our results contradict this conclusion, as we do not find significantly higher employment–output elasticity for youth. This implies that Okun’s coefficient being higher for young than older people may be related to more intensive youth flow from inactive to unemployed than from employed to unemployed. These labour market flows are worth considering in future research on unemployment/employment elasticity of output. It is also worth noting that the distinction between periods of recession and expansion may not be sufficient to gain a more accurate estimate of how employment, as well as unemployment, responds to output changes, and it would be meaningful to consider varying elasticities during the same business cycle phase.
References
Adegboye, A. C., Egharevba, M. I., & Edafe, J. (2019). Economic regulation and employment intensity of output growth in sub-Saharan Africa. In Governance for structural transformation in Africa (pp. 101–143). Palgrave Macmillan, Cham.
Aguiar-Conraria, Luís, Manuel M. F. Martins, and Maria Joana Soares. (2020). Okun’s Law Across Time and Frequencies. Journal of Economic Dynamics and Control, Vol. 116, p. 1–15.
Ahn, M. J., An, Z., Bluedorn, M. J. C., Ciminelli, G., Kóczán, Z., Malacrino, M. D., Muhaj, D., & Neidlinger, P. (2019). Work in progress: Improving youth labor Market outcomes in emerging market and developing economies. IMF Staff Discussion Note 2019.
Aigheyisi, O., & Edore, J., O. (2021). Economic growth and employment in Nigeria’s services sector. Journal of Economics and Allied Research, Vol 6, issue 1, p. 92–102.
Anderton, R., Aranki, T., Bonthuis, B., & Jarvis, V. (2014). Disaggregating Okun’s law: decomposing the impact of the expenditure components of GDP on euro area unemployment. European Central Bank Working Paper Series , No 1747
Anderson, B. (2016). Do Macroeconomic Structures and Policies Shape the Employment Intensity of Growth Differently for Women and Men? Journal of Economic Issues, Vol. 50, issue 4, p. 940–962. http://dx.doi.org/10.1080/00213624.2016.1249744
Anderson, B., & Braunstein, E. (2013). Economic growth and employment from 1990-2010: explaining elasticities by gender. Review of Radical Political Economics, Vol. 45. issue 3, p. 269–277. http://dx.doi.org/10.1177/0486613413487158.
Arias-Vazquez, F. J., Lee, J., & Newhouse, D. L. (2012). The role of sectoral growth patterns in labor market development. World Bank Policy Research Working Paper, (6250). Available from internet: https://ssrn.com/abstract=2166683.
Ben-Salha, O., & Zmami, M. (2021). The Effect of Economic Growth on Employment in GCC Countries. Scientific Annals of Economics and Business, Vol. 68, issue 1, p. 25–41. https://doi.org/10.47743/saeb-2021-0004
Burggraeve, K., de Walque, G., & Zimmer, H. (2015). The relationship between economic growth and employment. Economic Review, issue (i), p. 32–52.
Butkus, M., Matuzeviciute, K., Rupliene, D., Seputiene, J. (2020). Does Unemployment Responsiveness to Output Change Depend on Age, Gender, Education, and the Phase of the Business Cycle? Economies, Vol. 8, issue 4. https://doi.org/10.3390/economies8040098.
Butkus, M., Seputiene, J. (2019). The Output Gap and Youth Unemployment: An Analysis Based on Okun’s Law. Economies, Vol. 7, issue 4. https://doi.org/10.3390/economies7040108
Dixon, R., Lim, G. C., & Van Ours, J. C. (2017). Revisiting the Okun relationship. Applied Economics, 49(28), 2749-2765. https://doi.org/10.1080/00036846.2016.1245846
Dahal, M., & Rai, H. (2019). Employment Intensity of Economic Growth: Evidence from Nepal. Economic Journal of Development Issues, Vol. 27 & 28, p. 34–47. https://doi.org/10.3126/ejdi.v28i1-2.33195.
Dauda, R. S., & Ajeigbe, O. M. (2021). Sectoral Analysis of Employment Intensity of Growth in Nigeria. Global Business & Economics Anthology, Vol. 1, p. 87–99. https://doi.org/10.47341/gbea.21037
El-Hamadi, Y., Abdouni, A., & Bouaouz, K. (2017). The sectoral employment intensity of growth in Morocco: A Pooled Mean Group approach. Applied Econometrics and International Development, Vol. 17, issue 2, p. 87–98.
Gelfer, S. (2020). Re-evaluating Okun’s Law: Why all recessions and recoveries are “different”. Economics Letters, Vol. 196, issue C, p. 1–6. https://doi.org/10.1016/j.econlet.2020.109497.
Ghazali, M & Mouelhi, R. (2018). The employment intensity of growth: evidence from Tunisia. Journal of Economic Development, Vol. 43, issue 3, p. 85–117. https://doi.org/10.35866/caujed.2018.43.3.004
Guisan, M.C., & Exposito, P. (2017). Employment By Sector, Productivity and Wages In 5 European Countries, 1965-2015: Fifty Years of Evolution In Germany, Spain, France, Italy And UK. Applied Econometrics and International Development, Vol. 17, issue 2, p. 33–46.
Hartwig, J. (2014). Testing Okun’s law with Swiss industry data. Applied Economics, Vol. 46, issue 29, p. 3581–3590. https://doi.org/10.1080/00036846.2014.934435
International Monetary Fund. (2010). Unemployment Dynamics in Recessions and Recoveries. World Economic Outlook, Chapter 3.
Kapsos, S. (2005). Employment intensity of growth: The trends and macroeconomic determinants. Employment Strategy Papers 2005/12. Available from internet: http://ilo.ch/wcmsp5/groups/public/---ed_emp/---emp_elm/documents/publication/wcms_143163.pdf
Kharaishvili, E., Chavleishvili, M., Lobzhanidze, M., Damenia, N., & Sagareishvili, N. (2017). Problems of youth employment in agricultural sector of Georgia and causes of migration. International Journal of Social, Behavioral, Educational, Economic, Business and Industrial Engineering, Vol. 11, issue 10, p. 2116–2121.
Kim, M. J., & Park, S. Y. (2019). Do gender and age impact the time-varying Okun’s law? Evidence from South Korea. Pacific Economic Review, Vol. 24, issue 5, p. 672–685. https://doi.org/10.1111/1468-0106.12288
Novák, M., & Darmo, L. (2019). Okun’s law over the business cycle: Does it change in the EU countries after the financial crisis? Prague Economic Papers, Vol. 28, p. 235–254. https://doi.org/10.18267/j.pep.694
Okun, A., M. (1962). Potential GNP: Its measurement and significance. In Proceedings of the Business and Economics Section. Washington, DC: American Statistical Association, pp. 98–104.
O’Reilly, J., Grotti, R., & Russell, H. (2019). Are some sectors more «youth friendly» than others? Employment regimes, sectors, and gender disparities in the Great Recession. Human Resource Management Journal, Vol. 29, issue 3, p. 490–508. https://doi.org/10.1111/1748-8583.12242
Pattanaik, F., & Nayak, N. C. (2014). Macroeconomic determinants of employment intensity of growth in India. Margin: The Journal of Applied Economic Research, 8(2), 137-154. https://doi.org/10.1177/0973801013519997
Pizzo, A. (2020). Literature review of empirical studies on Okun’s law in Latin America and the Caribbean. ILO Working Papers 995063292502676.
Richter, K., & Witkowski, B. (2014). Does growth generate jobs in Eastern Europe and Central Asia? World Bank Policy Research Working Paper, No. 6759, Washington, DC.: World Bank.
Sassi, S., & Goaied, M. (2016). Long-term employment intensity of sectoral output growth in Tunisia. International Labour Review, Vol. 155, issue 2, p. 253–263. https://doi.org/10.1111/j.1564-913x.2015.00034.x
Thuku, G. K., Omolo, J., & Muniu, J. (2019). Employment Intensity of Output Growth in Kenya. Journal of Economics and Finance, Vol. 10, p. 9–21.
Upender, M. (2011). Differential output elasticity of employment during post-economic reform period in the Indian economy. The Singapore Economic Review, Vol. 56, issue 02, p. 189–202. https://doi.org/10.1142/s0217590811004249
Zaki, C., Alshyab, N & Seleem, N. (2020). Employment intensity of growth and sectoral output growth: a comparative analysis of Egyptian and Jordanian economies. New Medit, Vol. 19, issue 1, p. 35–54. https://doi.org/10.30682/nm2001c