Ekonomika ISSN 1392-1258 eISSN 2424-6166
2022, vol. 101(2), pp. 22–37 DOI: https://doi.org/10.15388/Ekon.2022.101.2.2
Evaluation of the Symmetrical and Asymmetrical Causality Relationship Between Bitcoin Energy Consumption and Stock Values of Technology Companies
Nazlıgül Gülcan
Burdur Mehmet Akif Ersoy University, Bucak Business Administration Faculty,
Business Administration Department, Burdur, Turkey
Email: nazligulgulcan@mehmetakif.edu.tr
https://orcid.org/0000-0002-1390-0820
Fatma Gül Altın
Burdur Mehmet Akif Ersoy University, Bucak Zeliha Tolunay School of Applied Technology
and Business Administration, Customs Business Administration Department, Burdur, Turkey
Email: gulaltin@mehmetakif.edu.tr
https://orcid.org/0000-0001-9236-0502
Samet Gürsoy
Burdur Mehmet Akif Ersoy University, Bucak Zeliha Tolunay School of Applied Technology
and Business Administration, Customs Business Administration Department, Burdur, Turkey
Email: sametgursoy@mehmetakif.edu.tr
https://orcid.org/0000-0003-1020-7438
Abstract. Energy production is a phenomenon that has always preserved its importance for the history of humanity, as well as where the energy is spent and its consumption are also important. In this study, the causality relationship between Bitcoin energy consumption and stock values of technology companies (Apple, Dell Technologies, Lenovo Group, HP, Quanta Computer, Compal Electronics, Canon, Wistron and Hewlett Packard Enterprise) was examined. In the analysis, weekly price data for the period 12.02.2017-07.02.2021 were used. Toda and Yamamoto (1995) symmetric causality test and Hatemi-J (2012) asymmetric causality test were used to determine the relationship between Bitcoin energy consumption and technology companies’ stock values. According to the results of the Toda and Yamamoto (1995) causality test, it has been found that there is a causality from Bitcoin energy consumption to Apple’s stock value; according to the Hatemi-J (2012) asymmetric causality test results, it has been determined that there is a causality from Bitcoin energy consumption positive shocks to Apple, Dell Technologies, Lenovo Group, HP, Quanta Computer, Compal Electronics, Canon, Wistron and Hewlett Packard Enterprise stock values negative shocks and from Bitcoin energy expenditure negative shocks to Hewlett Packard Enterprise negative shocks. According to the results of the study in general, it is seen that the change in Bitcoin energy consumption has an effect on the company returns of the companies that sell the necessary tools for Bitcoin energy production. From this, it can be commented that Bitcoin mining has an effect on the stock returns of technology companies as well as many financial factors.
Keywords: Bitcoin Energy Consumption, Technology Companies, Toda and Yamamoto (1995), Hatemi-J (2012)
_________
Received: 07/05/2022. Revised: 23/06/2022. Accepted: 11/07/2022
Copyright © 2022 Nazlıgül Gülcan, Fatma Gül Altın, Samet Gürsoy. Published by Vilnius University Press
This is an Open Access article distributed under the terms of the Creative Commons Attribution License, which permits unrestricted use, distribution, and reproduction in any medium, provided the original author and source are credited.
1. Introduction
Cryptocurrencies have greatly impacted business world with a growing interest in fields ranging from computer science to finance and education (Ghosh et al., 2020:1). From the study of Nakamoto (2008) on electronic payment based on cryptographic system until March 2, 2022, 17,938 cryptocurrencies have emerged (CoinMarketCap, 2022). The explosion in the number of cryptocurrencies has offered speculators and investors a diverse range of electronic crypto assets to trade in (Wei, 2018:21). Despite this, Bitcoin remains the leader in the field of crypto assets in terms of market capitalization, user base and popularity (Mikhailov, 2020:89). Bitcoin rules are designed by engineers, it is a digital currency that is not affiliated with any central bank or public enterprise (Böhme et al., 2015:213).
The Bitcoin system is based on a network of users communicating with each other using the Bitcoin protocol via the internet. The Bitcoin protocol is an open source software application and allows users to store and transfer Bitcoins for purchasing and selling goods, or to exchange Bitcoins for other currencies (Vranken, 2017:1). The process of producing Bitcoin, called Bitcoin mining, uses Blockchain technology and basically only requires hardware and electricity consumption (Gallersdörfer et al., 2020:1843). The increase in Bitcoin prices has also led to an increase in the demand for Bitcoin mining. However, both the business world and researchers started to discuss the energy consumption in Bitcoin mining (Küfeoğlu and Özkuran, 2019:1).
Due to the increasing popularity of Bitcoin mining, the operation of the Bitcoin network as a whole with more hardware requires much more energy consumption (De Vries, 2021:509). It was concluded that as of June 2018, Bitcoin mining is no longer profitable for electricity prices above 0.14 $/kWh. For this reason, many Western miners have given up on Bitcoin production and the centralization of mining activity in China has increased even more (Delgado-Mohatar et al., 2019:1). The global Bitcoin mining map for August 2021 is shown in Figure 1. In the map, it is seen that the United States (35.40%), Kazakhstan (18.10%), Russian Federation (11.23%) and Canada (9.55%) are the countries with the most Bitcoin mining. After Bitcoin mining was banned in China in June 2021, some of the miners sold their hardware, while others took refuge in places like Texas or Kazakhstan. For this reason, while Bitcoin mining in China is not seen in Figure 1, Bitcoin mining in the United States and Kazakhstan has increased (Shen and Galbraith, 2021).
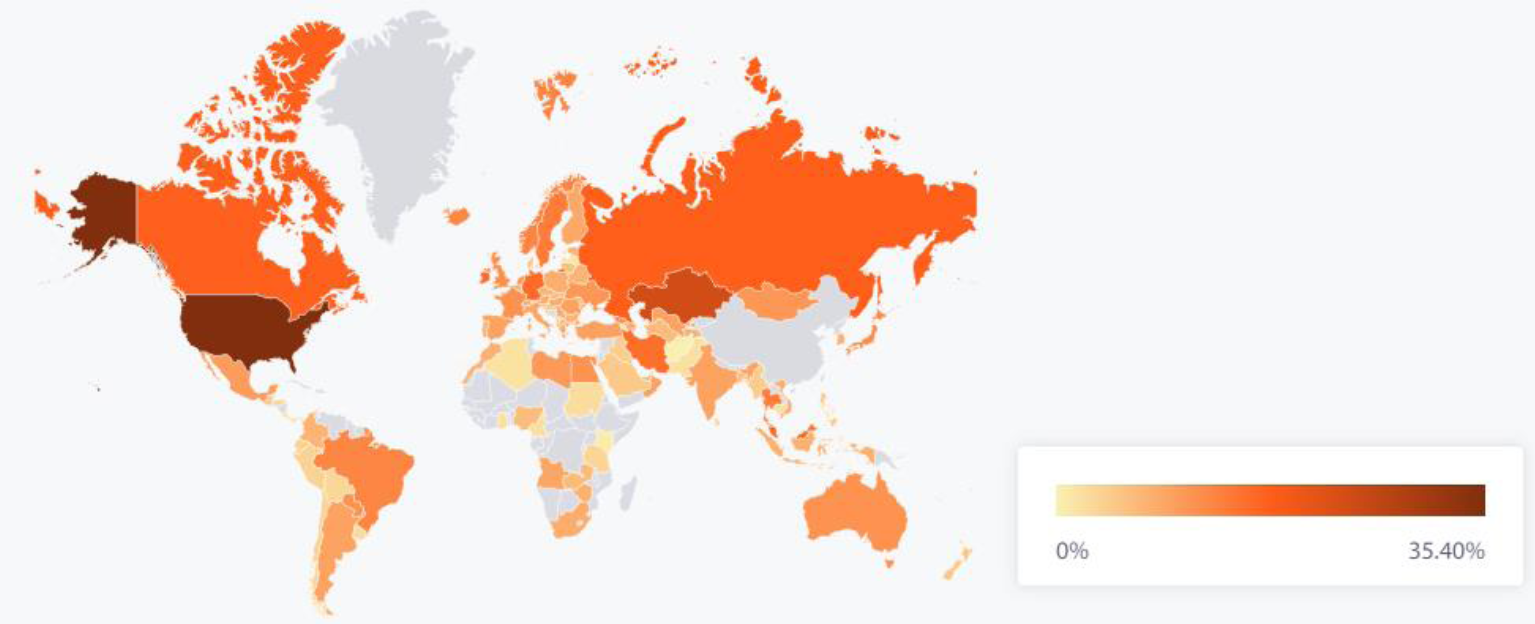
Figure 1. Bitcoin Mining Map
Source: Cambridge Centre for Alternative Finance, 2022.
Energy consumption is an important input for Bitcoin mining based on blockchain technology (Hayes, 2017:1316). Therefore, the increased energy consumption for Bitcoin mining has started a new discussion about the sustainability of the cryptocurrency. On the other hand, most studies ignore the growing amount of short-lived hardware that is one of the important inputs for Bitcoin mining (De Vries and Stoll, 2021:1). In May 2021, approximately 2.9 million specialized hardware devices worldwide were used for Bitcoin mining, generating 160 quintillion guesses per second and consuming approximately 13 gigawatts (GW) of electricity (De Vries et al., 2022:1). Therefore, the increasing electricity consumption for Bitcoin mining and the need for short-lived hardware increase the demand for technology companies. This situation enables the global technology companies, which are the subject of the study, to increase their market shares. Therefore, increasing demand positively affects the stock values of technology companies. In this study, the causality relationship is examined between Bitcoin energy consumption and stock values of technology companies using the Toda and Yamamoto causality test and Hatemi-J asymmetric causality test. With this aspect, the study will contribute to this gap in the literature.
The rest of this study is created as follows: In the subsequent section a brief literature review is given. In section 3, detailed explanations are given about the Toda and Yamamoto causality test and Hatemi-J asymmetric causality test approaches. In section 4, after describing the data, the causality analyses are made and the empirical findings are discussed. Finally, the results are evaluated and suggestions for next studies are presented.
2. Literature review
When the literature is searched, there are many studies showing that there is a causality relationship between Bitcoin and other indicators. However, due to the increasing demand for electricity in Bitcoin mining, it has been determined that studies examining the causality relationship between Bitcoin electricity consumption and other indicators intensified in the period after 2018. For this reason, the studies published on the subject after 2018 are summarized in Table 1. In general, it has been determined that there is a causality relationship between Bitcoin electricity consumption and other variables used in the studies.
Table 1. Literature Summary
|
Authors (Publication year) |
Variables |
Period |
Methodology |
Conclusion |
|
Gurrib (2019) |
- West Texas Intermediate (WTI) Crude Oil - European Brent Crude Oil - Henry Hub Natural Gas - No. 2 Heating Oil (New York Harbor) - SunContract (SNC) - Power Ledger (POWR) - Energo Labs (TSL) - Energy Coin (ENRG) |
21.11.2017- 10.09.2018 |
- Vector autoregressive model - Granger causality test |
Empirical findings show that natural gas price movements are better explained by the energy blockchain-based crypto price index (ENCX). Granger causality tests prove that the two markets (energy commodity price index (ENFX) and energy blockchain-based crypto price index (ENCX)) do not cause each other. The weak forecasting results of the VAR model confirm that the two markets are not good forecasters of each other. |
|
Hayes (2019) |
- Bitcoin price - Bitcoin marginal cost of production |
29.06.2013-27.04.2018 |
- Method of bubble detection - Granger causality test |
The findings of the study prove that the Bitcoin market is sensitive to price bubbles. On the other hand, the result of Granger causality test supports the relationship between Bitcoin marginal cost of production and Bitcoin price. |
|
Gkillas et al. (2020) |
- Bitcoin price - Gold - Crude oil |
02.11.2014-10.06.2018 |
- Granger causality test |
The findings show a weaker causality relationship between gold and crude oil and Bitcoin and crude oil compared to the relationship between Bitcoin and gold. |
|
Kristoufek (2020) |
- Bitcoin price - Bitcoin mining costs - Bitcoin hash-rate - Bitcoin electricity costs |
2014M1-2018M8 |
- Granger causality test - Toda and Yamamoto causality test |
The study shows that Bitcoin price and mining costs are closely linked. So much so that electricity costs play a primary role in Bitcoin mining efficiency. |
|
Mohsin et al. (2020) |
- Crypto-trade volume - GDP - Energy use - CO2 emission |
2012–2019 |
- VECM Granger causality test |
The findings indicate bidirectional causality between environmental degradation and crypto volume for long- and short-term and unidirectional causality for GDP and energy use. |
|
Schinckus et al. (2020) |
- Total primary energy consumption - Total indigenous electricity production - Trading volume of Bitcoin - Total trading volume on cryptocurrency market |
2014M1-2017M12 |
- Granger causality test |
The empirical results of the study prove that there is a positive relationship between cryptocurrencies trading volumes and energy consumption. In this context, the findings conclude that cryptocurrency activities have a significant positive (and incremental) effect on energy consumption, both in the short run and the long run. |
|
Di Febo et al. (2021) |
- Bitcoin price - IHS Markit Global Carbon Index |
01.08.2014-11.03.2021 |
- MVQM-CAViaR model - Granger causality test |
As a result of the analysis, it was concluded that Bitcoin price has a stronger effect on the carbon market. On the other hand, the causality test shows that there is a weak relationship between the Bitcoin price and the carbon market. |
|
Rehman and Kang (2021) |
- Bitcoin price - Bitcoin hash-rate - Oil - Gas - Coal |
01.01.2013-12.10.2018 |
- Causality in quantiles analysis |
The results of the causality on quantiles analysis show that Bitcoin returns cause changes in the Bitcoin hash-rate during the median quantities, which mostly have an asymmetrical pattern. |
|
Afjal and Sajeev (2022) |
- Bitcoin - Bitcoin cash - Ethereum - Ripple XRP - Litecoin - Nifty Energy Index - S&P 500 Energy Index - S&P/TSX Canadian Energy Index - Shanghai Stock Exchange Energy Index |
09.07.2016-18.06.2021 |
- Granger causality test - DCC-GARCH model |
The results of the research show that there is a weak correlation between the selected cryptocurrencies and energy markets, unlike the previous studies on the energy-cryptocurrency market. The returns volatility spillover peaked during the period 2020–2021 and 2016–2017. |
|
Aytekin and Kaya (2022) |
- Bitcoin - Electronic Funds Transfers - Electric Energy Consumption |
2016M4-2021M11 |
- Toda and Yamamoto causality test |
The findings show that there is a positive but statistically insignificant relationship between electronic fund transfers and electrical energy consumption in both the short and long term. On the other hand, it has been determined that there is a positive and statistically significant relationship between Bitcoin and electrical energy consumption both in the short and long term. |
|
Dogan et al. (2022) |
- S&P carbon emissions allowances - S&P global clean energy index - Bitcoin price - Bitcoin volume |
17.09.2014-12.10.2021 |
- Time-varying Granger causality test |
The empirical findings of the study confirm the causal relationship between Bitcoin with both clean energy and emissions allowances. |
|
Erdogan et al. (2022) |
- Bitcoin price - Ethereum price - Ripple price - CO2 Emission |
2010M8-2021M1 |
- Toda and Yamamoto causality test - Bootstrap-augmented Toda and Yamamoto test |
The analysis results indicate that there are asymmetric causal effects from cryptocurrency demand to environmental degradation. |
|
Huynh et al. (2022) |
- Bitcoin price - Bitcoin volumes - Bitcoin returns - Bitcoin energy consumption |
11.02.2017-18.09.2019 |
- Total spillovers index based on H-step-ahead generalized forecast error variance decomposition matrix from vector autoregressive model |
In the study, a relationship is found between Bitcoin energy consumption and its returns and volumes. In addition, the impact of Bitcoin trading volumes on energy consumption is higher than returns in the long run. |
|
Schinckus et al. (2022) |
- Hash-rate of Bitcoin - Hash-rate of Ether - Total primary energy consumption - Total electricity production - Total electricity supply - Total electricity consumption |
2016M1- 2021M5 |
- Granger causality test |
The results confirm that there is a positive link between Bitcoin/Ether hash rate and electricity demand. However, this positive relationship is not due to the trading volume, but to the increased trading volume for the formation of blocks. |
|
Tufan et al. (2022) |
- Bitcoin price, - WTI crude oil - Gold prices |
02.01.2015- 16.07.2020 |
- Toda and Yamamoto causality test |
In the study, it was concluded that while there is a bilateral causality relationship between Bitcoin and gold prices, it is not present between Bitcoin and oil prices. |
3. Research methodology
In this section, information is given about the Toda and Yamamoto causality test and Hatemi-J asymmetric causality test used in the study. The methodological framework of the study is shown in Figure 2.
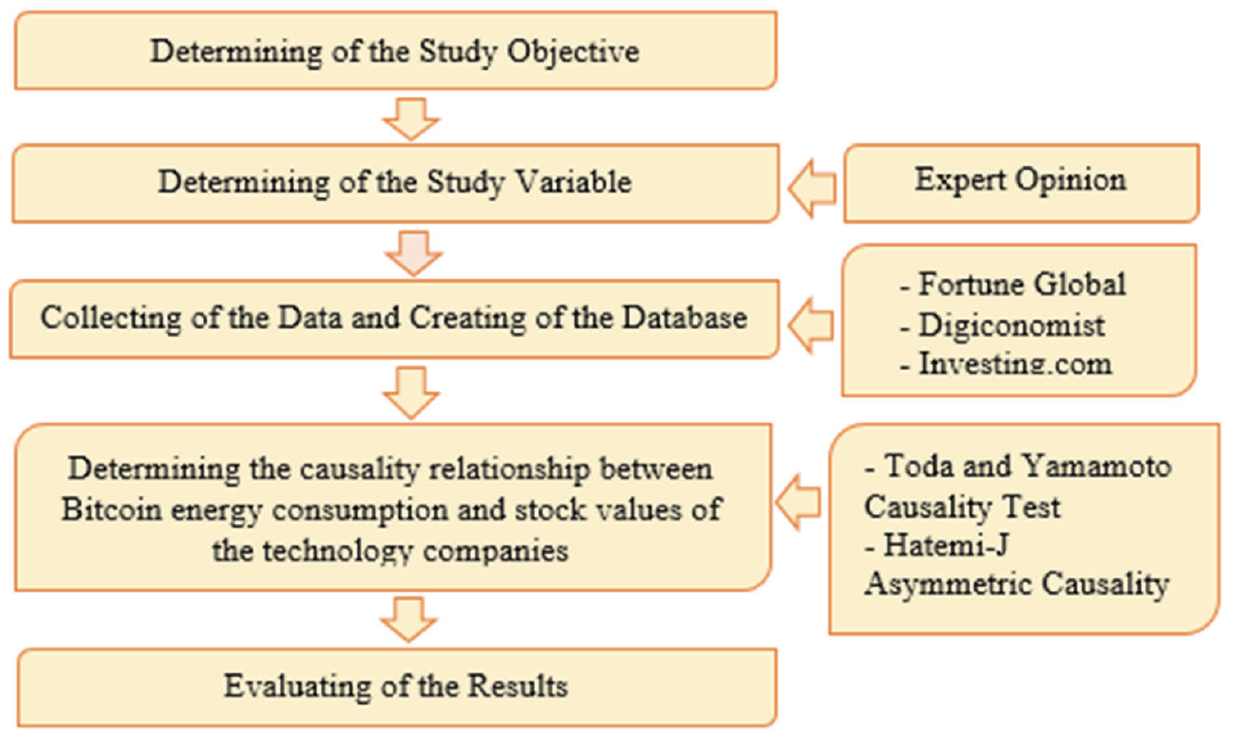
Figure 2. Methodological Framework
3.1. Toda and Yamamoto Causality test
VAR (Vector Autoregressive Models) analysis in time series is a type of analysis that researchers use very often. However, hypothesis tests are not valid in cases where the variables analyzed with VAR are not stationary (if they contain a unit root). After performing VAR analysis with series that are stationary (without unit root), According to the Granger causality test, the F statistic is used. However, Toda and Yamamoto (1995) state that if there is cointegration between the variables, the F statistic may not comply with the standard distribution and it may lose its validity. They also stated that VAR analysis can be done by using the level values of the variables and Wald test can be used if the variables contain unit root. In this case, if there is cointegration between the variables, there will be an error correction system (ECM). However, the degree of cointegration of the variables or whether they are cointegrated and whether they have unit roots is not known beforehand. For this reason, many pre-tests are required in the Granger Causality Test. In the Toda and Yamamoto (1995) test, on the other hand, a causality relationship can be tested when the variables become stationary at different levels.
In the Toda and Yamamoto (1995) test, the appropriate lag length (k) is determined using the VAR model. Following this step, the degree of integration (dmax) for the variable with the highest integration degrees and the lag length (k) calculated for the model are added. Finally, the estimation of the VAR model is made by considering the level values (k +dmax) of the series and the delays. The VAR model is implemented through equation (1), (2) (Toda and Yamamoto, 1995:230).
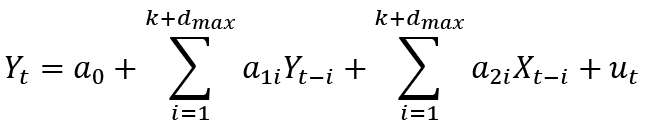 (1)
(1)
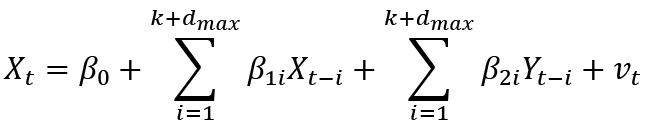 (2)
(2)
The hypotheses in the model are as follows:
H0: The X variable is not the Granger cause of the Y variable.
H1: The X variable is the Granger cause of the Y variable.
The success of the model is associated with the correct creation of the value of the (dmax) and (k) of series.
3.2. Hatemi-J Asymmetric Causality Test
In asymmetric causality analysis tests, it is argued that there is actually a hidden relationship between dual-time series, which cannot be correlated at first glance, and that there is no relationship between them, and these hidden relationships can only be found by considering the asymmetry between the components. The Hatemi-J (2012) test allows to investigate this relationship.
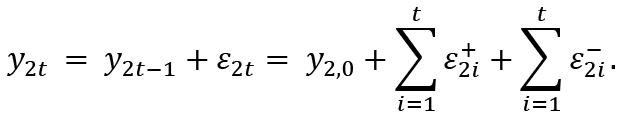
In the case of the run the causality relationship between two integrated variables y1t and y2t is as follows (Hatemi-J, 2012:449-450);
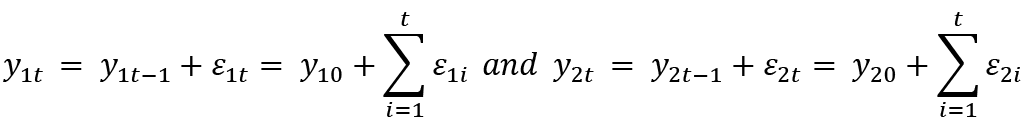 (3)
(3)
In the equations, t = 1, 2, …, T, indicates the constant terms, y1t and y2t show fundamental values, ε1i and ε2i are error term. Positive-negative shock is shown in equation (4);
 (4)
(4)
Therefore, it is expressed as  ve
ve 
The rewritten form of the equations is as follows;
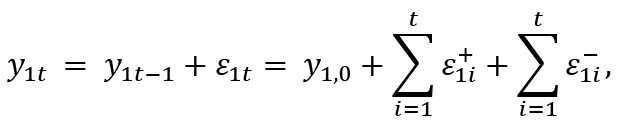 (5)
(5)
 (6)
(6)
Lastly, the positive and negative shocks in each variable are expressed in cumulative form as:
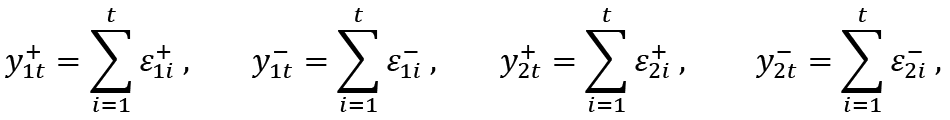 (7)
(7)
Then, assuming that  , the causality relationship between the positive components are analysed (VAR). VAR (p) model is termed as in equ. (8);
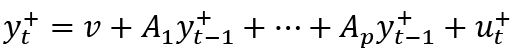 (8)
(8)
Here,  reveals a variable vector of size 2x1, v is constant variable vector of size 2x1,
  is error term of size 2x1.
 (9)
(9)
The symbol  in equation 9 represents the j lag length of the calculated VAR model error terms
First, the lag length is determined and then the (W) statistic is used to measure 11) the null hypothesis basic hypothesis, which shows that there is no Granger causality between the series. On the other hand, the VAR models established to reach (W) statistical values are as follows:
with a clearer expression Y = DZ + δ
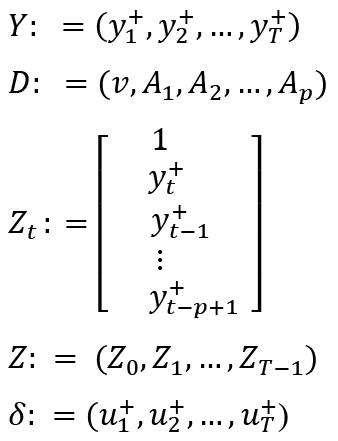 (10)
(10)
(10) equation the matrices are of different size Y:(n x T), D: (n x (1 + np)), Zt: ((1 + np) x 1), Z: ((1 + np) x T) and δ: (n x T). these indicators point to different sized matrices
4. Data, analysis and empirical findings
In this study, the causality relationship is examined between Bitcoin energy consumption and the stock values of technology companies. Apple, Dell Technologies, Lenovo Group, HP, Quanta Computer, Compal Electronics, Canon, Wistron and Hewlett Packard Enterprise have been taken into account to represent technology companies. In the analysis, weekly price data for the period 12.02.2017 -07.02.2021 were used. Bitcoin energy consumption data were obtained from the ‘digiconomist.net’ address and are expressed in TWh. The stock value data of technology companies were taken from ‘investing.com’ and are in US dollars. In the analysis, the natural logarithmic values of the data were used. In order to determine the relation between Bitcoin energy consumption and technology companies’ stock value, Carrion-i Silvestre et al. (2009) unit root test with multiple structural break, Toda and Yamamoto (1995) symmetric causality test and Hatemi-J (2012) asymmetric causality test were used.
The time path graphs of the variables are given in Figure 3 for a preliminary assessment of the variables.
According to Figure 3, it is seen that except Canon and Wistron companies show a decreasing trend and there are many structural breaks in each series.
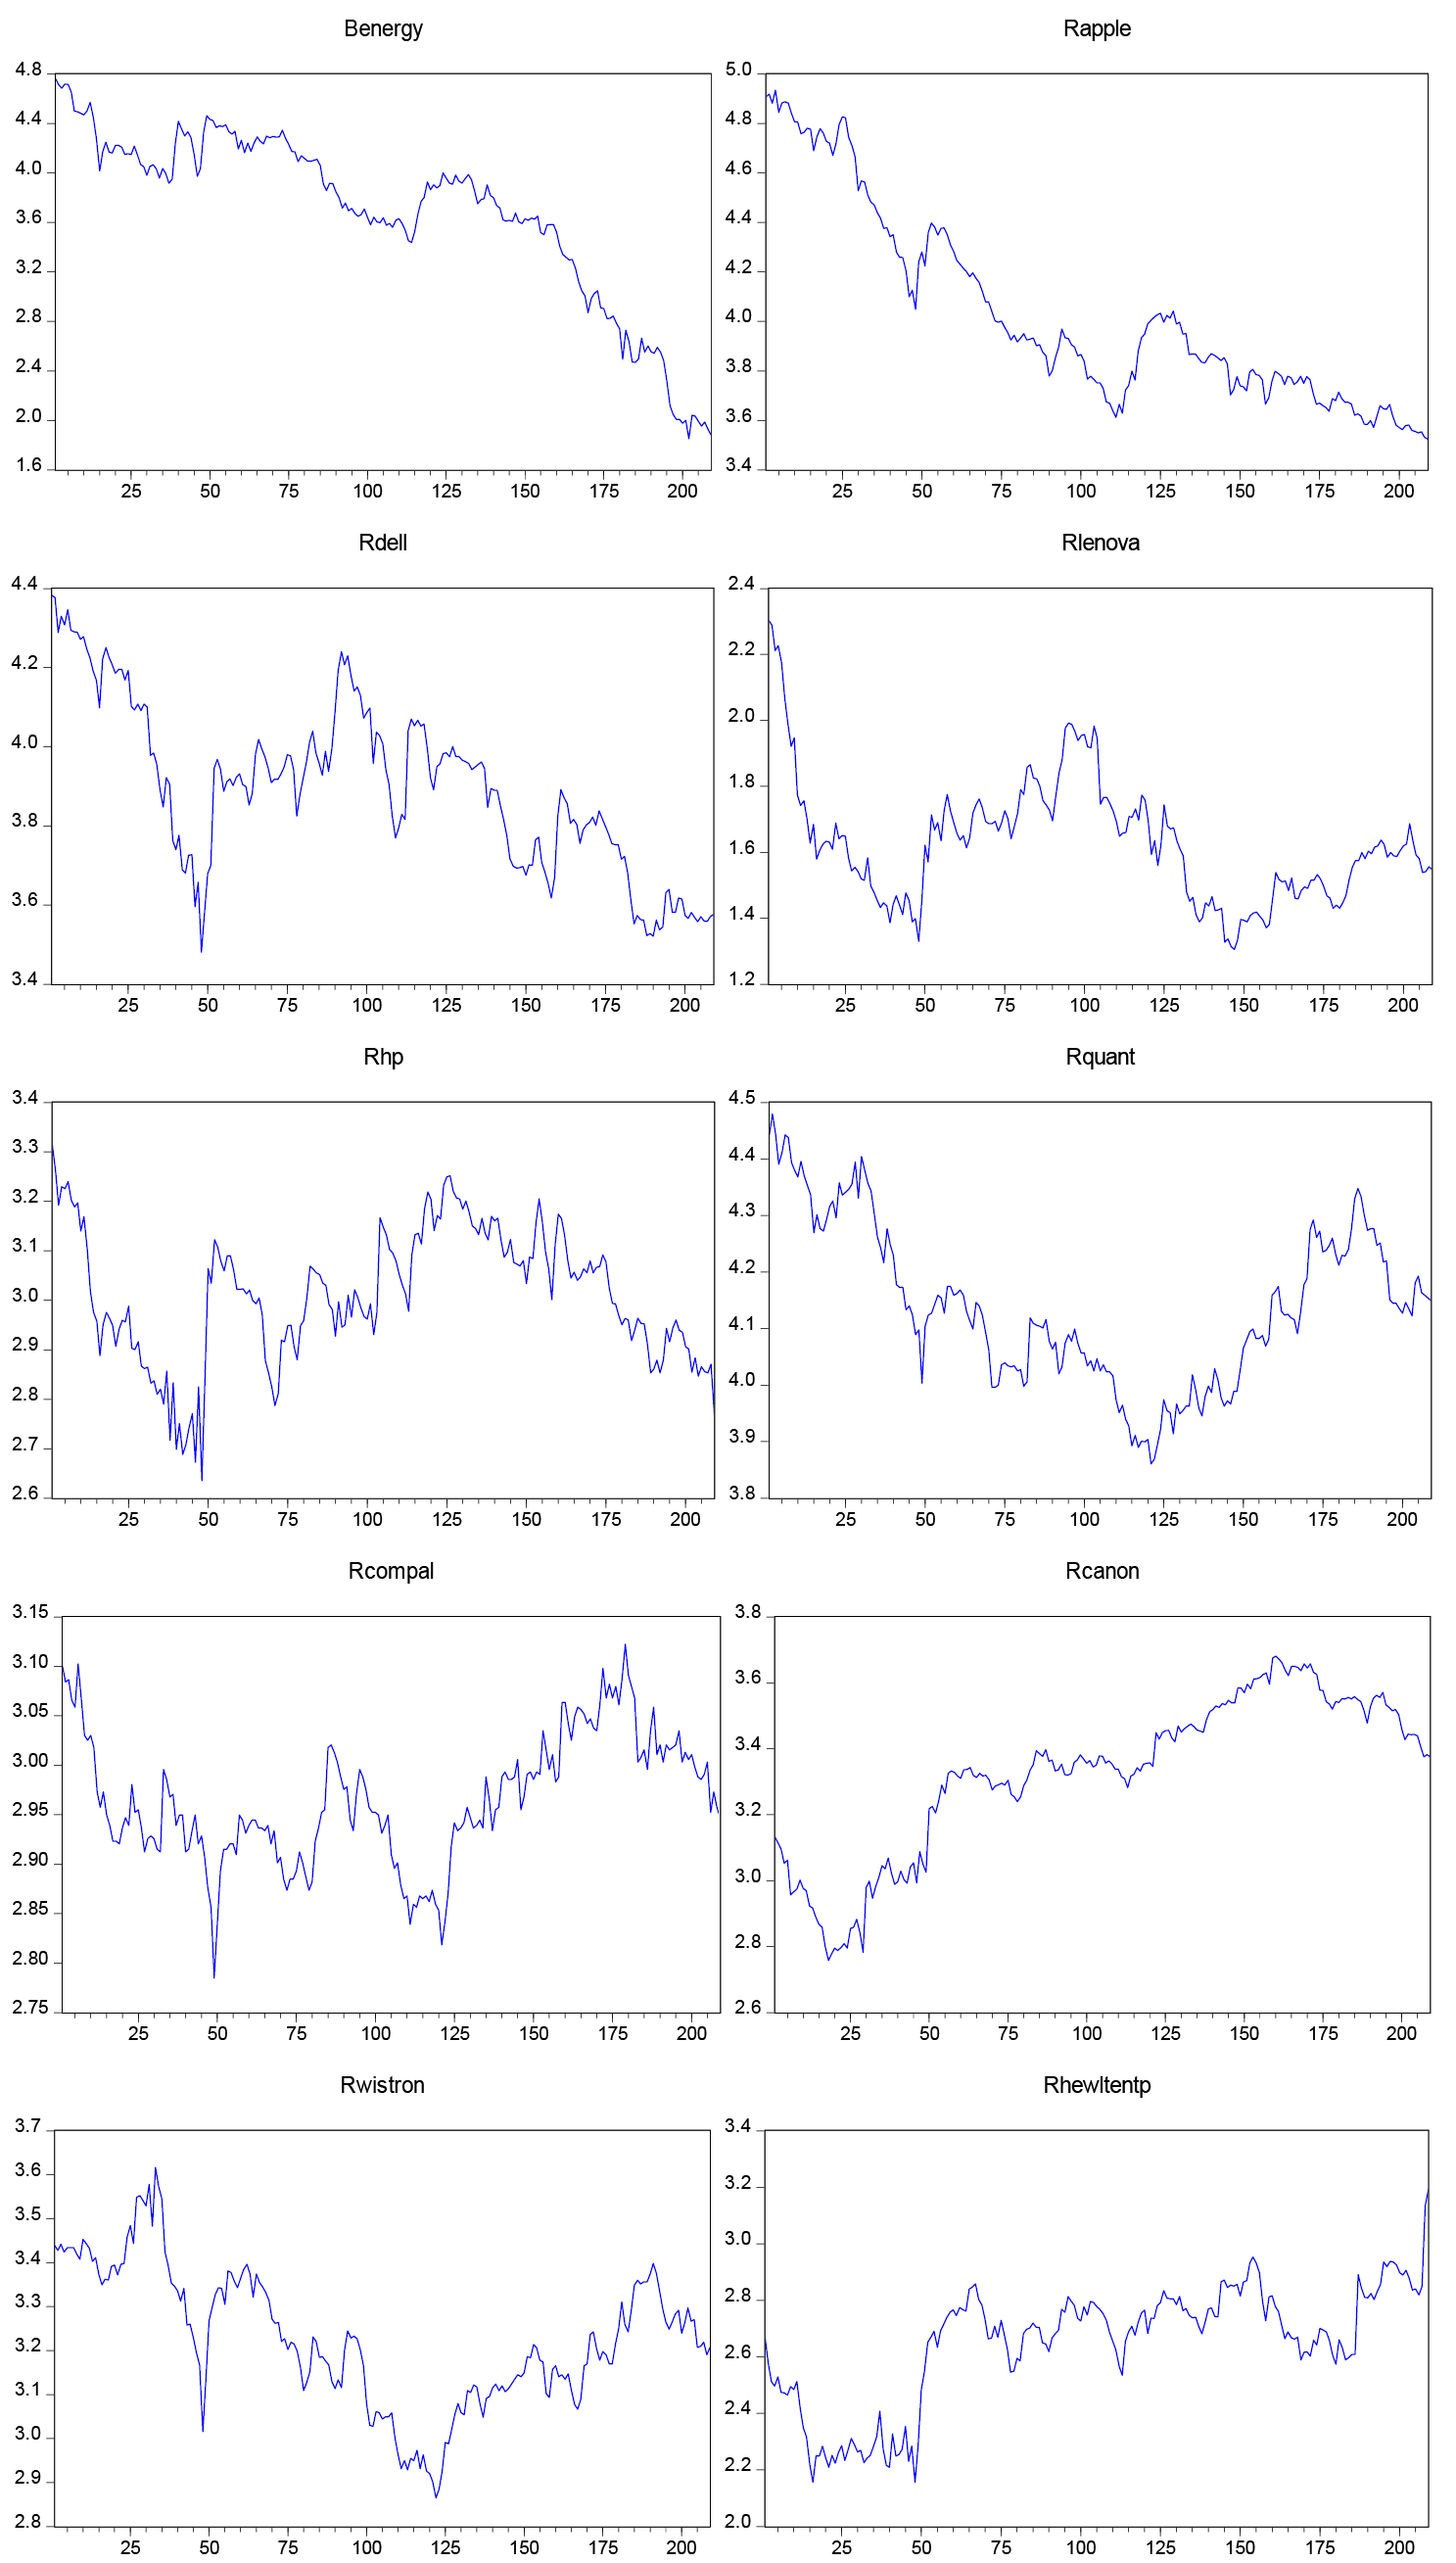
Figure 3. Time Path Plots of Variables
According to descriptive statistic information in Table 2, it is seen that Rquant has the highest average, Rlenovo has the lowest average; Benergy has the highest volatility, and Rcompal has the lowest volatility. When the skewness coefficients are evaluated, it is determined that the distribution of Benergy, Rhp, Rquant and Rhewltent are skewed to the left, and according to the kurtosis coefficients, except Benergy and Rlenovo, series are flattened.
In order to determine the stationarity of the series in the first stage of the research, Carrion-i Silvestre et al. (2009) multiple structural break unit root test was applied. The results of the test are given in Table 3.
Table 2. Descriptive Statistics
|
|
Benergy |
Rapple |
Rdell |
Rlenovo |
Rhp |
Rquant |
Rcompal |
Rcanon |
Rwistron |
Rhewltenp |
|
Mean |
3.6755 |
4.0291 |
3.8960 |
1.6275 |
3.0098 |
4.1380 |
2.9649 |
3.3257 |
3.2267 |
2.6481 |
|
Median |
3.8585 |
3.9058 |
3.9116 |
1.6194 |
3.0126 |
4.1255 |
2.9549 |
3.3559 |
3.2189 |
2.6973 |
|
Max. |
4.7611 |
4.9350 |
4.3827 |
2.3026 |
3.3138 |
4.4796 |
3.1224 |
3.6811 |
3.6163 |
3.1946 |
|
Min. |
1.8515 |
3.5243 |
3.4809 |
1.3056 |
2.6355 |
3.8607 |
2.7850 |
2.7581 |
2.8651 |
2.1552 |
|
Std. Dev. |
0.7006 |
0.3907 |
0.2119 |
0.1860 |
0.1324 |
0.1414 |
0.0642 |
0.2390 |
0.1560 |
0.2109 |
|
Skewness |
-1.0267 |
0.8863 |
0.1202 |
0.9887 |
-0.2621 |
0.2886 |
0.0890 |
-0.7108 |
0.0131 |
-0.7275 |
|
Kurtosis |
3.2669 |
2.6230 |
2.3374 |
4.4423 |
2.6747 |
2.3107 |
2.6207 |
2.5751 |
2.5443 |
2.8420 |
|
Jarq.-Bera |
37.3373 |
28.6015 |
4.3264 |
52.1676 |
3.3147 |
7.0382 |
1.5288 |
19.1723 |
1.8143 |
18.6544 |
|
Prob. |
0.0000 |
0.0000 |
0.1150 |
0.0000 |
0.1906 |
0.0296 |
0.4656 |
0.0001 |
0.4037 |
0.0001 |
|
Obs. |
209 |
209 |
209 |
209 |
209 |
209 |
209 |
209 |
209 |
209 |
Table 3. Carrion-i Silvestre et al. (2009) Unit Root Test Results with Multiple Structural Breaks
|
PT |
MPT |
MZα |
MSB |
MZT |
Breaking Dates |
|
|
Benergy |
3.9473 |
3.8297 |
-102.4516 |
0.0697 |
-7.1473-(4.7121) |
15.10.2017, 11.03.2018, 05.08.2018, 02.02.2020, 28.06.2020 |
|
Rapple |
3.3556 |
3.2846 |
-97.2247 |
0.0716 |
-6.9709 (-4.6239) |
22.07.2018, 16.12.2018, 12.05.2019, 06.10.2019, 01.03.2020 |
|
Rdell |
3.7966 |
3.6202 |
-102.0701 |
0.0699 |
-7.1438 |
01.07.2018, 23.12.2018, 30.06.2019, 24.11.2019, 09.04.2020 |
|
Rlenovo |
4.0096 |
3.9119 |
-94.0496 |
0.0728 |
-6.8561 |
02.07.2017, 26.11.2017, 22.04.2018, 08.03.2020, 02.08.2020 |
|
Rhp |
3.7646 |
3.6128 |
-104.4812 |
0.0691 |
-7.2265 |
02.07.2017, 26.11.2017, 22.04.2018, 23.09.2018, 19.04.2020 |
|
Rquant |
3.6700 |
3.5437 |
-104.4061 |
0.0691 |
-7.2241 |
02.07.2017, 26.11.2017, 22.04.2018, 23.09.2018, 19.04.2020 |
|
Rcompal |
4.2350 |
4.0341 |
-103.7309 |
0.0693 |
-7.1984 |
13.08.2017, 07.01.2018, 17.02.2019, 11.08.2019, 05.01.2020 |
|
Rcanon |
4.0580 |
3.9218 |
-96.8494 |
0.0717 |
-6.9483 |
30.07.2017, 24.12.2017, 20.05.2018, 14.10.2020, 10.03.2020 |
|
Rwistron |
3.6680 |
3.5313 |
-103.9264 |
0.0693 |
-7.2068 |
15.10.2017, 11.03.2018, 05.08.2018, 19.04.2018, 13.09.2020 |
|
Rhewltentp |
5.4899 |
5.3345 |
-83.16930 |
0.0773 |
-6.4292 |
09.07.2017, 03.12.2017, 06.05.2018, 30.09.2018, 24.02.2019 |
Note: PT, MPT, MZα, MSB and MZT are the test statistics of Carrion-i Silvestre et al. (2009) unit root test.
According to Carrion-i Silvestre et al. (2009) unit root test results with multiple structural breaks in Table 3, it is seen that the level values of all series are smaller than the critical values of the test statistics, so that there is no unit root in all series, that is, the series are stationary in their level values.
To determine whether there is a symmetric causality relation between the series, the Toda and Yamamoto (1995) causality test was performed. The results of the test are given in Table 4.
Table 4. Toda and Yamamoto (1995) Causality Test Results
|
Aspect of Causality |
X2 Statistic |
Conclusion |
|
Benergy→Rapple |
9.544025(0.0085)*** |
There is causality |
|
Benergy→Rdell |
0.893806(0.6396) |
There is no causality |
|
Benergy→Rlenovo |
0.301988(0.8599) |
There is no causality |
|
Benergy→Rhp |
0.086853(0.9575) |
There is no causality |
|
Benergy→Rquant |
3.076019(0.2148) |
There is no causality |
|
Benergy→Rcompal |
1.200448(0.5487) |
There is no causality |
|
Benergy→Rcanon |
0.604082(0.7393) |
There is no causality |
|
Benergy→Rwistron |
2.230333(0.3279) |
There is no causality |
|
Benergy→Rhewltentp |
1.537670(0.4636) |
There is no causality |
Note: *** in the table denotes 1% significance level.
According to the results of the Toda and Yamamoto (1995) causality test in Table 4, a causality running from Bitcoin energy consumption to Apple’s stock value appears to be. Thus, Bitcoin energy consumption has been determined to be the Granger reason of the Apple company.
Hatemi-J (2012) asymmetric causality test was used to determine whether there is an asymmetric causality relation between the series. The results of testing are given in Table 5.
According to the Hatemi-J (2012) asymmetric causality test results in Table 5, it has been determined that there is a causality from Bitcoin energy consumption positive shocks to Apple, Dell Technologies, Lenovo Group, HP, Quanta Computer, Compal Electronics, Canon, Wistron and Hewlett Packard Enterprise stock values negative shocks. In addition, it is found that there is a causality from Bitcoin energy expenditure negative shocks to Hewlett Packard Enterprise negative shocks. With these results, Bitcoin energy consumption is the Granger cause of Apple, Dell Technologies, Lenovo Group, HP, Quanta Computer, Compal Electronics, Canon, Wistron and Hewlett Packard Enterprise companies’ stock values.
5. Conclusion
In recent years, the cryptocurrency markets and the stock exchanges established depending on these markets, the functioning of these stock exchanges, the regulations, the relations of cryptocurrencies with other financial assets and sectors have been the subject of discussion. Especially after 2018, Bitcoin energy consumption based on crypto mining has become the focus of these discussions. For Bitcoin mining, first of all, energy consumption and computer hardware are needed. The demand for computer hardware required for Bitcoin mining plays an increasing role on the stock returns of technology companies. Accordingly, the existence of a relationship between the energy spent for Bitcoin and computer hardware has been wondered. This study focuses on the causal relationship between Bitcoin energy consumption and the stock value of technology companies. The companies (Apple, Dell Technologies, Lenovo Group, HP, Quanta Computer, Compal Electronics, Canon, Wistron and Hewlett Packard Enterprise) that make up the data set of the research are in the computer and office equipment sub-sector of the technology sector in the 2021 Fortune Global 500 list.
In this study, which examines the causal relationship between Bitcoin energy consumption and Apple, Dell Technologies, Lenovo Group, HP, Quanta Computer, Compal Electronics, Canon, Wistron and Hewlett Packard Enterprise, it is taken into account to represent the stock markets of technology companies. Daily price data for the period 12.02.2017 -07.02.2021 were used in the analysis. Toda and Yamamoto (1995) symmetric causality test and Hatemi-J (2012) asymmetric causality test were used to determine the relationship between Bitcoin energy consumption and the stock values of technology companies. According to the results of the Toda and Yamamoto (1995) causality test, it has been found that there is a causality from Bitcoin energy consumption to Apple’s stock value; according to the Hatemi-J (2012) asymmetric causality test results, it has been determined that there is a causality from Bitcoin energy consumption positive shocks to Apple, Dell Technologies, Lenovo Group, HP, Quanta Computer, Compal Electronics, Canon, Wistron and Hewlett Packard Enterprise stock values negative shocks and from Bitcoin energy expenditure negative shocks to Hewlett Packard Enterprise negative shocks. In terms of future studies, it is suggested to create an equation that takes into account Bitcoin energy consumption and state sanctions, the perspective and popularity of global markets on these transactions. The creation of this broad equation will allow to look at the subject from a broader perspective. Finally, it is thought that these findings will provide a market information for international investors, and it has been seen that the profitability of this sector is also closely related to Bitcoin energy consumption.
According to the findings obtained from the study, it is seen that the change in Bitcoin energy consumption has an effect on the returns of the companies that sell the necessary tools for Bitcoin energy production. Because of these results, it was concluded that Bitcoin energy consumption is not only a modern challenge in the new world order, but also a dynamism in the Bitcoin mining industry. In the academic literature research, no study has been found that examines the relationship between Bitcoin energy consumption and the share values of technology companies. In this respect, it is thought that the study is original and will contribute to the literature. Since in the cryptocurrency markets there is not only the energy consumption of Bitcoin but also the energy spent for Ethereum, the causality relationship between the energy consumption spent for Ethereum production and the share values of technology companies can be investigated in future studies. It is also suggested to create an equation that takes into account Bitcoin energy consumption and government sanctions, the perspective and popularity of global markets on these transactions. The creation of this broad equation will allow to look at the subject from a broader perspective.
References
Afjal, M. and Sajeev, K. C. (2022). Interconnection between Cryptocurrency and Energy Market: An Analysis of Volatility Spillover. OPEC Energy Review (Online First), 1-23.
Aytekin, I. and Kaya, M. V. (2022). Investigation of the Effects of Digital Money Bitcoin and Electronic Funds Transfers on Electric Energy Consumption. 24th RSEP International Conference on Economics, Finance&Business, Vienna, Austria, 149–155.
Böhme, R., Christin, N., Edelman, B. and Moore, T. (2015). Bitcoin: Economics, Technology, and Governance. Journal of Economic Perspectives, 29(2), 213–238.
Cambridge Center for Alternative Finance, Access Address: https://ccaf.io/cbeci/mining_map, (02.03.2022).
Carrion-i Silvestre, J. L., Kim D. and Perron P. (2009). GLS-Based Unit Root Tests with Multiple Structural Breaks under Both the Null and the Alternative Hypotheses. Econometric Theory, 25, 1754–1792.
CoinMarketCap, Access Address: https://coinmarketcap.com/tr/, (02.03.2022).
Delgado-Mohatar, O., Felis-Rota, M. and Fernandez-Herraiz, C. (2019). The Bitcoin Mining Breakdown: Is Mining Still Profitable? Economics Letters, 184, 1–4. https://doi.org/10.1016/j.econlet.2019.05.044
De Vries, A. (2021). Bitcoin Boom: What Rising Prices Mean for The Network’s Energy Consumption. Joule, 5(3), 509–513. https://doi.org/10.1016/j.joule.2021.02.006
De Vries, A. and Stoll, C. (2021). Bitcoin’s Growing E-Waste Problem. Resources, Conservation & Recycling, 175, 1–11. https://doi.org/10.1016/j.resconrec.2021.105901
De Vries, A., Gallersdörfer, U., Klaaßen, L. and Stoll, C. (2022). Revisiting Bitcoin’s Carbon Footprint. Joule, 6(3), 498–502. https://doi.org/10.1016/j.joule.2022.02.005
Di Febo, E., Ortolano, A., Foglia, M., Leone, M. and Angelini E. (2021). From Bitcoin to Carbon Allowances: An Asymmetric Extreme Risk Spillover. Journal of Environmental Management, 298, 1–8. https://doi.org/10.1016/j.jenvman.2021.113384
Digiconomist-Exposing the Unintended Consequences of Digital Trends, Access Address: https:// digiconomist.net, (08.02.2021)
Dogan, E., Majeed, M. T. and Luni, T. (2022). Are Clean Energy and Carbon Emission Allowances Caused by Bitcoin? A Novel Time-varying Method”. Journal of Cleaner Production, 347, 1–13. https://doi.org/10.1016/j.jclepro.2022.131089
Erdogan, S., Ahmed, M. Y. and Sarkodie, S. A. (2022). Analyzing Asymmetric Effects of Cryptocurrency Demand on Environmental Sustainability. Environmental Science and Pollution Research (Online First), 29(21), 31723–31733 https://doi.org/10.1007/s11356-021-17998-y
Gallersdörfer, U., Klaaßen, L. and Stoll, C. (2020). Energy Consumption of Cryptocurrencies Beyond Bitcoin. Joule, 4(9), 1843–1846. https://doi.org/10.1016/j.joule.2020.07.013
Ghosh, A., Gupta, S. Dua, A. and Kumar, N. (2020). Security of Cryptocurrencies in Blockchain Technology: State-of-Art, Challenges and Future Prospects. Journal of Network and Computer Applications, 163, 1–35. https://doi.org/10.1016/j.jnca.2020.102635
Gkillas, K., Bouri, E., Gupta, R. and Roubaud, D. (2020). Spillovers in Higher-Order Moments of Crude Oil, Gold, and Bitcoin. The Quarterly Review of Economics and Finance (Online First), 1–9.
Gurrib, I. (2019). Can Energy Commodities Affect Energy Blockchain-based Cryptos? Studies in Economics and Finance, 36(4), 682–699.
Hatemi-J, A. (2012). Asymmetric Causality Tests with an Application. Empirical Economics, 43(1), 447–456. https://doi.org/I10.1007/s00181-011-0484-x
Hayes, A. S. (2019). Bitcoin Price and its Marginal Cost of Production: Support for a Fundamental Value. Applied Economics Letters, 26(7), 554-560. https://doi.org/10.1080/13504851.2018.1488040
Hayes, A. S. (2017). Cryptocurrency Value Formation: An Empirical Study Leading to a Cost of Production Model for Valuing Bitcoin. Telematics and Informatics, 34(7), 1308–1321. https://doi.org/10.1016/j.tele.2016.05.005
Huynh, A. N. Q., Duong, D., Burggraf, T. Luong, H. T. T. and Bui, N. H. (2022). Energy Consumption and Bitcoin Market. Asia-Pacific Financial Markets, 29(1), 79–93.
Investing.com-Stock Market Quotes & Financial News, Access Address: https://investing.com, (08.02.2021)
Kristoufek, L. (2020). Bitcoin and its Mining on the Equilibrium Path. Energy Economics, 85, 1–9. https://doi.org/10.1016/j.eneco.2019.104588
Küfeoğlu, S. and Özkuran, M. (2019). Bitcoin Mining: A Global Review of Energy and Power Demand. Energy Research&Social Science, 58, 1-12. https://doi.org/10.1016/j.erss.2019.101273
Mikhailov, A. Y. (2020). Cryptocurrency Market Development: Hurst Method, Finance Theory and Practice, 24(3), 81–91.
Mohsin, M., Naseem, S., Zia-ur-Rehman, M., Baig, S. A. and Salamat, S. (2020). The Crypto-trade Volume, GDP, Energy Use, and Environmental Degradation Sustainability: An Analysis of the Top 20 Crypto-trader Countries. International Journal of Finance and Economics (Online First), 1-17. https://doi.org/10.1002/ijfe.2442
Nakamoto, S. (2008). Bitcoin: A Peer-to-Peer Electronic Cash System. Access Address: https://bitcoin.org/bitcoin.pdf, (27.02.2022).
Schinckus, C., Nguyen C. P. and Chong, F. H. L. (2022). ‘Cryptocurrencies’ Hash-rate and Electricity Consumption: Evidence from Mining Activities. Studies in Economics and Finance (Online First), 1–23.
Schinckus, C., Nguyen C. P. and Ling, F. H. C. (2020). Crypto-currencies Trading and Energy Consumption. International Journal of Energy Economics and Policy, 10(3), 355–364.
Shen, S. and Galbraith, A. (2021). China’s Ban Forces Some Bitcoin Miners to Flee Overseas, Others Sell Out. Access Address: https://www.reuters.com/technology/chinas-ban-forces-some-bitcoin-miners-flee-overseas-others-sell-out-2021-06-25/, (05.03.2022).
Rehman, M. U. and Kang, S. H. (2021). A Time–frequency Comovement and Causality Relationship between Bitcoin Hashrate and Energy Commodity Markets. Global Finance Journal, 49, 1–17.
Toda, H. Y. and Yamamoto, T. (1995). Statistical Inference in Vector Auto Regressions with Possibly Integrated Processes. Journal of Econometrics, 66, 225–250. https://doi.org/10.1016/0304-4076(94)01616-8
Tufan, E., Hamarat, B. and Yalvaç, A. (2022). Bitcoin and Seatmates. Scientific Annals of Economics and Business, 69(1), 1–16.
Vranken, H. (2017). Sustainability of Bitcoin and Blockchains. Current Opinion in Environmental Sustainability, 28, 1–9. https://doi.org/10.1016/j.cosust.2017.04.011
Wei, W. C. (2018). Liquidity and Market Efficiency in Cryptocurrencies. Economics Letters, 168, 21–24. https://doi.org/10.1016/j.econlet.2018.04.003