Ekonomika ISSN 1392-1258 eISSN 2424-6166
2023, vol. 102(1), pp. 6–25 DOI: https://doi.org/10.15388/Ekon.2023.102.1.1
Yana Fareniuk
Taras Shevchenko National University of Kyiv, Ukraine
yfareniuk@gmail.com
Galyna Chornous
Taras Shevchenko National University of Kyiv, Ukraine
chornous@univ.kiev.ua
Abstract. The paper describes the marketing mix modeling results for companies in nonfood retailing. The main objectives of the research are to demonstrate the viable way of making effective recommendations for optimizing the media strategy by modeling offline and online traffic to the stores based on econometric modeling and to develop a decision support system, which enhance the effective growth of business KPIs and an effective decision-making process. Econometric modeling, deeper data analysis, decision support were implemented on the data of one of the main retailers in Ukraine in a period before the full-scale Russian invasion. Estimating the impact of different communication channels on business results made basis for ROI calculations and optimization of media investments allocation among media channels by periods, video durations, type of advertising and with optimal weekly media pressure. ROMI calculation was based on the results of regression modeling, which estimate the level of traffic and sales generated by each media channel. The information-analytical decision support system based on an interactive dashboard has been developed for improvement of day-by-day business planning and management. The developed framework of regional strategy selection facilitates to the formation of a strategic vision on a regional scale and improves the quality of a regional media strategy.
Keywords: Marketing mix modeling, regression analysis, decision support system, interactive dashboard, traffic
___________
Received: 11/05/2022. Revised: 09/05/2022. Accepted: 17/10/2022
Copyright © 2023 Yana Fareniuk, Galyna Chornous. Published by Vilnius University Press
This is an Open Access article distributed under the terms of the Creative Commons Attribution License, which permits unrestricted use, distribution, and reproduction in any medium, provided the original author and source are credited.
Retailing faces a number of challenges on a daily basis. Attraction of new customers is among the key tasks to retail stores, what means the generation of online and offline traffic, which in turn will be converted into the appropriate level of sales and turnover. Given the intensification of marketing competition and the unstable economic situation, the emergence of new factors (Grosul et al., 2019), the task of maximizing the stores’ traffic requires to find new effective solutions, and increases the relevance of the researches in this area.
There is a need to analyze a wide range of factors and their impact by modeling key business indicators and to effectively manage the performance of retailing. Thus, in order to avoid possible threats and to be able to assess the possible consequences, to find the best ways to develop business, companies need to use modern implements that will increase the enterprise efficiency (Podskrebko et al., 2019). Mathematical modeling, more specifically, marketing mix modeling, is one of the main tools for realization of these substantial tasks.
Given the variety of brands in competitive markets, the role of advertising is growing significantly. It opens new opportunities for business and helps consumers to make their choices. The main purpose of advertising is the impact on the purchasing decision-making of potential consumers (Voronko-Nevidnycha et al., 2018).
Media tasks for retail company can be divided into the three groups: reach, performance and push campaigns. The first priority is the reach campaigns that increase brand awareness and, as a result, generate additional traffic to the stores. They accumulate the largest share of media budget, as the task of generating the stores’ traffic has the highest priority.
Media planning will significantly reduce the uncertainty of expected results and achieve a consistent improvement of financial result at the lowest cost and with optimal investment. To get the most response, it is necessary to optimize the communication channels through the development of an effective media plan, which provides the advertising in these channels, with such intensity, frequency and periodicity to achieve the greatest coverage of the target audience (TA) with the maximum efficiency of influence (Arkhipova, 2009).
To avoid inefficiency and achieve the goal of optimizing the media cost, companies need to implement mathematical models of advertising optimization (marketing mix modeling). The development of methods for evaluating the advertising effectiveness is an extremely important issue, due to the complexity of consumer behavior, the emergence of new opportunities in interaction with consumers and changes in the advertising cost. Media strategy optimization will contribute to the effective promotion, rational use of resources, achieving high financial results, will ensure the sustainable long-term growth of the company.
The aim of the paper is to demonstrate the viable way of making recommendations for optimizing the media strategy by marketing mix modeling, including selection of relevant and most effective media channels, their prioritization according to expected ROI, optimization of media pressure, effective distribution of media investments by format, by periods during the year and so on. Moreover, the main practical task is the development of information-analytical decision support system for operational management of business with optimal updating of media strategy. As experiment, marketing mix modeling and dashboard system were implemented for one of the leading Ukrainian nonfood retail companies.
The research was implemented in 2021 (before the full-scale Russian invasion of Ukraine), but key findings of this research can be used in planning of marketing activities of Ukrainian companies on a recovery stage after war and international retail companies and others market categories in countries similar to Ukraine-2021 in economic positions and consumer behavior for optimization of their media strategy, as well as a scientific society for further development of mathematical methodology in marketing and its application to solve actual problems and tasks.
Advertising is one of the most important marketing activities to satisfy the consumer’s needs, increase brand awareness and, as a result, increase sales. Media activity and its influence on consumers are given significant attention in the scientific researches, where the models of media response to offline and online ways to buy emerged as the key. Dash et al. (2019) proposed a marketing response model with all possible interaction effects and an estimation of the efficiency of each media channel. Cain (2021) emphasizes that no one model effectively provides a full view on the advertising influence and proposes a more integrated structural approach.
The effectiveness of media strategy is a function of a dynamic process that consists of internal resources of the firm, external factors and the activity of competitors. Mensah et al. (2021) using the method of structural equations modeling (SEM) show that the communication strategies have a positive and significant influence on consumer’s behavior. Ibrahim et al. (2020) assess the impact of competitors’ actions on the effectiveness of marketing strategy by simultaneous equation modeling of the business performance.
Marketing plays a central role in the brand’s development, and effective communication support is vital for an innovative marketing mix. Liu (2021) provides an overview of key communication activities used to support the brand. Modern marketing actively relies on digital tools to analyze the media efficiency and improve the development of future strategies.
Media strategy is an integral part of marketing strategy, and there is significant optimization capability for businesses that implement deep data analysis to find effective solutions and improve competitive advantage. To make informed business decisions for an effective media strategy, it is advisable to use a systematic approach based on Data Science technologies that open up great opportunities in this area (Chornous & Fareniuk, 2021).
At the current stage, traditional retailing has significant drop due to the increasing number of modern stores. High level of competitiveness lead to urgent need to best meet the consumer’s requirements in the most efficient way, using elements of marketing complex. Wacker et al. (2021) presented the modeling of the merger of strategies with marketing solutions, which is the key to the overall strategy optimization.
Kumar et al. (2020) describe the impact of promotional activities, consumer’s demand and other factors on the system development based on neural network and fuzzy classifiers. Mukherjee et al. (2016) propose a SEM, which represents the impact of the marketing mix on a brand image. Chantayarkul et al. (2020) propose the GREAT model, which helps to increase the stores’ competitiveness, fight weaknesses and enforce strengths by developing the process of their systematization and greater efficiency due to getting a better business understanding and doing business with clear instructions.
The marketing mix influences consumers’ purchasing decisions. Sriram et al. (2019) show that the popularity of websites were significantly influenced by the effective intelligent promotion methods. Shi (2021) proposes logistic regression, decision tree and random forest to predict the behavior of online shoppers. As customers usually make a few visits before purchase, it is important to monitor their customer journey and evaluate the value of certain interactions with attribution models. Kakalejčík et al. (2021) explore advertising companies using Markov chains. Sadikoglu et al. (2019) offer fuzzy logic based on hierarchical model of decision-making, which includes the main inaccurate factors influencing consumer behavior. Huseynov (2019) developed the model of behavior evaluation. The results of these studies can be used to effectively allocate marketing resources and develop a more successful marketing mix.
Businesses are limited in the ability to measure the media efficiency due to reducing in access to user-level data. They will have to use alternative ways, including the marketing mix modeling through regression analysis, which help to address future changes in the ecosystem of marketing data (Kamena, 2021). The development of information technologies and methods has improved the methodology of assessment through modeling and forecasting of economic values.
There are many communication channels that can be used to increase business profitability. However, the realization of any media investment should provide positive results. So, it is necessary to evaluate the possible results of these activities from the point of view of the business and estimate the potential return on media investment (ROMI) to select the most effective media split.
Social media marketing tools are a phenomenon that has become an important aspect of the marketing mix. Ghanem et al. (2020) and Haudi et al. (2022) investigate the positive impact of social networks on performance and purchasing decisions using SEM.
Yan et al. (2022) propose a novel least squares twin support vector regression method to alleviate the negative effect of traffic data with outliers. Although there are some known works on the problems of traffic forecasting, their effectiveness depends largely on the collected traffic data. Deart et al. (2022) aimed to develop a model for predicting the traffic based on the classification using the random forest regression. Li et al. (2022) developed an ensemble approach to learning or adaptive enhancement to reduce error. The Mendez-Suarez study (2021) uses maximum entropy bootstrapping that is specifically designed for time series which have autocorrelation structure or seasonal fluctuations such as Christmas or Black Friday.
Legendre et al. (2020) investigate the effectiveness of the experience of interaction with the brand on the formation of the memory of visitors and their involvement, intention to return using the method of PLS-SEM. Suttikun et al. (2020) determined that previous experience has a significant impact on visitors. Marketing managers need to build a strong brand experience related to greater brand awareness and memory formation.
The study by Kusumawati et al. (2021) focuses on the analysis of the individual and collective influence of marketing mix on purchasing. The study found that distribution impacts on purchase intentions, while advertising impacts on purchase decisions. Kengpol et al. (2022) propose a study of the main influencing factors of consumer behavior and a system to support consumer decision-making. The results show that marketing mix has a direct impact on consumer behavior. Among the predictors of business efficiency, the marketing mix has the strongest impact (Supawan et al., 2020). Issock et al. (2021) describe that the influence of the marketing mix depends on the stage at which the TA is.
Chenavaz et al. (2020) explore the interaction between price, advertising and quality in the optimal control model. The results reveal the lucrative potential of a business that manages a more complex marketing mix.
An important marketing challenge is to understand the influence and contribution of different marketing efforts on sales and profits. Nowadays, it becomes increasingly difficult to assess the effectiveness of investments through separate marketing channels. Woodley (2021) proposes the State Space model, which estimates the effects of individual channels on sales. The proposed structure allows to change the effects of transfer between media channels and allows different rates of decay for each channel, so paves the way for more comprehensive marketing mix optimization.
De Pelsmacker et al. (2021) investigate the use of mixed quantity modeling to analyze the impact of advertising activity on purchases and the distribution of these effects between channels. It shows how to quantify the synergy between different media channels, how the optimal media mix differs depending on the advertising budgets and the patterns of media use by consumers. Najafi-Ghobadi et al. (2021) prove that there is a threshold of the optimal trajectory of advertising activity. Smith (2021) provides a set of equations to measure the impact of marketing on business profitability, which is used as part of the intellectual decision-making, as all companies are trying to support their business and find ways to overcome uncertainty.
The results of marketing mix modeling for each business will vary as the achieved results are a combination of many factors that are formed at each time, which requires an individual approach and review of recommendations for each company on the market (Chernyak & Fareniuk, 2020). It is relevant to adapt all researches into specifics of each market situation.
Despite the significant achievements of the scientists, many issues of media strategy optimization and marketing mix modeling for offline and online traffic to retail stores remain unclear, in particular, the effectiveness of different media channels, calculation of ROI for retailing, prioritization and redistribution of activity during the year, considering seasonal ROMI and so on.
The main goal of the study is to show the viable way of making effective recommendations for media strategy and to develop an interactive dashboard on the example of one of the key brands in Ukraine. This will help to increase the level of traffic to the stores and, as a result, enhance the sales’ growth through more effective consumers’ attractiveness and supporting the process of regular making of effective media decisions.
Based on the goal of the research, it is necessary to select the appropriate target metrics for modeling and analyze the possible relationship between them.
The research was deployed in accordance with the analysis of consumer journey. There are two options for the transition from interest to visit. The first one is offline traffic and the second is online traffic, but a lot of people switch between these channels. For example, the first visit takes place online with goals to check information, availability of products, the next one may be offline visit and purchase, so there is a growing need to make a full analysis and estimate the real impact of different channels on general business results. Considering such specific, we constructed the separate models for offline and online traffic. Moreover, consumer behavior differs regionally, what requires extra models for traffic in separate cities.
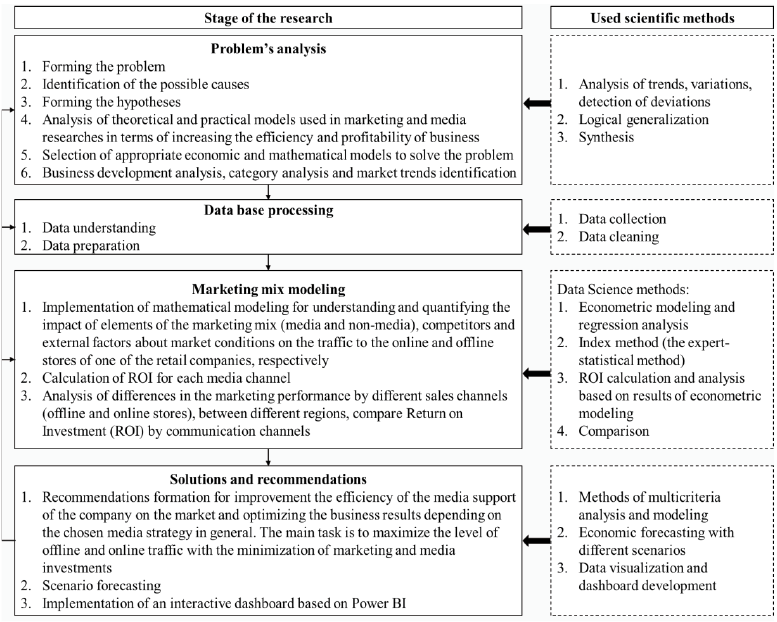
To achieve the research goal, we use a system approach based on Data Mining process, that allows to analyze the existing problem and find effective solutions through marketing mix models (Fig. 1).
An econometric model plays a central role in the methodology. It is a tool for assessing the impact of various factors on traffic and business performance. It can isolate brand drivers (media activity, marketing factors (changes in store’s network, price policy and others), competitor’s activity, macroeconomic factors and so on), quantify their effects, make comparisons between them and realize scenario forecasting.
Estimating the degree of media factors’ impact, comparison of such influence by communication channels in terms of profitability helps to develop recommendations for media strategy and media mix, to prioritize advertising channels by levels of media support, media budget allocation and, as a result, to increase ROMI.
The econometric model allows to predict the target metric depending on the planned indicators of each factor and to form recommendations on the optimal / required values of each factor to achieve the goals.
For day-by-day integration of Data Science into media strategy planning we developed information-analytical system as an interactive dashboard by Power BI with integration of previously accumulated knowledge based on econometric modeling, data analysis and monitoring of all key business indicators. Such system was called Management System of Brand’s Marketing.
One of the Ukrainian nonfood retailers in recent years has a significant level of media support, which has a strong impact on business performance. An important part of business growth is increasing sales, which can be realized by traffic growth and maintaining a high level of conversion rate from traffic to purchases. The current company’s media mix mainly consists of TV and Digital, Out of Home (OOH). Radio is used as an additional media with low share in budget. This company’s data was selected for the experiment.
Econometric models are based on quantitative data collected over an extended period of time. Some variables are controlled, such as media activity, and some are not controllable, such as competitor’s activity.
At the start, we have collected a database with all the necessary indicators in three groups. The first group is data of the retail company from internal database and includes the following data: business results (traffic, receipts, turnover) by each store; number of loyalty cards, volume of mailings; qualitative data on the specifics of the business, such as opening or closing stores and so on. So, all data are strictly confidential and were normalized from 0 to 1. The second group includes the media activity of company and its competitors in all communication channels from the Nielsen Ukraine. The third group is open-source data which describe macroeconomic situation, category development, the consumer’s mood and so on. Daily data on all indicators for the period from 2017 to 2021 (before the full-scale Russian invasion of Ukraine) were collected and integrated in R-Studio software for modeling.
The main trends that formed the basis of modeling are given below.
Physical and digital shopping is growing, so companies need to increase their presence in all points for contact. Consumers often visits stores within walking distance, so expanding the stores network is also crucial.
The growing role of Digital is one of the general market trends. At the moment, TV in Ukraine still plays a weighty part, but the market has switched its attention to digital channels, as it’s a highly effective channel. OOH is a relevant instrument for retailing, as each store requires an individual approach for regional support. Radio is a frequency instrument, which increases the engagement of consumers.
Each communication channel has a different significance in the efficiency on offline or online traffic. The main assumptions about media response are that TV has the highest impact on offline traffic, and Digital has the highest significance for online traffic, as online media stimulates online traffic and offline media drive offline traffic. Besides, there is a highly significant synergistic effect of online media on offline traffic and offline media (TV) on online traffic. The significance of contact with OOH and Radio is lower, but there are some additional conversions from these contacts to traffic, and significance for offline traffic is higher.
The main criteria for media strategy optimization are achievement of maximum level of traffic to offline and online stores and, as a result, sales with minimization of media investments. Modeling of business KPIs is the basis for the intelligent analysis necessary for making complex management decisions with the greatest efficiency and ensuring effective future business growth.
Mathematical modeling of the dependence of traffic to the store on a number of factors were used to achieve the research goal. Among the main factors of influence are such as: number of stores and cities in the company’s retail network, level of mailing, brand’s and its competitors’ activity in all media channels, number of loyalty cards and others. Advertising activity was evaluated by communication channels, creatives, video durations and so on. All factors were selected by analysis of correlation with traffic by character and significance.
For each traffic, we constructed the multiple regression model, which has following structure:
Traffic = Constant + Seasonality_additive + a1*Number_of_stores + a2*Number_of_cities + a3*Stores_quality_indicators + a4*E-mail + a5*Viber + a6*Loyalty_cards_number + e*Covid_crisis + (a7*Adstock(TV1) + a8*Adstock(TV2) + a3 * Adstock(TV3) + c1*Adstock(Digital_video) + c2*Adstock(Display) + d1*Adstock(OOH) + d2*Adstock(Radio) + b1*Adstock(TV_Competitors) + f1*Adstock(OOH_competitors) + f2*Adstock(Digital_video_competitors) + f3*Adstock(Display_competitors) + f4*Adstock(Radio_competitors)) * Media_efficiency_index + ε,
where
Adstock(TVt) = TVt + a*Adstock(TVt-1),
where (1-a) is the memory decay of advertising.
For the multiple regressions for offline and online traffic on a national scale and for main regions separately, which were estimated by the method of least squares, main hypotheses about the adequacy of the models, the significance of the coefficients for all factors, the presence of heteroskedasticity and autocorrelation were tested. All working models undergo testing and meet the following specifications: more than 90% for accuracy; more than 75% for R2; 95% probability for t-statistics and f-statistics.
As a result, we constructed qualitative models to assess the influence of different factors that determine the level of traffic and formed the recommendations. The average error was within 5–9% for each key traffic. R2 was from 91% to 97% (Table 1), which indicates the high quality of constructed models and their practical relevance and value for real business application.
|
Indicator |
Coefficient |
Stand. Error |
t-statistics |
P-value |
|
Constant |
3004.37 |
51.45 |
58.39 |
0.0 |
|
Seasonality_additive |
1.08 |
0.06 |
16.92 |
0.0 |
|
Covid_crisis |
1.06 |
0.10 |
10.97 |
0.0 |
|
E-mail and Viber |
10.46 |
3.16 |
3.31 |
0.0 |
|
TV1 |
128.33 |
0.61 |
210.38 |
0.0 |
|
TV2 |
110.62 |
0.85 |
130.14 |
0.0 |
|
TV3 |
275.68 |
2.33 |
118.32 |
0.0 |
|
Digital_video |
76.27 |
10.10 |
7.55 |
0.0 |
|
Display |
48.61 |
7.25 |
6.70 |
0,0 |
|
OOH |
42.74 |
3.02 |
14.15 |
0.0 |
|
Radio |
28.61 |
0.37 |
77.32 |
0.0 |
|
Competitors |
-5.93 |
0.12 |
-49.42 |
0.0 |
|
Multiple / Adjusted R2 |
0.91 / 0.90 |
F-statistics |
368.32 |
P-value 0.0 |
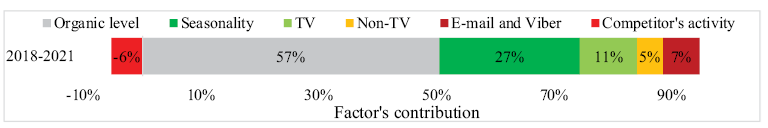
Media activity generates a significant share of offline traffic – 16%, an increase in the number of loyalty cards and SMS mailing is 7%. The seasonality contribution is 27%, and the impact of organic factors is 57% for the whole period. The activities of competitors have a negative impact, which on average leads to a loss of 5–7% of traffic.
Media contribution changed during the analyzed period from 13% to 20% due to changes in media mix (higher or lower share of OOH and Radio support, different split between TV and Digital, different split by video durations and by digital formats) and due to different media pressure during a year (high and low season).
Let’s analyze the nonmedia group of factors.
Significant seasonality is typical for business: demand for this market is growing significantly in the second half of the year, which is similar to general consumer’s economic activity. The seasonality is the same for offline and online traffic. Black Friday, New Year are key periods during a year (Fig. 2). Periods from January to March and from August to December are the periods of highest sales level. The seasonality contribution was determined as additive seasonality in models, and it varies during the year from 8% to 41%.
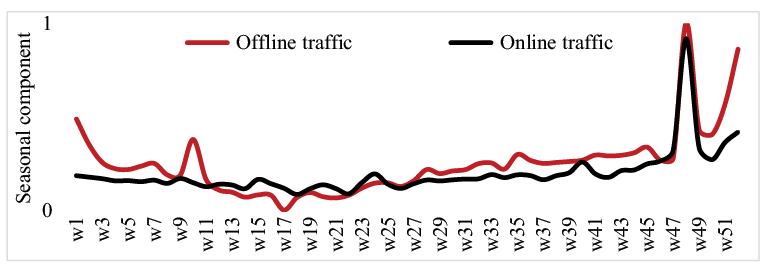
There is also seasonality within a week: on weekends the traffic significantly increases. The intensity of growth differs by month and the maximum growth is typical for the highest period of September–December.
On some holidays, the volume of traffic drops significantly and it is best to exclude them from the plan of media activity due to low media return and low deferred demand. The main periods with low activity are January 1st, Christmas, Easter (drop of traffic by ~50–90% vs organic level).
On another holidays demand rises significantly, so it is relevant to increase media pressure. The period of sales and special offers stimulates an increase in traffic: it is recommended to continue to be active during the Women’s Day, Black Friday, Pre-New Year period (there is a growth of traffic by 35–100% vs organic level).
It is necessary to consider that during a period of big sale, all advertisers communicate the same message about discount, and the potential client can make a visit to different stores and make its choice. So, in this period competitors drive total market visits on the market and, as a result, their media activity helps to increase business results.
So, we determined the period of high level of consumption and period for increasing of media pressure. It is a New Year Eve, Saint Valentine’s and Women’s Days, Back to School Period and Black Friday.
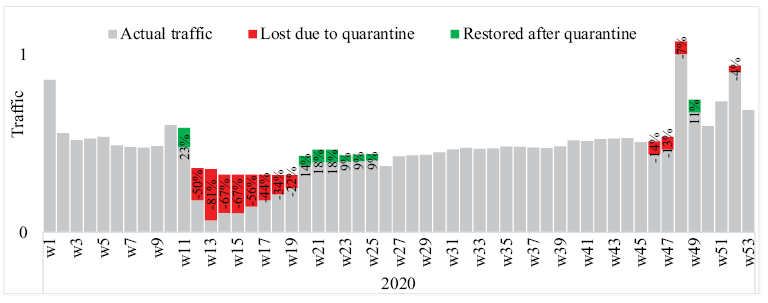
Quarantine has a significant negative impact on organic traffic, but consumers have almost restored their economic behavior. Some part of consumers’ demand was deferred from the period of lockdown to the next periods. A sharp decline in mobility and population’s income has led to a significant reduction in traffic (up to 81%), but after the restrictions are lifted, consumers’ activity is gradually recovering, partially compensating for the loss of lockdowns (there was additional growth of traffic by up to 18%) (Fig. 3).
The next group of factors is the media activity of the brand and its competitors.
Growing loyalty cards and working through SMS are the key tools, and their contribution to traffic increased from 4% in 2018 to 10% in 2021.
Media activities are the main levers of influence on traffic in the short term. Brand’s media activity provides from 9% to 20% of traffic, while competitor’s one takes away from 2% to 7%. Increasing of media’s contribution in previous years is driven by both increased pressure and increased response. The contribution of competitor’s media support was quite low, so there was significant incremental growth by advertising (from 4% to 17% of traffic).
TV is the main driver of offline traffic (Fig. 4). In average, the contribution of TV is about 11%, the influence of non-TV channels is 5%, where Digital accumulates 3% of traffic. So, 69% of media contribution is generated by TV and 31% by non-TV media, but share of non-TV is increasing due to changes in media mix.
In 2020, due to media activity, brand managed to attract an additional +32% of online traffic. TV and Digital have the biggest impact: 19% and 12%, respectively. Other media generated up to 1% of online traffic. Competitor’s activity also has higher influence on online traffic in comparison with offline traffic (-8%).
There is a synergy of TV and Digital activity: online media influence offline traffic and offline media have an impact on online traffic.
In 2020–2021, the contribution of media support into offline traffic increased to 18%, where 14% was generated by TV and 4% by other media channels. The impact of OOH advertising decreased from 4% to 0.5% due to drop in volume of pressure and drop in media response as a reaction on lockdowns and decreasing of consumer’s activity in period of COVID-19. The impact of Digital is unchanged in this period, but there is significant growth in the contribution of TV in case of similar level of media investment. In this situation, there is an increase of ROMI as a result of changes in split of formats.
All the results of marketing mix modeling for national offline and online traffic are available in the developed information-analytical Power BI dashboard on the panel named Marketing Mix Models for Traffic. Such a panel is designed to monitor the weekly model decomposition, and factors contribution for all periods and develops the necessary solutions for increasing the traffic.
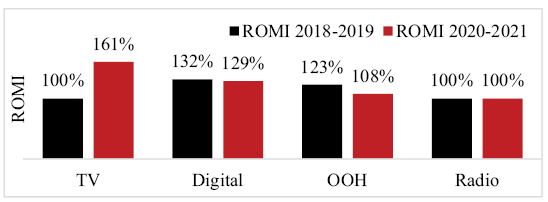
TV and Digital generate the largest share of offline and online traffic and have the highest ROMI for this brand (Fig. 5). Digital is media number two in media mix with a significant impact on both offline and online sales, but it has lower effect on offline traffic and works more for the online store. It is advised to strengthen the media mix with OOH as regional media and Radio as additional media for increasing of contact’s frequency.
Competitor’s activity has low negative effect on traffic, and the main task in these conditions is not the leading share of voice (SOV), but the optimization of the TA coverage. Effective cumulative coverage is recommended. The competitor’s influence is quite large on the purchase stage, so it is also necessary to control the conversion from traffic to receipt. Increasing conversions should be one of the areas of business decisions.
The media activity contribution to traffic also varies during the year from 1% to 34%, depending on the month. Seasonal media efficiency was determined by multiplicative seasonality index for media factors and is related to business activity of consumers in this period.
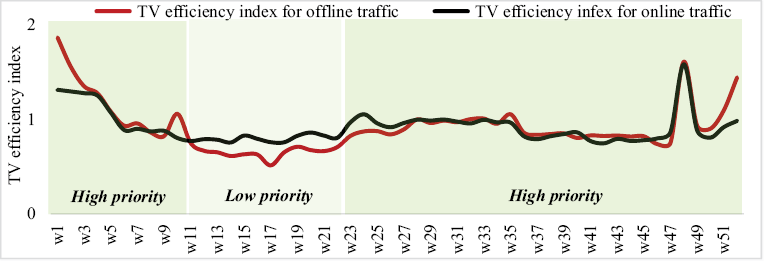
It is advised to maintain a permanent presence throughout the year, but there are some periods of high and low priority for more effective allocation of media investments during the year. So, considering the seasonality of traffic and cost for TV advertising, we determined the seasonal ROMI (Fig. 6), that highlight the period for increasing of activity and a period for only supporting media campaigns. Periods from January to March and the second half of the year have a higher media response and strengthening of media support during these periods is recommendable. In the rest of the time, it is relevant to minimize activity, considering low media response.
TV activity within a week also has a different efficiency, so there is capacity for optimization in the weekly planning. For most months, the best solution is to boost placement on weekdays before the weekend.
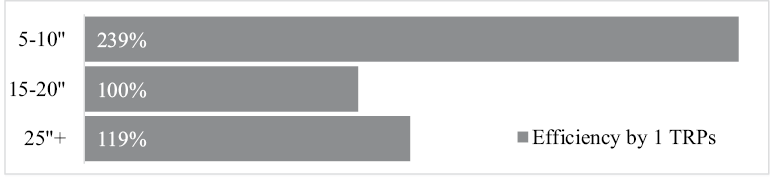
Each video durations have different performance due to different message and different quality of contact with consumers. The main tasks of long video are image, building a communication platform. The main task of short videos is maximization of coverage and contacts with the TA. The media response from different video durations for this brand is presented on Figure 7.
Mix of long and short videos is suggested to achieve short-term and long-term goals for traffic growth. Short versions have a high return on traffic, but it is necessary to connect several image campaigns with long versions to form the brand perception.
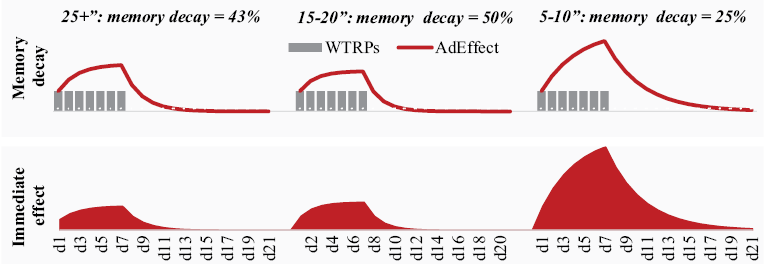
The effectiveness of the video is determined by the memory decay and the level of instant response (Fig. 8). Considering memory decay, there are opportunities to optimize the architecture of campaigns by realizing constant presence with up to two weeks break between flights.
Optimal media pressure: an activity range of X to Y TRPs per week is most effective for traffic growth, but during key periods, an increase by 50% is relevant due to significant growth of demand.
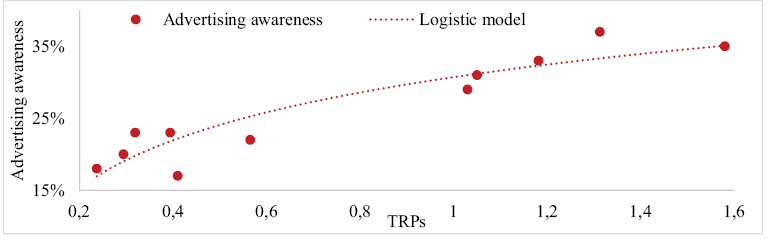
Media activity determines the advertising awareness and brand awareness, as a result. There are nonlinear connections between media pressure (in TRPs) and advertising awareness (Fig. 9). To achieve an advertising awareness of 30+%, it is necessary to realize some level of TRPs per media campaign.
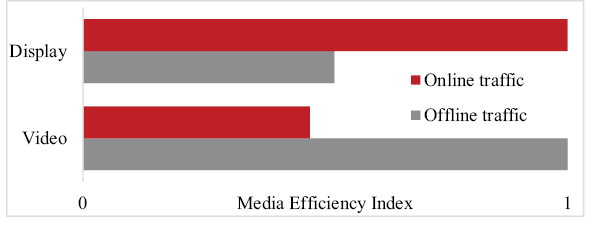
Video formats in Digital are more effective for offline traffic compared to display ads, but display advertising is more effective instrument for online traffic due to specifics of consumer journey (Fig. 10).
All key findings and indicators are available in the developed decision support system on the panels called ROMI Analysis, Advertising Formats Efficiency. These interactive blocks will help to monitor the media response and ROMI by various tools and formats and find the effective recommendations for media strategy.
Radio and OOH are effective tools that help to increase business results on a regional and national scale. Regional radio is a useful tool for traffic growth when opening new stores as it generates up to 10% of traffic in period of activity. Radio allows us to increase awareness and traffic with low investments. Besides, radio can support the media effect and minimize memory decay after the main media campaign, generating additional +20% of media effect from other media channels.
Nationwide, the influence of OOH activity is quite low as outdoor is a regional media, effect from which is no similar for each city. So, we analyzed the regional specific and built additional regional models for key cities. It is necessary to deepen into analytics and modeling in the context of cities to form a regional media strategy.
Evaluation of the market potential with Brand Development Index (BDI) and Category Development Index (CDI) helps to increase the opportunities for key business segments, prioritize work with them and optimize the marketing investments. It is a useful and effective tool for strategic planning, which makes it possible to analyze the regional specifics of doing business.
The BDI allows to evaluate the potential of the brand in the category, estimate the current level of brand’s development and outline the visibility of the brand by consumers in a particular region.
BDI = (% of brand’s sales in the region from total brand’s sales in the country) /
(% of the population in the region from the total population of the country) * 100%
If BDI>100%, the indicator is considered high for the region and the brand has a strong position in it.
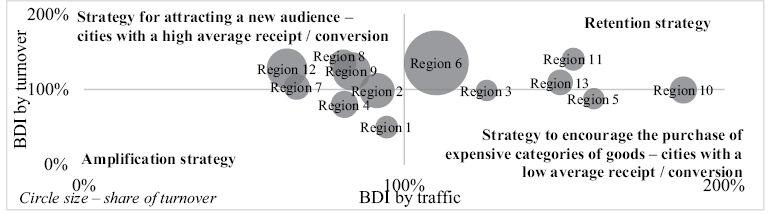
According to BDI, each city has different capacity for business growth and there are different conclusions from BDI calculations based on traffic data and turnover data. We propose a new framework of regional segmentation based on BDI by traffic and BDI by turnover (Fig. 11).
The CDI assesses the consumption and capacity of the category compared to the market as a whole, shows the level of potential brand development in the region, considering sales of all brands in the market.
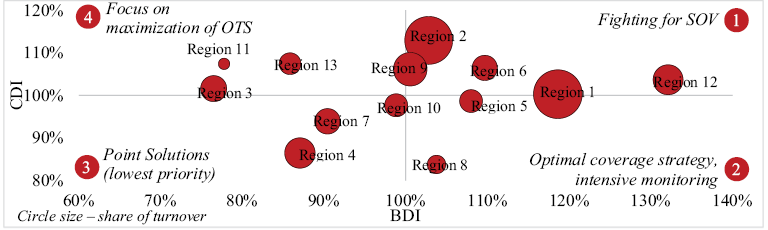
Different product structure and consumer preferences require the development and implementation of regional communications. Each segment needs to be supported, but with adaptation of media pressure, according to the strategic focus. Considering the results of BDI and CDI analysis (Fig. 12), the best decision is to realize coverage solutions for the whole of Ukraine and additional support in key cities by OOH, because they have the highest capability for business growth.
OOH activity is a relevant effective instrument for regional support of offline retail stores. Based on the constructed econometric models for two main cities, it was estimated, that the contribution of OOH to offline traffic increased up to 1–2% (depends on city) in comparison with less than 0.5% on a national scale. Regional analysis and modeling are also available in the developed dashboard on the panel named Regional Summary.
So, we estimated the impact of each media on online and offline traffic (national and regional) and developed an effective decision support system. It is better to continue media support, considering all learning from marketing mix modeling. Improvement of media plan after this research helps to increase traffic by 4%, and there is optimization of ROMI by 40%. Models’ construction and their support enable to maximize the influence of each media, which ultimately makes it possible to achieve the higher business results by the existing budget.
Media activity allows to maintain constant communication with consumers and increase traffic in short-term and long-term. Estimation of factor’s contribution forms a base for optimization of media strategy, media mix and media budget allocation by different aspects.
TV is the main media channel that ensures the growth of offline and online traffic with the highest ROMI. It has the greatest capability for optimization due to relevant changes in media split by video durations, formats and periods of activity. Digital stimulates each traffic and is the number two channel in the media mix with significant potential for amplification. OOH and Radio provide an opportunity to increase the contact’s frequency and attract a new audience to retail stores. Competitor activity has negligible impact on traffic. During the holidays, the category drives general demand: it is suggested to realize a strategy of optimal reach.
The proposed concept was tested at one of the Ukrainian retailers before the full-scale Russian invasion of Ukraine, but the key findings of the research can be used in media planning of Ukrainian companies in period of recovery after war and international retail companies and other market categories, as consumer journey and the influence of marketing mix are quite similar to Ukraine in 2021 before the Russian aggression. Globalization, development of world trade and international marketing lead to the unification and emergence of similar approaches to solving typical business problems. Marketing mix modeling can describe the business results of each company depending on the elements of marketing mix and other market conditions, so the results can be used to further develop mathematical methodology in marketing and its application to solve actual problems of the global retail market.
The research insights demonstrate high efficiency for real business tasks and help to solve marketing and media issues on a daily basis. The proposed approach allows to achieve business goals in the most efficient way due to realization of marketing mix modeling. Besides, the developed framework of regional strategy selection facilitates to the formation of a strategic vision on a regional scale and improves the quality of a regional media strategy. Moreover, in addition to constructed econometric models and regional analysis, information-analytical decision support system as an interactive dashboard has been developed for improvement of day-by-day business planning and management. Such system helps to increase the speed and quality of decision making for retail companies. As proof of concept, realization of these tools allowed to increase media efficiency and return on media investment by 40% for the Ukrainian company.
The main recommendations for media strategy conductive to maximizing efficiency are:
1. Continuity strategy with optimization of cumulative reach and parity SOV.
2. Concentration of activity on TV in the period from July to March, reducing activity in another period. Redistribution of activity during the week by the response to traffic.
3. The optimal weekly pressure is X TRPs, with increasing by up to 50% during the key promo.
4. Emphasis on video placement throughout the year. To increase traffic in the short term, it is relevant to maximize placement with short versions of the video, but connect image communication for long-term growth.
5. Expansion of presence in Digital to build a wide coverage of the TA. Using the OOH and Radio for an additional frequency of contact with the TA. The OOH is useful to increase pressure in the cities of presence. Radio is advisable for promotional activities in high season.
In case of regular support of marketing mix modeling there is the opportunity to determine business tasks depending on different time intervals. The main weekly tasks are forecasting of business KPIs, reporting, fast response to any changes and risks in order to manage business results. The key monthly tasks are monitoring the implementation of sales and traffic plans, tracking the dynamics of all indicators, forming recommendations based on the current situation. Main quarterly tasks are media placement strategy, considering minimizing costs while achieving goals and maximizing efficiency; evaluating the effectiveness of previous campaigns. As a result, there are continuing process of business and media optimization for increasing of traffic and sales, improvement of brand’s position on the market and ROMI due to development and making effective solutions about business development strategy.
The areas for improvement, as directions of future researches, are overcoming the limitations of the current study, which contain the possibilities to include additional data (for example, competitor’s nonmedia activity), testing hypotheses about the efficiency of different communications on traffic and turnover for different categories of goods, building additional models for target metrics across the sales funnel and delving into regional aspects of business development and media strategy optimization for all regions of presence. Moreover, future research areas include the implementation of other machine learning technologies (in particular, clustering and classification models for consumer segmentation and optimization of advertising communication). This will help to find new hidden insights that help to develop new effective solutions and improve business results.
Arkhipova, T. (2009). Mechanism of optimization of advertising information channels. Marketing: theory and practice: Formation of the market economy, Kyiv: KNEU, pp. 445-460.
Cain, P. (2021). Modelling short and long-term marketing effects in the consumer purchase journey. International Journal of Research in Marketing, 39(1), 96–116. https://doi.org/10.1016/j.ijresmar.2021.06.006
Chantayarkul, A., Ayuthaya, S., Kiattisin, S. (2020). The Marketing Strategy for Enhancing the Competitiveness of Local Traditional Stores in Thailand. 59th Annual Conference of the Society of Instrument and Control Engineers of Japan, SICE 2020, pp. 602-607.
Chenavaz, R., Feichtinger, G., Hartl, R., Kort, P. (2020). Modeling the impact of product quality on dynamic pricing and advertising policies. European Journal of Operational Research, 284(3), 990–1001. https://doi.org/10.1016/j.ejor.2020.01.035
Chernyak, O., Fareniuk, Y. (2020). Modeling of Effectiveness of Media Investment Based on Data Science Technologies for Ukrainian Bank. CEUR Workshop Proceedings, 2732, 282–289.
Chornous, G., Fareniuk, Y. (2021). Marketing mix modeling for pharmaceutical companies on the basis of data science technologies. Access to science, business, innovation in digital economy, ACCESS Press, 2(3), 274–289. https://doi.org/10.46656/access.2021.2.3(6)
Dash, M., Sharma, K. (2019). Marketing Response Modelling: Impact of Digital Marketing for a Luxury Car Brand. Journal of Creative Communications, 14 (3), 254–270. https://doi.org/10.1177/0973258619878077
De Pelsmacker, P., Dens, N., Goos, P., Aleksandrovs, L. (2021). How brand interest mediates the relationship between cross-media investments and word-of-mouth and purchase intention: a mixture-amount moderated mediation model. The Routledge Companion to Marketing Research, pp. 289–305.
Deart, V., Mankov, V., Krasnova, I. (2022). Traffic Flows Forecasting Based on Machine Learning. International Journal of Embedded and Real-Time Communication Systems, 13(1), 1–19. https://doi.org/10.4018/IJERTCS.289198
Grosul, V., Askerov, T. (2019). Modelling of a dynamic adaptation system of a retail enterprise. Včenì Zapiski Tavrìjsʹkogo Nacìonalʹnogo Unìversitetu Ìmenì V.Ì. Vernadsʹkogo, 4(69). https://doi.org/10.32838/2523-4803/69-4-11
Ghanem, S., Hamid, N. (2020). The Effect of Facebook, WhatsApp, Twitter and Email on SMEs Performance: Empirical Evidence from United Arab Emirates. IBIMA Business Review. https://doi.org/10.5171/2020.618899
Haudi, Santamoko, R., Rachman, A., Surono, Y., Mappedeceng, R., Musnaini, Wijoyo, H. (2022). The effects of social media marketing, store environment, sales promotion and perceived value on consumer purchase decisions in small market. International Journal of Data and Network Science, 6(1), 67–72. https://doi.org/10.5267/J.IJDNS.2021.10.003
Huseynov, F., Özkan Yıldırım, S. (2019). Online Consumer Typologies and Their Shopping Behaviors in B2C E-Commerce Platforms. SAGE Open, 9(2). https://doi.org/10.1177/2158244019854639
Ibrahim, E., Harrison, T. (2020). The impact of internal, external, and competitor factors on marketing strategy performance. Journal of Strategic Marketing, 28(7), 639–658. https://doi.org/10.1080/0965254X.2019.1609571
Internal database of Ukrainian bank (Confidential data).
Issock Issock, P., Mpinganjira, M., Roberts-Lombard, M. (2021). Investigating the relevance of the traditional marketing mix across different stages of change: empirical evidence from household recycling. Journal of Social Marketing, 11(4), 489–506. https://doi.org/10.1108/JSOCM-11-2020-0221
Kakalejčík, L., Bucko, J., Resende, P. (2021). Multichannel Marketing Attribution Using Markov Chains for E-Commerce. Statistika, 101(2), 142–158.
Kamena, R. (2021). Moving towards inferential attribution modelling in a world without third-party cookies. Applied Marketing Analytics, 7(2), 122–130.
Kengpol, A., Pichitkarnkar, T., Elfvengren, K. (2022). A decision support system for consumer behavior of chinese in-bound tourists on functional beverage: an empirical study during COVID-19 with Thailand sandbox. Applied Science and Engineering Progress, 15(1). https://doi.org/10.14416/j.asep.2021.09.001
Kumar, A., Shankar, R., Aljohani, N. (2020). A big data driven framework for demand-driven forecasting with effects of marketing-mix variables. Industrial Marketing Management, 90, 493–507. https://doi.org/10.1016/j.indmarman.2019.05.003
Kusumawati, R., Oswari, T., Yusnitasari, T., Mittal, S., Kumar, V. (2021). Impact of marketing-mix, culture and experience as moderator to purchase intention and purchase decision for online music product in Indonesia. International Journal of Business Innovation and Research, 25(4), 475–495. https://doi.org/10.1504/ijbir.2021.117089
Legendre, T., Cartier, E., Warnick, R. (2020). The impact of brand experience on the memory formation, Marketing Intelligence and Planning, 38(1), 15–31. https://doi.org/10.1108/MIP-02-2019-0109
Li, W., Yang, C., Jabari, S. (2022). Nonlinear Traffic Prediction as a Matrix Completion Problem with Ensemble Learning. Transportation Science, 56(1), 52–78. https://doi.org/10.1287/trsc.2021.1086
Liu, Y. (2021). Marketing mix plus digital platform innovation in pharmaceutical industry: where we are and how to move forward under COVID-19. Proceedings of the 30th International Conference of the International Association for Management of Technology, 2021 - MOT for the World of the Future, 991–1002. https://doi.org/10.52202/060557-0076
Méndez-Suárez, M. (2021). Marketing mix modeling using PLS-SEM, bootstrapping the model coefficients. Mathematics, 9(15). https://doi.org/10.3390/math9151832.
Mensah, K., Amenuvor, F. (2021). The influence of marketing communications strategy on consumer purchasing behaviour in the financial services industry in an emerging economy. Journal of Financial Services Marketing, 27, 190–205 https://doi.org/10.1057/s41264-021-00121-0
Mukherjee, S., Shivani, S. (2016). Marketing mix influence on service brand equity and its dimensions. Vision, 20(1), 9–23. https://doi.org/10.1177/0972262916628936
Najafi-Ghobadi, S., Bagherinejad, J., Taleizadeh, A. (2021). Modeling the diffusion of generation products in the presence of heterogeneous strategic customers for determining optimal marketing-mix strategies. Computers and Industrial Engineering, 160. https://doi.org/10.1016/j.cie.2021.107606
Podskrebko, O., Garnazhenko, O. Kurochkin, D. (2019). Modeling of the system functioning of a trading company. Efektyvna ekonomika, 11. https://doi.org/10.32702/2307-2105-2019.11.56
Sadikoglu, G., Saner, T. (2019). Fuzzy logic based modelling of decision buying process. Advances in Intelligent Systems and Computing, 896, 185–194. https://doi.org/10.1007/978-3-030-04164-9_26
Shi, X. (2021). The Application of Machine Learning in Online Purchasing Intention Prediction. ACM International Conference Proceeding Series, 21–29. https://doi.org/10.1145/3469968.3469972
Smith, T. (2021). Normative decomposition of the profit bridge into the impact of changes in marketing variables. Journal of Revenue and Pricing Management, 20(5), 530–545. https://doi.org/10.1057/s41272-020-00278-8
Sriram, K., Phouzder, K., Mathew, A., Hungund, S. (2019). Does e-marketing mix influence brand loyalty and popularity of e-commerce websites? ABAC Journal, 39(2), 64–81.
Supawan, P., Deebhijarn, S. (2020). Factors affecting business performance of thai restaurants in the United Kingdom: a structural equation model. Asia-Pacific Social Science Review, 20(2), 22–28.
Suttikun, C., Yuan, J. (2020). A model of marketing strategies and pull motivations influencing young consumers to visit day spas. e-Review of Tourism Research, 17(6), 865–899.
Voronko-Nevidnycha, T., Kalyuzhna, Y., Khurdei V. (2018). Advertising and advertising activity, Poltava, RVV PDAA, 230 p.
Wacker, J., Samson, D. (2021). Beyond supply chain management: jointly optimising operations / supply and the marketing mix. Operations Management Research, 14(3-4), 451–466. https://doi.org/10.1007/s12063-021-00218-8
Website of Nielsen Ukraine, https://www.nielsen.com/ua/uk/.
Woodley, M. (2021). Decoupling the individual effects of multiple marketing channels with state space models. Journal of Revenue and Pricing Management, 20(3), 248–255. https://doi.org/10.1057/s41272-021-00310-5
Yan, H., Zhang, T., Qi, Y., Yu, D. (2022). Short-term traffic flow prediction based on a hybrid optimization algorithm. Applied Mathematical Modelling, 102, 385–404. https://doi.org/10.1016/j.apm.2021.09.040