Ekonomika ISSN 1392-1258 eISSN 2424-6166
2022, vol. 101(2), pp. 125–145 DOI: https://doi.org/10.15388/Ekon.2022.101.2.8
Time-Varying and Quantile-Based Relationship among Geopolitical Risks, Oil, and Gold Prices*
Erkan Kara
Necmettin Erbakan University, Faculty of Applied Sciences,
Department of Accounting and Finance, Turkey
Email: ekara@erbakan.edu.tr,
ORCID ID: 0000-0001-7228-0396
Remzi Gök**
Dicle University, Department of Business Administration, Diyarbakır, Turkey,
Email: remzi.gok@dicle.edu.tr,
ORCID ID: 0000-0002-9216-5210
Abstract. This paper probes the relationship between geopolitical risks (GPR), WTI oil, and gold prices utilizing the time-varying causality and quantile regression approaches. The sample period spans from January 1986 to January 2022, comprising 433 monthly observations and representing the longest common period of data availability. The results show that there is no causality between the pairs of GPR–WTI, and GPR–gold prices for the full sample period, while the causality between gold and WTI is unidirectional, running from gold to WTI. Using the rolling causality test, however, the findings show that the dynamic causal relations strengthen over time. The Granger causality from the gold prices to GPR and WTI is stronger than the other way around, suggesting that the gold market dominates the other two variables in terms of strength of the lead-lag structure of causality. Besides, the findings reveal the strongest causation effects between GPR and WTI spot prices. Before 2009, the causal relationship between WTI and GPR is mostly unidirectional while also a bidirectional linkage emerges, coinciding with the crisis periods including the Dot-Com and 2007 US Subprime crises. During the causal periods, these variables respond negatively to changes in others. For the COVID19 period, the direction of causality considerably changes in favor of WTI for the GPR–WTI pair whereas it is unchanged for the WTI–gold pair. The results indicate that WTI has positive and negative predictive powers for GPR and gold while it receives negative and positive causation effects from GPR and gold during the pandemic, respectively. The results, in overall, may offer important insights for investors and regulatory authorities in building portfolio and risk management strategies as well as pricing and trading activities and constructing monetary policies over various market conditions.
Keywords: Time-varying causality, GPR, WTI, Gold, Quantile-regression.
___________
* This paper is the extended version of the summary paper presented at the “IERFM’22 VI. International Economic Research and Financial Markets Congress” held in Konya, Turkey on May 2022
** Corresponding author.
Received: 07/06/2022. Revised: 09/10/2022. Accepted: 02/11/2022
Copyright © 2022 Erkan Kara, Remzi Gökb. Published by Vilnius University Press. This is an Open Access article distributed under the terms of the Creative Commons Attribution License, which permits unrestricted use, distribution, and reproduction in any medium, provided the original author and source are credited.
1. Introduction
Oil and gold are among the most traded commodities in commodity markets1. Since their demands are common worldwide, the price of these two commodities is much more prone to global economic and political changes. Though, the degree of demand for the two differs at some point. Oil is a necessity for energy use and hence it must be used to continue business and life. However, on the other hand, gold is used and demanded mainly for two purposes. First, gold is used as an accessory for luxury and scientific reasons, and second, it is demanded as means of exchange since old ages (Sujit and Kumar, 2011) and investment perseverance. Gold is mostly perceived to be invested against inflation concerns and political instability reasons. For instance, the surge in gold prices at the beginning of 2022 first started with inflation concerns due to pandemic events and is now coupled with the ongoing invasion of Ukraine by Russia. Not unlike gold, oil prices are also much disposed to economic instability. There are numerous reasons and political events that change oil prices over the last century. With the invention of the fossil fuel engine, oil has become a crucial part of energy since the beginning of the twentieth century. Ever since oil usage has become a central commodity for energy, and hence, this commodity is likely affected by political actions and by the state of the economic cycles. On the other hand, change in oil prices further send shocks to economies to falter. For instance, Hamilton (1983) argues that one of the biggest factors that caused the United States economy into recession since World War II between the years of 1948 and 1972 is oil price shocks. Additionally, Wang et al. (2021) claim that there are three major oil crises triggered by geopolitical risks in the middle east that disturbed the economic growth of developed countries such as the US, Germany, and France. Even, recent news from Bloomberg2 suggests that commodities such as wheat supply may cause food shortages in poor countries which in effect cause political instability in those countries as a result of the current conflict between Russia and Ukraine. Because, the rising oil prices are one of the main sources of food price inflation as the input, for example, fertilizer, and energy used in agriculture.
Geopolitical risk is a common factor that is thought to be one of the main drivers of commodity prices such as oil and gold. For this reason, many academics and decision-makers particularly looked at the effects of geopolitical risk on oil prices (Diamonte et al. (1996), Dibooğlu and Aleisa (2004), Bhar and Malliaris (2011), Caldara and Iacoviello (2018), Wang et al. (2021) and on gold prices (Baur and Smales (2018), Gkillas et al. (2020b), Triki and Maatoug (2021), and Li et al. (2021a)). Among these, Caldara and Iacoviello (2018) constructed a geopolitical risk index (GPR) that comprises regional and global events that affect not only oil and gold markets but also real economic activities and capital flows around the world. The GPR index indicates that high geopolitical risks lead to a fall in equities, real economic output, and capital outflow from emerging countries. The countries that are more vulnerable to political risks are said to be emerging economies and this vulnerability has also increased in the developed economy in recent years (Diamonte et al., 1996). Likewise, oil exporters, such as countries like Saudi Arabia whose revenues are more dependent on oil will likely suffer from political and economic actions (Dibooğlu and Aleisa, 2004). Furthermore, Noguera-Santaella (2016) gathered more detailed information on 32 conflicts from 1859 to see their effect on oil prices and volatility. While oil prices were affected by geopolitical events before the 2000s, there little effect since then.
Since 1986, as this study’s data start, several major events drive oil and gold prices. Nevertheless, it is known that there are dramatic major episodes that not only devastated the price stability of oil markets but also sent economic and financial markets into shocks around the world. Within the sample period, the first oil shock was seen in 1990, when the crisis in the Persian Gulf erupted, and the oil prices doubled in a year as a result of oil export disruption (Hutchison, 1991). The author connected higher oil prices to inflationary pressure in the second half of 1990. Before the 2008 global financial crisis, oil prices were rising as this was thought to be due to increasing economic activities which triggered more oil demand (Bhar and Malliaris, 2011), especially the fast economic growing China and India (Krugman, 2008) and hence oil prices shoot up to record levels that were not seen before. At the beginning of 2008, a barrel of Brent oil reached as high as 147 US dollars. Bhar and Malliaris (2011) explain these record levels of oil by arguing that as the US Dollar lost value against Euro and gold, oil exporters were demanding compensation to cover real revenues which in turn increased oil prices to record levels. In the post-2008 global financial crisis, as economies contracted severely, commodity markets tumbled (Chan et al., 2011) together with oil prices. In 2008, oil prices fell to as low as 30 US dollars per barrel, or 80% down from their previous peak (Joo et al., 2020).
Even though the run-up to recording oil prices in the 2000s is related mainly to economic cycles rather than political risk uncertainties, the events of Arap Springs arose to directly affect oil and gas markets. Oil prices surged at end of 2010 when political turbulence emerged as a result of dissatisfaction with the economic situation among the citizens across North African countries and these incidents took about three years. El-Katiri et al. (2014) investigated this event and its effect on the Middle East and North African (MENA) countries’ oil and gas markets. The authors suggest that once the events erupt, the experts around the world were anticipating the oil price reaction to these events may be greater. However, the authors found that the price reaction was not extreme as it was thought; this is partly due to the containment of the events being only limited to MENA countries and did not spread to Gulf countries.
The objective of this paper is to see the relationship between geopolitical risks, oil, and gold prices. To understand and use geopolitical risk as a risk measure, it is best to use the GPR index of Caldara and Iacovielloz (2021). As stated by Huang et al. (2021a), the GPR index has unique geopolitical characteristics compared to other traditional uncertainty indices such as the Economic Policy Uncertainty Index (EPU), the World Uncertainty Index (WUI, quarterly GDP-based), the Global Economic Policy Uncertainty Index (GEPU, GDP-weighted average of national EPU indices for 21 countries), VIX, Equity market volatility (EMV), Oil implied volatility index (OVX).
Although many studies have analyzed the impact of GPR on oil prices, few have sufficiently considered dynamic bidirectional causality between GPR and oil prices, especially the reverse-causal effect of oil prices on levels of GPR. Moreover, most have ignored the dynamic interactions between GPR and oil prices, especially the nonlinear and time-varying characteristics. Previous studies investigating the link between various uncertainty indicators and oil prices have mainly used a linear framework while ignoring possible nonlinear mechanisms (Mei et al., 2019; Uddin et al., 2018). Since the relationship between oil prices and external shocks may present nonlinear characteristics as a result of structural changes triggered by major events (Li et al., 2021b), and the oil market has entered a period of high fluctuation (Qin et al., 2020), the expected causality may change over time. Therefore, this study aims to fill a gap in the literature by examining the relationship between GPR and oil prices from a time-varying nonlinear perspective. The data consist of the economic and financial crisis, geopolitical tensions, and the ongoing pandemic. The findings show that, for the full sample, no causality exists between the pairs of GPR–WTI and GPR–gold prices, but, a unidirectional causation effect from gold to oil prices arises. The time-varying results reveal strong and significant causal linkages over time and that the gold market dominates oil and GPR. During crisis periods, the effect is mostly negative and causality is unidirectional. Further, WTI exhibits positive and negative predictive powers for GPR and gold but receives reverse causal flows from two variables during the COVID-19 pandemic, respectively.
This paper proceeds as follows. The following section introduces literature on this issue. Section 3 describes the method applied. Empirical results are discussed in Section 4. The last section concludes the paper with some policy implications.
2. Literature Review
A large number of papers have investigated the relationship between oil, gold, and other precious metals can be seen in the literature. Generally, the literature focuses on geopolitical risks and their effect on several crucial commodities such as oil, gold, and some other metals. As this paper focuses on the linkage between the geopolitical risks index, oil, and gold brief literature has been given.
One of the most important papers that initiated an index that has been extensively used in the literature subsequently is the work of Caldara and Iacoviello (2018) in which the authors constructed an index of geopolitical risks. Their index includes wars, tensions between countries, and terrorism—since 1985 and it reflects automated text-search results of the electronic archives of the English-speaking press (10 newspapers) published in the U.S., UK, and Canada. They used the newly constructed geopolitical risk index (GPR) to see its relationship with the economic activities of 17 developed countries using panel data analysis. For example, their results suggest that when GPR increases stock prices were affected negatively and capital flows go to more safe haven countries from emerging economies.
Triki and Maatoug (2021) used the GPR index to find the relationship between the US stock market returns and gold prices when geopolitical risk exists for the period 1985–2018. When running the multivariate GARCH model and Copula Approach for the series, they found that there is negative spillover volatility from US stock markets to gold prices when geopolitical risks arise. Similarly, Li et al. (2021a) choose the GPR index to see the spillover effects of geopolitical risks on gold prices for 18 emerging economies using panel analysis. While they found a significant spillover effect from geopolitical risks to oil prices for those countries, when using rolling-windows analysis, the spillover effect is an increasing trend. In a similar timespan, via quantile regression analysis, Das et al. (2019) argues that when geopolitical risks arise, stock volatility increases, and precious metals like gold are viewed to be a good hedging instrument to reduce risks and variations in portfolio returns. In their paper, Gkillas et al. (2020b) likewise used the quantile-regression heterogeneous autoregressive realized volatility (QR-HAR-RV) model to see the linkage between gold return and geopolitical risks when using daily observation and geopolitical risk index of Caldara and Iacoviello (2018). Their results suggest that the predictive power of geopolitical risks is greater for gold return volatility.
Huang et al. (2021b) investigate the causal relationship between gold returns and geopolitical risks by daily data between 2000 and 2017 using the methodology of the nonparametric causality-in-quantiles approach. Their findings suggest that geopolitical risks have a greater role in the volatility of gold prices rather than gold returns. The authors further claim that the causation of geopolitical risks to gold volatility is strong when the markets are in bear and normal conditions.
Baur and Smales (2018) investigated the relationship between gold and geopolitical risks. Using OLS regression analysis, the authors find that gold price returns positively react to changes in geopolitical risks and further claim that gold is exceptional in this case when compared to other similar assets.
On the other hand, Yıldırım et al. (2020) examine the linkage between not only oil and gold but also other precious metals like silver, platinum, and palladium employing the causality-in-variance test method. The authors’ empirical findings suggest that there is causality-in-mean relation going from the oil price changes to precious metal price changes and they also find a volatility spillover effect from the oil market to the precious metal market according to the causality-in-variance test results.
To see the relationship between spot and future prices of oil and gold, Balcilar et al. (2019) evaluates a different methodology of the rolling and recursive rolling Granger causality on a time-varying basis. While the authors believe that there is no strong causality between the variables, the causality connection between the two variables shows strong time variation. They additionally find that the length of causality fluctuates from several months to 3 years and the non-causality period may extend up to 15 years.
Geopolitical risks as well as political uncertainty and their relation to precious metals were examined by Yilanci and Kilci (2021) by using a time-varying bootstrap causality test. Their results propose that geopolitical risk does not cause precious metal prices. However, except for gold prices, there is a causal flow from economic policy uncertainty to other metal prices, indicating that the causality effect is hidden in subperiods.
3. Methodology
To find the relation between the geopolitical risk index, WTI oil, and gold prices, this paper utilizes the rolling causality of by Balcilar et al. (2010) and rolling quantile regression method proposed by Koenker and Bassett (1978). The rationale behind the selecting the first method is that the causality testing with the linear framework may be misspecified in the case of existence of structural breaks, parameter instability, and nonlinearity, given that this issue prompts the use of rolling and nonparametric approaches. In fact, there may not be a permanent causal flow between markets over the entire period, but hidden over the subsamples and corresponds to financial and economic events. Besides, it is not sensitive to the order of integration or the (non)existence of cointegration and allows measuring the asymmetric effects on the causal relationship. To estimate the nonlinear effects of the explanatory series on the dependent series over different quantiles, i.e. the low, medium, and high return (volatility) states, this paper conducts the quantile regression approach, since it is an extension of the ordinary least squared regression and robust against outliers, heterogeneity, and skewness for the dependent variable, hence provide more accurate results than the standard regressions.
Balcılar et al. (2010) suggest that asymptotic properties of test statistics of Likelihood ratio and Lagrange multiplier test a VAR system may not be standard when applying to Granger causality test. Further, Balcılar et al. (2010) state that the problems with this issue have been coming forth by the works of Park and Phillips (1989), Toda, and Phillips (1993, 1994). For this reason, Toda and Yamamoto (1995) and Dolado and Lütkepohl (1996) offer a new approach to standardizing asymptotic properties in a VAR system in which the variables are integrated of order (1). However, as Balcılar et al. (2010) points out, the Wald test statistics have problems in size for small and medium-sized samples. Hence, the critical values of the test, as suggested by Shukur and Mantalos (1997), can be improved using the residual-based bootstrap technique.
Bootstrap LR Granger causality equation can be shown in the following equation
 , t=1,2, …. ,T (1)
where, εt indicate the white noise process. The lag length is determined by using Akaike Information Criterion (AIC). To simplify yt, the authors divided this into two sub-vectors to represent two independent variables used in their work, i.e. energy consumption y1t and GDP y2t, and the following equation is written:
 (2)
(2)
In equation (2),  is the lag operator which is defined as
 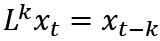 . The null hypothesis of this model is there is no Granger causation between the variables under the restriction of ϕij = 0 for i = 1, 2, …, p.
Balcılar et al. (2010) uses residual-based modified-LR tests to see the causality between energy consumption and GDP. However, the authors suggest that due to structural changes and regime shifts in sample periods, the parameter of the VAR model may not be stable and the Granger causality test may be sensitive to the sample period and as a result inference may have conflicting results. To achieve the stability of the model, Balcılar et al. (2010) suggest the rolling window regression technique which is based on a differing subsample of a fixed length that moves in order from the beginning of the sample to the end of the period. In each step, the authors define a VAR model and implement bootstrap causality tests. The authors justify this with two reasoning. The first is that fixed windows rolling estimation will allow the system to be changing over time. And second, they argue that this technique will solve the issue of sub-sample instability by taking into account the sequence of the number of sub-sample periods.
In addition to the causality test, the authors examined the relationship between the geopolitical risk index for the pair of oil and gold prices by using quantile regression analysis. The authors’ favor is similar to the view of Coad and Rao (2006), who note that in the case of skewness and non-normality quantile regression model may produce better results than the classical regression model as the latter assumes the variable should not be skewed and non-normal distribution. Hence, this paper uses Koenker and Bassett’s (1978) quantile regression technique (for details, please see the paper of Koenker and Bassett (1978)).
4. Data and Empirical Results
4.1. Data
For this paper, the monthly average data from January 1986 to January 2022, comprising 433 monthly observations of the geopolitical risk index (GPR), WTI crude oil spot price FOB (dollars per barrel, Cushing, Oklahoma), and spot price of gold per ounce (reference prices obtained from the London Bullion Market Association and Shanghai Gold Exchange) quoted in US Dollar are considered. The recent GPR index is constructed by Caldara and Iacoviello (2021) as a measure of adverse geopolitical events— including wars, tensions between states, and terrorism—since 1985 and it reflects automated text-search results of the electronic archives of the English-speaking press (10 newspapers) published in the U.S., UK, and Canada. They calculate the index by counting the number of articles regarding adverse geopolitical events in each newspaper for each month and then dividing it by the total number of news articles. An increase (decrease) in the index indicates lower (higher) investment, employment rates, and equity prices. This index is obtained from https://www.matteoiacoviello.com while the spot prices of crude oil and gold are available on the webpage of the U.S. Energy Information Administration and the World Gold Council.
4.2. Empirical Results
As it is common practice, each series is transformed into its natural logarithms to avoid the potential heteroscedasticity and reduce correlations among the variables. Table 1 provides the descriptive statistics per variable in terms of the rate of change for the GPR and log return for the WTI and gold prices.
Table 1. Descriptive Statistics
|
|
D(GPR) |
D(WTI) |
D(GOLD) |
|
Mean |
0.0038 |
0.2984 |
0.3842 |
|
Maximum |
216.10 [2001M09] |
39.59 [2020M05] |
15.83 [1999M10] |
|
Minimum |
-76.79 [1991M03] |
-54.84 [2020M03] |
-12.27 [2006M06] |
|
SD |
23.5694 |
9.5242 |
3.4661 |
|
Skewness |
2.14*** |
-0.74*** |
0.37*** |
|
Kurtosis |
17.11*** |
5.06*** |
1.35*** |
|
JB |
5595.36*** |
500.2*** |
42.27*** |
|
N |
432 |
432 |
432 |
Note: “m” is the embedding dimension. *** indicates the rejection of the null hypothesis at a 1% significance level, based on the bootstrapped p-values, computed with 10000 repetitions. Values in the cells and brackets are BDS z-statistic and the optimal lag length (AIC) of VAR models.
Table 1 shows that D(GPR) has an average value of close to zero, whereas gold returns exhibit a larger average positive value than oil returns. The GPR index reveals the highest and lowest monthly change in September 2001 and March 1991, corresponding to the 9/11 terrorist attacks and the Gulf war, respectively. The largest positive and negative values for D(WTI) occur during the onset of the COVID-19 pandemic in 2020. However, the maximum and minimum gold returns are observed in October 1999 and June 2006, coinciding with the political tensions arising from the Middle East and with the selling out commodity positions by investors and speculators after gold prices peak at 730$ in May 2006. The standard deviation of D(GPR) is relatively highest, followed by the returns of WTI and gold prices. The changes in the GPR index show significantly positive skewness and excess kurtosis (leptokurtic) and exhibit deviation from normality at a 1% level of significance. D(WTI) and D(GOLD) are, respectively, skewed to the left and right with significantly positive kurtosis, refusing the hypothesis of normality.
Table 2. Unit root test results (Kapetanios, 2005) (Model C)
|
Log() |
Test Stat |
BP1 |
BP2 |
BP3 |
BP4 |
BP5 |
|
L(GPR) |
10.046*** |
Aug-01 |
May-03 |
May-06 |
Mar-09 |
Jan-20 |
|
L(WTI) |
5.727 |
Oct-87 |
Oct-90 |
Jul-14 |
Oct-17 |
Jan-20 |
|
L(GOLD) |
4.938 |
Feb-00 |
Aug-11 |
Dec-13 |
Dec-15 |
May-19 |
|
Return() |
||||||
|
D(GPR) |
16.414*** |
Sep-01 |
Jul-03 |
Jun-05 |
Mar-18 |
Dec-19 |
|
D(WTI) |
15.561*** |
Nov-98 |
May-14 |
Apr-16 |
May-18 |
Mar-20 |
|
D(GOLD) |
17.863*** |
Nov-87 |
Jul-11 |
Jun-13 |
Nov-15 |
Apr-19 |
Note: *** indicates the rejection of the null hypothesis against the alternative hypothesis up to m structural breaks at a 1% significance level.
Table 2 reports the results of the unit root test, allowing for up to five endogenous structural breaks against the null hypothesis of a unit root, proposed by Kapetanios (2005). Based on the results, it is found that logarithm of the GPR index is stationary in level, whereas others are found to be first-differenced stationary. Before causality testing, the cointegration test of Johansen (1991) is applied, and the results given in Table 3 reveal that gold and WTI prices are not cointegrated, as the p-values of both test of Trace and Max-Eigen are higher than 0.05, indicating that there is no a long-run equilibrium relationship between gold and oil markets and thus verifying the use of linear causality test.
Table 3. Johansen (1991) cointegration test results
|
Model |
Hyp. No. of CE(s) |
Eigenvalue |
Trace Test |
p-value |
Max-Eigen test |
p-value |
|
Gold ~ WTI
|
None |
0.0239 |
10.361 |
0.254 |
10.350 |
0.190 |
|
At most 1 |
2.45E-05 |
0.010 |
0.918 |
0.010 |
0.918 |
The LR statistics of the standard Toda-Yamamoto (1995) Granger causality test along with the bootstrap p-values are reported in Table 4 for the full-sample period. The results show that the null hypothesis cannot be rejected between GPR and WTI spot prices as the bootstrap p-value exceeds 0.10, suggesting the absence of a causality relationship. This is not consistent with the results of Huang et al. (2021a), which present evidence of nonlinear unidirectional causality from GPR to oil returns and nonlinear bidirectional causality between GPR and oil realized volatility at different lags. Additionally, Abdel-Latif and El-Gamal (2020) find bidirectional causalities amongst GPR, oil prices, and global financial liquidity, which contradict this paper’s findings. Similarly, no causality exists between GPR and gold prices and this result supports Huang et al. (2021b). However, the test detects a unidirectional causality from gold prices to WTI oil prices, rendering WTI prices predictable using the past information on gold prices. In line with this paper’s findings, Bampinas and Panagiotidis (2015) and Gkillas et al. (2020a) document bidirectional causality between gold and oil prices for the two subperiods (before and post the financial crisis) and the full sample and confirm a linear feedback mechanism between the realized volatility of oil and gold prices, respectively. Besides, Dutta et al. (2019) find a unidirectional symmetric causality from the changes in gold VIX to OVX as well as between the negative shocks and in the reverse direction between positive shocks and these results moderately confirm this paper’s findings. Conversely, in line with this paper’s results, Gharib et al. (2021) show no linear causality but a nonlinear causation impact from WTI returns to gold returns and argue that the reason behind the non-causality can be explained by the presence of explosiveness in two markets. However, the results differ from Yildirim et al. (2020), who used daily data and causality tests and showed that oil price returns Granger-cause not only the mean but also the volatility of gold returns. These different results vary depending on the methodology applied and the frequency of data.
Table 4. Toda–Yamamoto (1995) Granger Causality Test Results (Full Sample)
|
Null Hypothesis |
Lag (AIC) |
LR Statistic |
Boostrap p-value |
|
H0: L(GPR) ⇏ L(WTI) |
3 |
2.7358 |
0.4200 |
|
H0: L(WTI) ⇏ L(GPR) |
3 |
1.5683 |
0.7060 |
|
H0: L(GPR) ⇏ L(GOLD) |
3 |
5.7244 |
0.1140 |
|
H0: L(GOLD) ⇏ L(GPR) |
3 |
1.7434 |
0.6190 |
|
H0: L(WTI) ⇏ L(GOLD) |
4 |
4.3945 |
0.3500 |
|
H0: L(GOLD) ⇏ L(WTI) |
4 |
12.8117** |
0.0200 |
Note: ** indicates the rejection of the null hypothesis at a 5% significance level. The bootstrap p-values are obtained with 2500 replications.
Before proceeding further, it should be remarked that the full-sample findings in Table 4 assume the parameter constancy in the bivariate VAR system and the existence of only one causation impact over the whole period. However, as noted by Balcilar et al. (2010), one must take into account the integration order and cointegration of variables since it will affect the parameter stability and if parameters are not constant and VAR models include structural breaks, then the results would be inconsistent for the full sample causality testing. Accordingly, this paper probes whether the parameter is stable or not in the long—utilizing the LC test proposed by Nyblom (1989) and Hansen (1992)—, short-run— employing Andrews (1993), Andrews and Ploberger (1994) tests— for all cases and report the findings in Table 5. In the first step, the LC test for each equation using Hansen (1992) test is calculated and the results reveal that the null hypothesis that series are cointegrated is not rejected, confirming the findings of Johansen’s (1991) test. Further, Nyblom’s (1989) parameter stability test results suggest the rejection of the null hypothesis at the 5% significance level and show that parameters in the VAR system do not follow a random walk process. Taking together all results, the results show that there is no long-run parameter stability and cointegration between gold and WTI prices. In the second step, the short-run stability of parameters for all cases is estimated and the findings are reported in Panel A. The three tests of Sup-LR, Exp-LR, and Mean-LR are based on the sequence of Lagrange multiplier statistics and are utilized for hypothesis testing on the existence of structural change at a possible time, trimming 15% from both ends of the sample. The results of Sup-LR statistics provide evidence to reject the null hypothesis between GPR and WTI and for the GPR equation when gold is selected as the dependent variable, indicating the existence of regime shifts in the VAR models. The Exp-LR and Mean-LR tests show that the null hypothesis of parameter stability in the short-run can be rejected at conventional levels in four out of six models, indicating parameter instability in the WTI and GPR equations. For the GOLD equations, however, the parameters are found to be stable. Overall, these results indicate the suitability of studying the Granger causality relationship using a fixed window regression approach. To do so, the bootstrap subsample rolling-window Granger causality test is utilized, where the width of the fixed window is 24 months. The results are given in Figures 1–3.
Table 5. Parameter stability test results
|
IDV |
L(WTI) |
L(GPR) |
L(GOLD) |
L(GPR) |
L(WTI) |
L(GOLD |
|
DV |
L(GPR) |
L(WTI) |
L(GPR) |
L(GOLD) |
L(GOLD |
L(WTI) |
|
Panel (A): Short-run |
||||||
|
Sup-LR |
3.738* |
4.842** |
3.519 |
7.484*** |
3.087 |
2.503 |
|
Exp-LR |
1.227** |
0.941* |
0.787 |
1.124** |
0.929* |
0.794 |
|
Mean-LR |
2.36** |
1.771** |
1.438 |
1.922** |
1.801* |
1.552 |
|
Panel (B): Long-run |
||||||
|
Lc† for each equation |
0.1810 |
0.250 |
||||
|
Lc for system |
2.576** |
|||||
Note: ***, **, and * show the null hypothesis rejection at a 1%, 5%, and 10% significance level, respectively. IDV and DV are independent and dependent variables in each VAR model. We compute Lc test statistic for each equation and system using Hansen (1992) and Nyblom (1989) tests, respectively.
† Hansen (1992b) Parameter Instability → equation fmols_gpr_c_wti.cointreg(m=2500, regtrend=linear, lag=a, infosel=aic) aom_gpr aom_wti; Nyblom (1989) Parameter Stability Test → equation nyb_gold_c_wti.arch(1, 1) aom_gold aom_wti c; nyb_gold_c_wti.nyblom
In the upper panel, the LR statistics for the rolling causality test are reported and shaded the causality periods with green color while the bottom panel in Figure 1 reveals the magnitude of the causal impact. A visual inspection shows that the Granger causality from the geopolitical risk levels to WTI oil prices is stronger and lasts longer than the other way around, implying that GPR dominates the oil market in terms of duration and strength of causality and this result partially aligns with Cai and Menegaki (2020), who show that the geopolitical risk shocks have a higher spillover and positive effect on the crude oil exports than vice versa but find that the significant causality running from the crude oil import holds more pronouncedly than that from geopolitical risks to the crude oil import, with the crude oil imports being negatively affecting the geopolitical risks. The test detects 17 causal periods running from GPR to WTI, with a total duration of 80 months. Conversely, 20 causal periods are observed, where the null hypothesis that WTI does not Granger-cause GPR is strongly rejected at the 10% significance level. Before 2000, GPR levels unidirectionally Granger-cause WTI prices in the 1986–1987 subperiod, and the impact is negative. For the reverse direction, the findings reveal several short causality periods, lasting one or two months and affecting positively before 1993 and negatively the geopolitical risks from then until 2000. Additionally, WTI prices unidirectionally Granger-cause GPR during the periods of 1992M10–1992M12 and 1996M12–1997M04, where the effect is positive and negative, respectively. During the periods of 1996M03–1996M05 and 2000M12–2001M03, a bidirectional causality relationship emerges, where the impact is negative for both variables and is positive and negative from GPR and WTI, respectively. From February to December 2002 and from August to September 2003, GPR negatively causes WTI and caused by WTI from December 2004 to January 2005. The results show the largest-lasting causal period (22 months) from GPR to WTI, with mostly affecting negatively, from July 2005 to April 2007, coinciding with the energy crisis of 2003–2009. Between November 2005 and May 2006, the causality direction is bidirectional and the effect from GPR is mixed but is entirely negative from WTI prices. One month later, a strong causal effects emerges during the global financial crisis of 2007–2009, the second largest-lasting causal period with 17 months duration. GPR negatively causes WTI in July 2007, and the test detects a two-way causality relationship where the effect is negative and positive from GPR and WTI, respectively. Until July 2008, there is a negative causal impact from GPR to WTI, indicating that raising geopolitical risks leads to a decline in WTI prices. There are no causal periods until May 2013, however, the findings reveal a unidirectional causality from WTI to GPR between May and July 2013 and in September 2013, corresponding to the declaration of the ending of the cheap money period as of October 2013 by the Fed. Rising oil demand, falling oil supply due to political uncertainty in the Middle East as well as weakening US dollar are the main factors that led to increased oil prices and thereby cause a positive impact from WTI to geopolitical risks. The null hypothesis that GPR does not Granger-cause WTI is strongly rejected during the subperiods of 2013M12–2014M04, on June 2014, and on January, May, from July to September and on November in 2017. During those periods, the effect is negative; indicating that rising GPR levels may cause a decline—driven by the oversupply in the US and the production reductions decisions by some OPEC countries—in oil prices, in 2017. During the COVID19 period, a long and short unidirectional causal periods is observed, running from WTI prices to GPR levels and in the reverse direction during the subperiods of 2020M07–2021M05 and 2021M11–2022M01, respectively. The findings indicate that WTI (GPR) had positive (negative) predictive power for GPR (WTI) during the pandemic as the rising oil demand and oil production reduction agreement between Russia-Saudi Arabia in the summer of 2020 lead to an increase in oil prices and this exhibit a positive but limited impact on geopolitical risk levels during the first subperiod. The rationale behind the highest negative and causal impact from GPR to WTI is the increasing of geopolitical risk levels due to the fear of Omicron variant and thereby decreasing oil demand and prices during the second subperiod in the last months of 2021 and first month of 2020.
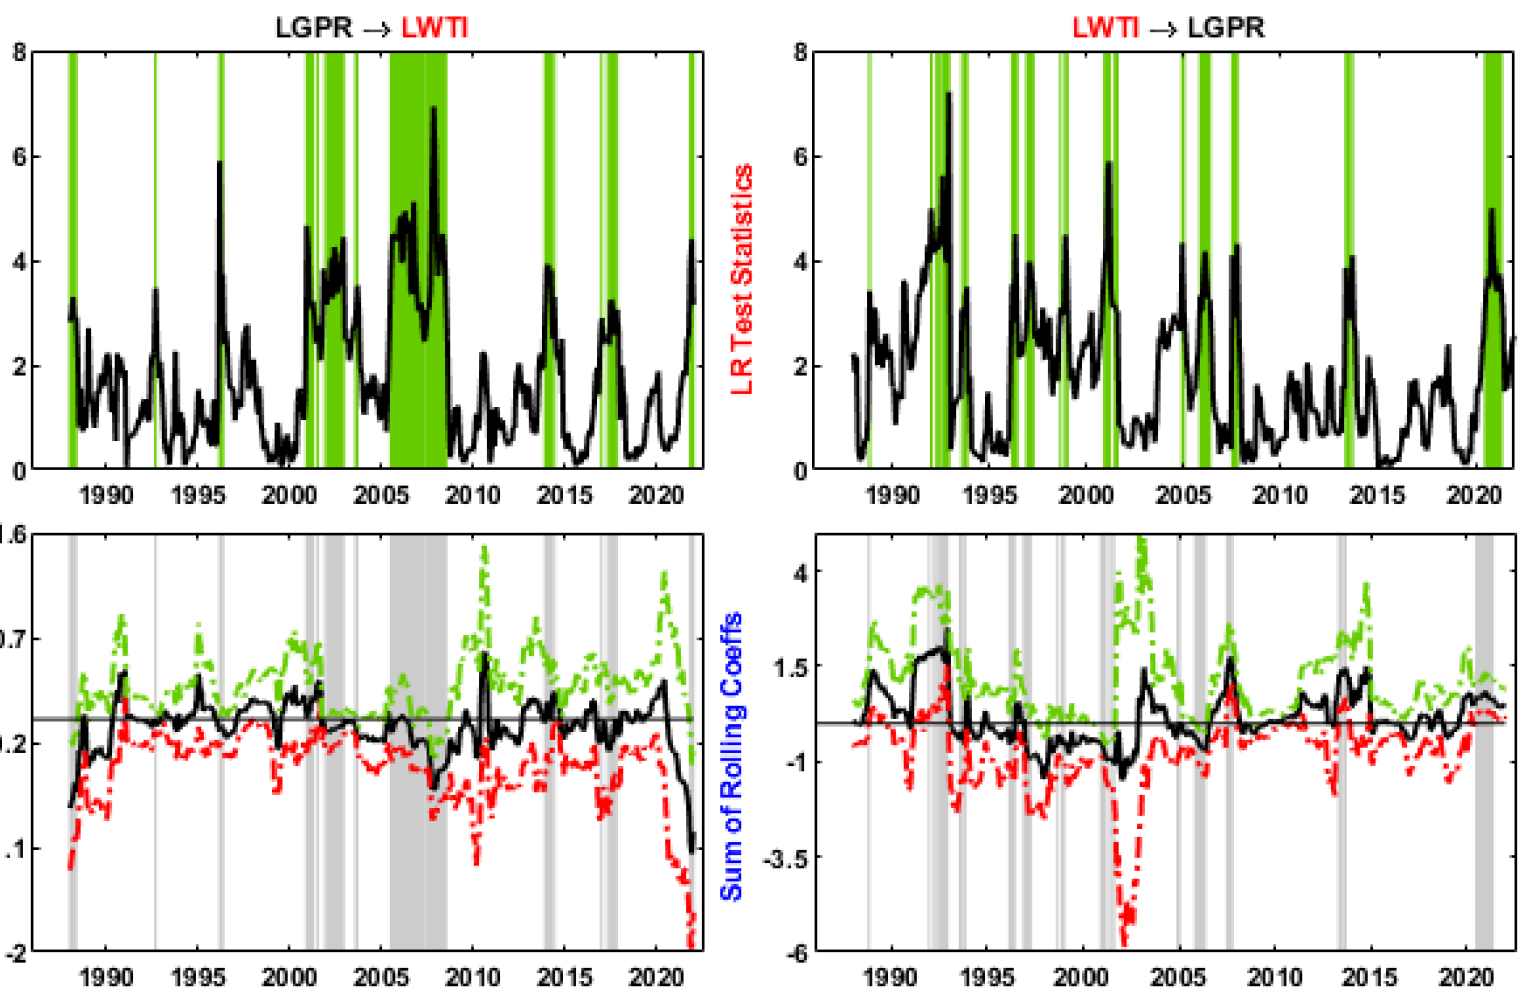
Figure 1. Rolling window estimation results between GPR and WTI
Figure 2 exhibits the result of the rolling causal linkage and the magnitude of the impact between gold and GPR variables. The results display a stronger and longer causal impact from the gold prices to the geopolitical risk levels than the other way around. The results show a unilateral causality from GPR to gold prices during the subperiods of 1989M02–1989M04, 1989M06–1989M07, and 1993M05–1993M06, where the effect is positive, indicating that as the geopolitical risk level increases then gold prices surge up. The null hypothesis for the reverse direction is strongly rejected during the second half of 1992 when gold prices negatively affect the geopolitical risk levels. From May to June 1993, GPR positively Granger-causes gold prices, while the effect is negative in the 1996M09–1996M11 subperiod. The causality turns out to be unidirectional from gold prices to GPR between 1997 and 1998, where the impact is positive from July to August and December in 1997 and negative from June to October and December in 1998, coinciding with the Asian and Russian financial crises, respectively. In October 1999, the causality is bidirectional, albeit the effect is negative from GPR and positive from gold prices. The test reveals that GPR has negative predictive power for gold prices from 1999M10–2000M04, coinciding with the Dotcom crisis period in the U.S., in March 2013, June 2015, and April 2020 during the Saudi Arabia–Russia oil price war. Besides, the findings discover a positive and unidirectional causality from GPR to gold during the 2001M09–2001M10, coinciding with the 9/11 terrorist attack on the US. Conversely, a negative causality running from gold prices to GPR emerges during the recent global financial crisis. During the European sovereign debt crisis, however, gold prices Granger-cause GPR and the impact is positive. Similarly, there is a short causal period (negative and positive) running from gold to GPR during the first four months of 2015 and in February 2019, exerting a positive impact on GPR levels. The causation periods hardly coincide with the finding from Yilanci and Kilci (2021), who investigate the causation impacts from geopolitical risk on several prices of precious metals and find numerous short causal periods for GPR↛Gold estimation.
Figure 2. Rolling window estimation results between GPR and GOLD
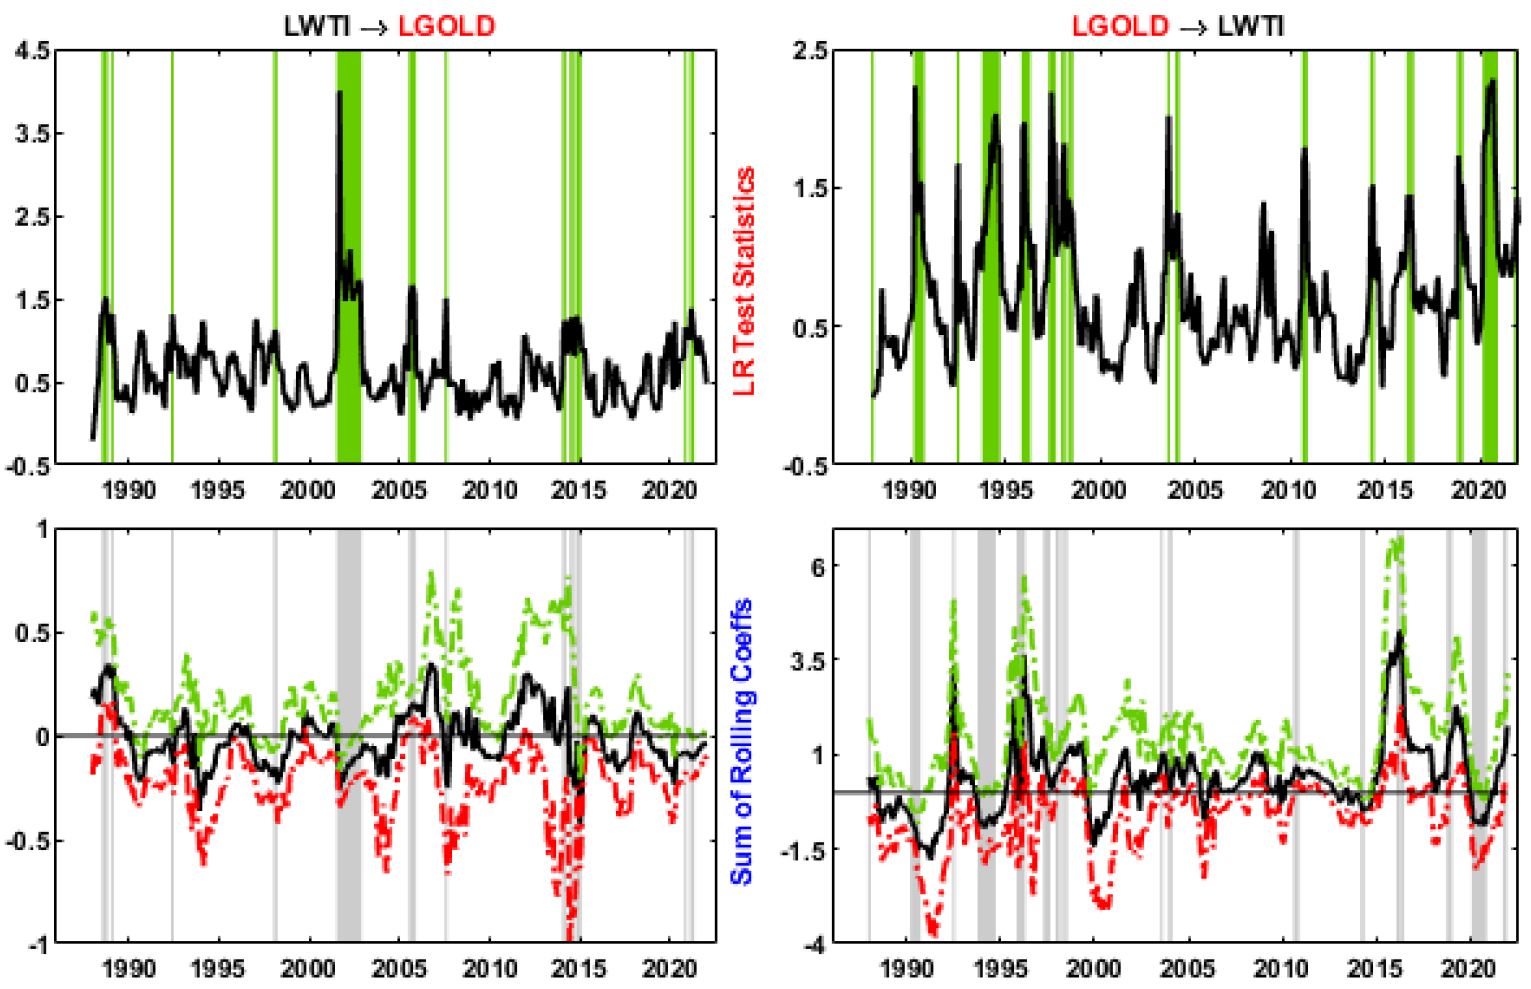 Figure 3. Rolling window estimation results between GOLD and WTI
The rolling causality test findings for the pair of gold-WTI prices can be visualized in Figure 3. Apparently, the predictive power of gold prices is more than that of WTI spot prices during the sample period, lasting 57 vs. 38 months and this result contradicts Bampinas and Panagiotidis (2015), Yildirim et al. (2020), and Shahzad et al. (2021), which reveal a higher proportion rate for rejection of no causality for Oil→Gold estimation than the reverse direction. The results show that WTI Granger-cause gold in the subperiods of 1988M08–1988M10 and 1989M02, exerting a positive impact on gold prices. From April to September 1990, there is a negative causal impact from gold to oil prices, indicating that the falling gold prices lead to an increase in oil prices during the Persian Gulf War. The largest-lasting causal period is observed, where the effect of gold on oil prices is negative in the 1993M11–1994M09 subperiods. Besides, the findings indicate that gold prices appear to have, respectively, positive and negative predictive power for oil prices during the subperiods of 1995M12–1996M04 and 1997M05–1997M08. Equally, a positive and unidirectional causal impact for WTI during the several subperiods in 1998 and a short and negative causal impact in the reverse direction from February to March in 1998 arises, leading to a bidirectional causal linkage in February 1998. The longest causal period running from WTI to gold prices emerges from August 2001 to November 2002 and the impact is negative, corresponding to several financial and economic crisis periods, such as the collapse of the Dotcom bubble, the 9/11 terrorist attacks, the economic crisis in Turkey and Argentina. These causal periods are matching with the findings regarding the time-varying causality-in-variance test from Yildirim et al. (2020). Gold prices affect positively Granger-cause WTI during the several subperiods of 2003M08, 2004M01–20040M2, and 2010M09–2010M11. In addition to unidirectional causality from August to November in 2005, WTI improves the prediction of gold prices from February to March in 2014, coinciding with Russia’s annexation of the Crimean peninsula and the impact is positive. Aftermath, a reverse, but positive causal linkage, lasting two months, seems visible. In 2014, two causal periods with a negative impact emerges from oil prices to gold prices, implying that falling oil prices leads to an increase in gold prices concurring with the 2014 oil price shock and the Russian financial crisis. Gold prices Granger-cause oil prices during the two subperiods in 2016—before the Brexit leave vote— and 2018 and the effect are positive, indicating that two assets are in the same boat. With the outbreak of COVID-19, a strong causality relationship runs in the same direction (Gharib et al., 2021) and the results display coefficient sign reversal to negative for a 9-month duration. These results indicate a flight-to-quality from investors and confirm the role of gold as a safe haven against falling oil prices driven by the Saudi Arabia–Russian oil price war. In 2021, the results highlight two short and unidirectional causal periods, exerting a negative and positive impact from WTI to gold and vice versa, respectively.
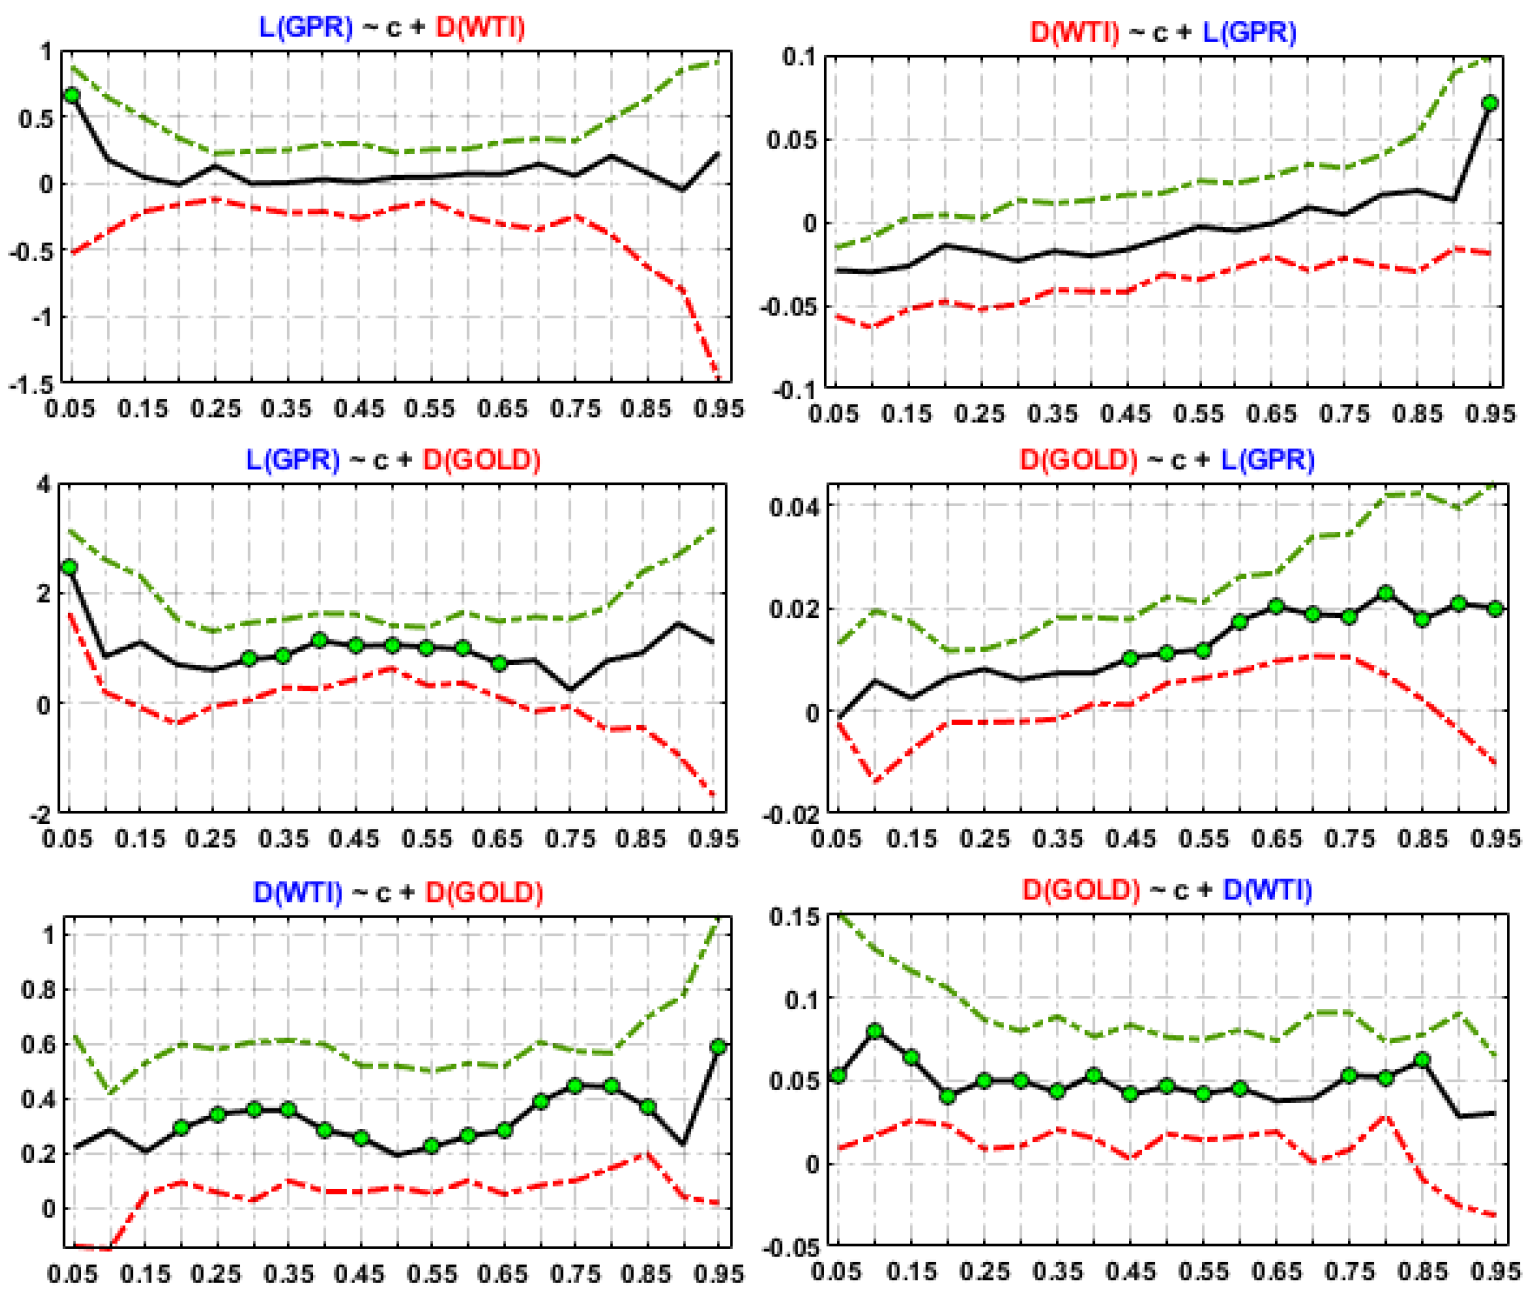
Figure 4. QR regression results with 90% confidence intervals among GPR, Gold, and WTI Price Changes
Note: The existence of a green circle indicates the significance of the coefficient at quantile τ using a 90% confidence level. The black solid line is the beta parameter while red and green dashed lines, respectively, represent the lower and upper bounds.
Next, the impact of the independent variable on the dependent variable for each quantile of the distribution function of the dependent variable is investigated through the quantile regression (QR) introduced by Koenker and Bassett (1978). This test is implemented over an equally spaced grid of 19 quantiles, that is, from 0.05 to 0.95 gradually increasing by 0.05 steps. The results are presented for 19 quantiles, along with upper and lower bounds for a 90% level confidence interval. For L(GPR), the coefficients of D(WTI) pick positive, albeit flimsy and insignificant, signs throughout the entire distribution, with a significantly positive and stronger impact in the lowest tail. The impact from L(GPR) is negative below the quantile τ= 0.55 while the coefficient turns positive from τ= 0.65 to the upper quantile and it becomes the strongest and most significant. This result indicates that an increase in geopolitical risk level results in higher oil price changes during extreme market conditions. This result supports the findings from Bouoiyour et al. (2019), which show a significantly positive linkage between oil returns and the changes in geopolitical risk during high uncertainty periods but regardless of the level of oil prices. In line with this paper’s findings, Qin et al. (2020) reveal a significantly negative and positive impact from geopolitical risks on crude oil returns at lower and upper quantiles, respectively, and suggest that rising geopolitical risks result in a decline in crude oil returns under the bearish market and both variables move together under the bullish market.
The findings exhibit comovement between L(GPR) and D(GOLD) at all quantiles and the degree of impact from gold returns is higher than geopolitical risk levels. The coefficients are stable and statistically significant at the 10% level for D(GOLD) at the first quantile and over the quantile range of 0.30 to 0.65, indicating that an increase in gold returns increases the level of geopolitical risk during normal market conditions. The impact from L(GPR) is significantly positive for all quantiles higher than τ = 0.45 and it strengthens as the level of gold returns increases. This result is consistent with the findings of Baur and Smales (2018), which reveal that gold prices react positively and significantly to geopolitical risks during extreme market conditions.
The findings show a similar relationship between D(WTI) and D(GOLD) over entire distributions. For gold returns, the degree of positive impact is higher during extreme market conditions and the coefficients are statistically significant for all quantiles above τ = 0.20, with exceptions for two quantiles τ = 0.50 and 0.90. When the gold market is bearish, the effect of changes in WTI oil prices is strongly positive for the lower quantiles, but it virtually remains unchanged and statistically significant over normal quantiles and at the three upper quantiles, the positive impact slightly increases. The results suggest that gold returns respond directly positively to changes in oil prices and vice versa regardless of market conditions. This paper’s findings, in part, align with Hernandez et al. (2019), who find a positive impact from oil returns on gold, silver, and corn returns at the lower quantiles, making them unsuitable for diversifying the oil price risk.
5. Discussion and policy implications
In this paper, the relationship between geopolitical risks (GPR), WTI oil, and gold prices is studied utilizing two approaches: the bootstrap rolling window causality approach and quantile regression. The sample period is January 1986 through January 2022, yielding 433 monthly observations and representing the longest common period of data availability. The results of the conventional causality test show no causation effects from geopolitical risks to WTI and gold prices and vice versa, while a unidirectional causality from gold returns to changes in oil prices emerge for the full sample period. These results are, in part, consistent with Bampinas and Panagiotidis (2015), Dutta et al. (2019), Gkillas et al. (2020), and Huang et al. (2021b) but differ from Abdel-Latif and El-Gamal (2020), Huang et al. (2021a), and Yildirim et al. (2020). Given the results of the parameter stability test as well as a measure of robustness, the paper implement the rolling causality test and detect consistent and dynamic causal linkages over time.
The results show the strongest causation effects for the pair of GPR–WTI and find that the gold market dominates the WTI and GPR in terms of strength of causation effect. Although the main findings, in part, align with recent empirical papers including Cai and Menegaki (2020), Yilanci and Kilci (2021), Yildirim et al. (2020), and Gharib et al. (2021), they also differ from other studies such as Bampinas and Panagiotidis (2015) and Shahzad et al. (2021). For most of the sample subperiods, the test detects unidirectional causality linkages from GPR to the WTI market. In addition, there are also several bidirectional causal subperiods between GPR and WTI before 2009. These periods are mostly coinciding with the major economic and financial turbulence events, such as the Dot-Com and 2007 US Subprime crises, suggesting that the bootstrap rolling test findings are not statistical artifacts and correspond to real economic changes (Balcilar et al., 2010). During the aforementioned causal periods, GPR influences mostly negatively oil and gold markets while it receives a positive causal impact from these markets and this contradicts Cai and Menegaki (2020). Additionally, the findings reveal a mostly positive causal effect between oil and gold markets, suggesting that an increase in one market leads the other market in the same direction. For the COVID19 period, the direction of causality substantially changes in favor of WTI for the GPR–WTI pair whereas it remains unchanged for the WTI–gold pair. The results indicate that WTI has positive and negative predictive powers for GPR and gold while it receives negative and positive causation effects from GPR and gold during the pandemic, respectively. The estimation findings of QR virtually confirm the causality results; the effects of GPR and WTI changes on gold returns are significantly positive and vice versa while there is no significant impact between GPR and WTI over all quantiles, supporting the existing studies such as Baur and Smales (2018), Bouoiyour et al. (2019), Hernandez et al. (2019), and Qin et al. (2020) for their most positive impact between the underlying series.
The implications of the results regarding the time-varying causality test and quantile regressions are important for risk and portfolio management and policy-making decisions. From investors’ perspective, a higher causality proportion of GPR relative to gold prices for oil prices suggests using geopolitical risk level trends instead of the gold market to predict the shocks in the oil market during the major financial crisis periods. Given the fact that an increase in geopolitical risk causes lower oil prices, investors are suggested to analogously take appropriate measures to avoid possible losses in the oil market. A relatively lower causation impact from geopolitical risks on gold prices compared to oil prices for the full sample and non-causality during crisis periods underpins the role of gold as a hedge or safe-haven against higher uncertainty. Additionally, the different (causation) impacts from geopolitical risks on oil and gold market returns suggest taking different actions against geopolitical risks under various market conditions to achieve the optimal benefits of international portfolio diversification and investment strategies and implement effective fiscal policy management for maintaining the stability in gold and oil markets and preventing risk spillovers between them as well as from geopolitical uncertainties. From the policymaking perspective, however, the existence of a positive causal linkage between oil and gold prices shows the importance of monitoring shocks driven by the crude oil market instead of geopolitical uncertainties in predicting gold prices. Similarly, oil importing and/or exporting countries should more closely track geopolitical risks rather than the gold market to avoid unprecedented price shocks since GPR outperforms gold prices in predicting oil prices and measuring its impact over various market conditions.
The major limitation of this paper is the frequency of data and the methodology applied. Futures papers may consider (i) higher frequency data (daily or 5-minutely) instead of monthly observations, (ii) subindices of GPR, (iii) other risk measures (Twitter-based uncertainty, financial stress index, etc.). Besides, there is necessitate to expand the relationship among three markets by selecting the country-specific geopolitical risk indices or others uncertainty indices —economic policy uncertainty, financial stress indices, etc.—and/or use of gold and oil data denominated in a currency other than the USD. Overall, investigating the effects of risk measures on oil and commodity markets using more robustness and novel techniques such as time-varying copula-based models, cross-quantilogram methodology, network approaches, connectedness, quantile-on-quantile regression, and causality tests also warrants future study.
References
Abdel-Latif, H., & El-Gamal, M. (2020). Financial liquidity, geopolitics, and oil prices. Energy Economics, 87, 104482. https://doi.org/10.1016/j.eneco.2019.104482
Andrews, D.W.K. (1993). Tests for parameter instability and structural change with unknown change point. Econometrica 61, 821–856.
Andrews, D.W.K., & Ploberger, W. (1994). Optimal tests when a nuisance parameter is present only under the alternative. Econometrica 62, 1383–1414.
Balcilar, M., Ozdemir, Z. A., & Arslanturk, Y. (2010). Economic growth and energy consumption causal nexus viewed through a bootstrap rolling window. Energy Economics, 32(6), 1398-1410. https://doi.org/10.1016/j.eneco.2010.05.015
Balcilar, M., Ozdemir, Z. A., & Shahbaz, M. (2019). On the time-varying links between oil and gold: New insights from the rolling and recursive rolling approaches. International Journal of Finance & Economics, 24(3), 1047–1065.
Bampinas, G., & Panagiotidis, T. (2015). On the relationship between oil and gold before and after financial crisis: linear, nonlinear and time-varying causality testing. Studies in Nonlinear Dynamics & Econometrics, 19(5), 657-668. https://doi.org/10.1515/snde-2014-0060
Baur, D. G., & Smales, L. A. (2018). Gold and geopolitical risk. Available at SSRN: https://ssrn.com/abstract=3109136
Bhar, R., & Malliaris, A. G. (2011). Oil prices and the impact of the financial crisis of 2007–2009. Energy Economics, 33(6), 1049–1054.
Bouoiyour, J., Selmi, R., Hammoudeh, S., & Wohar, M. E. (2019). What are the categories of geopolitical risks that could drive oil prices higher? Acts or threats?. Energy Economics, 84, 104523. https://doi.org/10.1016/j.eneco.2019.104523
Cai, Y., & Menegaki, A. (2020). Causality between Geopolitical Risks Shock and Crude Oil Trade in the USA–A Time-varying Approach. Available at SSRN 3665180. http://dx.doi.org/10.2139/ssrn.3665180
Caldara, D. and Iacoviello, M. (2021). Measuring Geopolitical Risk. Board of Governors of the Federal Reserve Board Working Paper. Data downloaded from https://www.matteoiacoviello.com/gpr.htm on February 25, 2022).
Caldara, D., & Iacoviello, M. (2018). Measuring geopolitical risk. FRB International Finance Discussion Paper, (1222).
Chan, K. F., Treepongkaruna, S., Brooks, R., & Gray, S. (2011). Asset market linkages: Evidence from financial, commodity and real estate assets. Journal of Banking & Finance, 35(6), 1415–1426.
Coad, A., & Rao, R. (2006). Innovation and market value: a quantile regression analysis. Economics Bulletin, 15(13), 1–10.
Das, D., Kannadhasan, M., & Bhowmik, P. (2019). Geopolitical risk and precious metals. Journal of Economic Research, 24(1), 49–66.
Diamonte, R. L., Liew, J. M., & Stevens, R. L. (1996). Political risk in emerging and developed markets. Financial Analysts Journal, 52(3), 71–76.
Dibooğlu, S., & Aleisa, E. (2004). Oil prices, terms of trade shocks, and macroeconomic fluctuations in Saudi Arabia. Contemporary Economic Policy, 22(1), 50–62.
Dolado, J. J., & Lütkepohl, H. (1996). Making Wald tests work for cointegrated VAR systems. Econometric Reviews, 15(4), 369–386.
Dutta, A., Bouri, E., & Roubaud, D. (2019). Nonlinear relationships amongst the implied volatilities of crude oil and precious metals. Resources Policy, 61, 473-478. https://doi.org/10.1016/j.resourpol.2018.04.009
El-Katiri, L., Fattouh, B., & Mallinson, R. (2014). The Arab Uprisings and MENA Political Instability–Implications for Oil & Gas Markets.
Gharib, C., Mefteh-Wali, S., & Jabeur, S. B. (2021). The bubble contagion effect of COVID-19 outbreak: Evidence from crude oil and gold markets. Finance Research Letters, 38, 101703. https://doi.org/10.1016/j.frl.2020.101703
Gkillas, K., Bouri, E., Gupta, R., & Roubaud, D. (2020a). Spillovers in higher-order moments of crude oil, gold, and Bitcoin. The Quarterly Review of Economics and Finance. https://doi.org/10.1016/j.qref.2020.08.004
Gkillas, K., R. Gupta, and C. Pierdzioch. (2020b). Forecasting Realized Gold Volatility: Is There a Role of Geopolitical Risks?. Finance Research Letters 35: 101280.
Hamilton, J. D. (1983). Oil and the macroeconomy since World War II. Journal of political economy, 91(2), 228–248.
Hansen, B.E., (1992). Tests for parameter instability in regressions with I(1) processes. Journal of Business and Economic Statistics 10, 321–336.
Hernandez, J. A., Shahzad, S. J. H., Uddin, G. S., & Kang, S. H. (2019). Can agricultural and precious metal commodities diversify and hedge extreme downside and upside oil market risk? An extreme quantile approach. Resources Policy, 62, 588-601. https://doi.org/10.1016/j.resourpol.2018.11.007
Huang, J., Ding, Q., Zhang, H., Guo, Y., & Suleman, M. T. (2021a). Nonlinear dynamic correlation between geopolitical risk and oil prices: A study based on high-frequency data. Research in International Business and Finance, 56, 101370. https://doi.org/10.1016/j.ribaf.2020.101370
Huang, J., Li, Y., Suleman, M. T., & Zhang, H. (2021b). Effects of geopolitical risks on gold market return dynamics: Evidence from a nonparametric causality-in-quantiles approach. Defence and Peace Economics, 1–15. https://doi.org/10.1080/10242694.2021.2007333
Hutchison, M. M. (1991). Aggregate demand, uncertainty and oil prices: The 1990 oil shock in comparative perspective.
Johansen, S., 1991. Estimation and hypothesis testing of cointegration vectors in Gaussian vector autoregressive models. Econometrica 59, 1551–1580.
Joo, K., Suh, J. H., Lee, D., & Ahn, K. (2020). Impact of the global financial crisis on the crude oil market. Energy Strategy Reviews, 30, 100516.
Kang, S., Hernandez, J. A., Sadorsky, P., & McIver, R. (2021). Frequency spillovers, connectedness, and the hedging effectiveness of oil and gold for US sector ETFs. Energy Economics, 99, 105278.
Kapetanios, G. (2005). Unit-root testing against the alternative hypothesis of up to m structural breaks. Journal of Time Series Analysis, 26(1), 123–133.
Koenker, R., & Bassett G. (1978). Regression quantiles. Econometrica, 46(1), 33–50.
Krugman, P. (2008). The oil non-bubble. The New York Times Opinion.
Li, Y., Huang, J., & Chen, J. (2021a). Dynamic spillovers of geopolitical risks and gold prices: New evidence from 18 emerging economies. Resources Policy, 70, 101938.
Li, Y., Huang, J., Gao, W., & Zhang, H. (2021b). Analyzing the time-frequency connectedness among oil, gold prices and BRICS geopolitical risks. Resources Policy, 73, 102134. https://doi.org/10.1016/j.resourpol.2021.102134
Mei, D., Zeng, Q., Cao, X., & Diao, X. (2019). Uncertainty and oil volatility: New evidence. Physica A: Statistical Mechanics and its Applications, 525, 155–163.
Noguera-Santaella, J. (2016). Geopolitics and the oil price. Economic Modelling, 52, 301–309. https://doi.org/10.1016/j.econmod.2015.08.018
Nyblom, J., 1989. Testing for the constancy of parameters over time. Journal of the American Statistical Association 84, 223–230.
Park, J. Y., & Phillips, P. C. (1989). Statistical inference in regressions with integrated processes: Part 2. Econometric Theory, 5(1), 95–131.
Qin, Y., Hong, K., Chen, J., & Zhang, Z. (2020). Asymmetric effects of geopolitical risks on energy returns and volatility under different market conditions. Energy Economics, 90, 104851. https://doi.org/10.1016/j.eneco.2020.104851
Shahzad, F., Bouri, E., Mokni, K., & Ajmi, A. N. (2021). Energy, agriculture, and precious metals: Evidence from time-varying Granger causal relationships for both return and volatility. Resources Policy, 74, 102298. https://doi.org/10.1016/j.resourpol.2021.102298
Shukur, G., and Mantalos, P. (1997). Tests for Granger causality in integratedcointegrated VAR systems. Working paper 1998:1, Department of Statistics, University of Lund, Sweden.
Sujit, K. S., & Kumar, B. R. (2011). Study on dynamic relationship among gold price, oil price, exchange rate and stock market returns. International journal of applied business and economic research, 9(2), 145–165.
Toda, H. Y., & Phillips, P. C. B. (1993). Vector autoregressions and causality. Econometrica, 61, 1367–1393. https://doi.org/10.2307/2951647.
Toda, H. Y., & Phillips, P. C. B. (1994). Vector autoregression and causality: A theoretical overview and simulation study. Econometric Reviews, 13, 259–285. https://doi.org/10.1080/07474939408800286
Toda, H. Y., & Yamamoto, T. (1995). Statistical inference in vector autoregressions with possibly integrated processes. Journal of Econometrics, 66(1-2), 225-250. https://doi.org/10.1016/0304-4076(94)01616-8
Triki, M. B., & Maatoug, A. B. (2021). The gold market as a safe haven against the stock market uncertainty: evidence from geopolitical risk. Resources Policy, 70, 101872. https://doi.org/10.1016/j.resourpol.2020.101872
Wang, K. H., Su, C. W., & Umar, M. (2021). Geopolitical risk and crude oil security: A Chinese perspective. Energy, 219, 119555.
Yilanci, V., & Kilci, E. N. (2021). The role of economic policy uncertainty and geopolitical risk in predicting prices of precious metals: evidence from a time-varying bootstrap causality test. Resources Policy, 72, 102039. https://doi.org/10.1016/j.resourpol.2021.102039
Yildirim, D. Ç., Cevik, E. I., & Esen, Ö. (2020). Time-varying volatility spillovers between oil prices and precious metal prices. Resources Policy, 68, 101783.
Uddin, G. S., Rahman, M. L., Shahzad, S. J. H., & Rehman, M. U. (2018). Supply and demand driven oil price changes and their non-linear impact on precious metal returns: A Markov regime switching approach. Energy Economics, 73, 108–121.
1 https://capital.com/most-traded-commodities [accessed on October 19, 2022]
2 https://www.bloomberg.com/news/articles/2022-03-24/putin-s-war-risks-more-global-hunger-destabilizing-poor-nations?utm_campaign=socialflow-organic&cmpid%3D=socialflow-twitter-economics&utm_content=economics&utm_source=twitter&utm_medium=social