Ekonomika ISSN 1392-1258 eISSN 2424-6166
2023, vol. 102(1), pp. 140–152 DOI: https://doi.org/10.15388/Ekon.2023.102.1.8
The Nexus Between Institutional Quality and Inflation in Emerging Markets: A Panel Causality Test with a Fourier Function
Yildirim Beyazit Cicen
Gumushane University, Faculty of Economics and Administrative Sciences,
Department of Economics, Turkiye
e-mail: ybcicen@gumushane.edu.tr
Abstract. It is important to note that institutional quality has a substantial impact on a country’s long-term economic growth, which influences other economic indicators, such as inflation and monetary policy. An in-depth examination of the existence of this crucial relationship was conducted by applying a novel and robust panel Yilanci–Gorus Fourier causality test between 2000 and 2019 to 24 developing countries, in order to detect this relationship. A recent inflation rate, the standard deviation of inflation, and sound money are all interconnected and mutually causally related to property rights and the quality of the legal system. Weakness in institutions can exacerbate financial shocks, thereby affecting monetary indicators, and monetary policies will deteriorate the quality of the institution as a result.
Keywords: Property Rights, Legal System, Inflation, Developing Countries, Fourier Causality Test.
________
Received: 16/10/2022. Revised: 10/12/2023. Accepted: 27/03/2023
Copyright © 2023 Yildirim Beyazit Cicen. Published by Vilnius University Press
This is an Open Access article distributed under the terms of the Creative Commons Attribution License, which permits unrestricted use, distribution, and reproduction in any medium, provided the original author and source are credited.
1. Introduction
The institutional quality of a country is a critical factor for sustainable growth. To achieve long-term growth, countries also need institutions that will provide macroeconomic stability. All countries must establish fiscal and monetary institutions in order to ensure macroeconomic stability in order to achieve long-term growth. Through these institutions, objectives such as preventing potential crises and minimizing the effects of conjuncture-related shocks can be pursued. At the same time, economic institutions affect a country’s economic performance and resource allocation. However, political institutions in a country also play a significant role in determining economic institutions (Acemoglu and Robinson, 2019).
For this reason, it is necessary to make an accurate diagnosis to examine the political institutions while analyzing a country’s economic indicators. Because countries with macroeconomic problems such as high inflation, large budget deficits, and overvalued exchange rates are examined, these countries are seen as having weak institutions. In addition to political instability, property rights are not fully implemented, political restrictions are not imposed, and widespread corruption is observed in these countries. The likelihood of severe economic crises and high volatility is much higher in countries with exclusionary institutions. These institutional restrictions prevent the efficient functioning of the economy and the efficient allocation of resources. As a result, economic growth is significantly lower in these countries and economic crises are more likely (Acemoglu et al., 2003; Khan, 2018).
The idea could be put forward that countries with higher inflation have weaker institutions than countries with lower inflation. This difference could be attributed to the absence of effective economic policies and poor political stability, both of which ultimately result in higher inflation. When governments are unable to implement effective fiscal and monetary policies, the money supply increases and inflation goes up. This weakens the government’s ability to implement economic policies and leads to a lack of political stability, further exacerbating the problem (Chugunov et al., 2021).
According to New Institutional Economics (NIE), institutions and governance structures matter for the economy. The NIE framework posits that the degree of economic reforms and the ability of the government to implement them are key factors in determining the inflation rate (Peters, 2019). In this study, data from different countries will be examined in order to determine how institutional structure affects inflation. With the help of the NIE framework, this study attempts to explain the relationship between institutional structure and inflation in developing countries.
There are only a few studies in the literature that take into account this aspect of causality in developing theories. This study examined the relationship between 24 developing countries’ institutions and their monetary indicators in order to determine their economic performance.
In the analysis section, Fraser Institute data is used. To represent monetary indicators, three different indices have been selected. Thus, rather than using only one indicator to determine robustness, three indicators of monetary variables are taken into account along with the institution’s quality.
Following the introduction, we review the existing literature addressing institutions and monetary indicators. In the third section, the dataset and the analyzing method are explained in detail under separate headings. In the fourth section, a tabular summary of the empirical results is presented. Finally, we come to the conclusion and discussion section.
2. Literature Review
Studies on monetary policies and indicators generally analyze without considering institutions. The economics literature has generally explained the causes of macroeconomic instability with purely economic arguments. Monetary and fiscal policies have been accepted as exclusive tools to ensure macroeconomic stability and reduce inflation (Fenira, 2014; Minea et al., 2021: 2108). Studies in the literature that consider institutions indicate that inflation depends on the lack of central bank independence, weak financial structure, and the lack of development of democratic institutions. In addition, the speed and quality of growth are other factors that affect inflation (Lim, 2021, 310; Khan and Hanif, 2020: 628-629).
Among the studies in the literature, Aisen and Veiga (2008) stated that political instability and low-quality institutions increase inflation volatility in developing countries. The relationship between central bank reform and political restrictions and inflation was highlighted by Acemoglu et al. (2008). A study conducted by Law and Soon (2020) found that inflation is lower in countries with better institutional quality. As well, Ibarra and Trupkin (2016) suggest that central banks can improve economic growth by reducing inflation when it approaches the threshold. In contrast, countries with strong institutions have lower inflation thresholds than developing countries with weak institutions. The relationship between inflation targeting and financial stability is negative in countries with weak institutional quality, according to Fazio et al. (2018). In this context, the question of countries that adopt inflation targeting and currency board regimes within the institutional framework, according to Neyapti (2012), are more successful at reducing inflation. In the absence of independence of the Central Bank, these institutions will be subject to the political influence of the government party, as they are designed to replace the governance mechanism (Van Lelyveld, 2000: 180). An alternative study by Krause and Mendez (2008) argues that making the Central Bank independent in hyperinflationary countries will provide more benefits than maintaining a strict inflation-targeting regime. The same paper suggests strengthening the independence of central banks in countries with low inflation. There is also evidence that lower inflation rates in developing countries are linked to higher central bank independence. Democracies have a stronger effect on lowering inflation (Garriga and Rodriguez, 2020). As a result of their political and economic backgrounds, Berlemann and Enkelmann (2014) found that East Germans avoided inflation significantly more than West Germans even 20 years after unification. There is, however, another dimension of causality to be considered. A controlled inflation improves the institution’s quality, and vice versa (Minea et al., 2021).
Unlike other articles in the literature, this study examines the recent past over a longer period (2000–2019) and includes more developing countries (24 countries) than previous studies. As well, the Yilanci and Gorus (2020) methodology used in the model is a newly developed and robust panel causality test. This article therefore provides a valuable addition to the existing literature by extending the temporal horizon and expanding the number of countries studied, while using a newly developed and robust panel causality test.
3. Data and Methodology
3.1. Econometric Methodology
The causality test of Toda and Yamamoto (1995) and the panel causality test of Dumitrescu and Hurlin (2012) perform analysis without considering structural breaks in the variables. In this context, Emirmahmutoglu and Kose (2011) proposed a panel causality test based on the Toda–Yamamoto causality test robust to variables’ integration and cointegration properties. The panel test statistic fits with the chi-square distribution, and Fisher (1932) was followed to obtain panel test statistics. The study suggests using bootstrap simulations to obtain critical values of the Fisher test statistics if there is cross-section dependence in the model.
Nazlioglu et al. (2016) developed a causality test incorporating the Fourier function, enhancing the Toda–Yamamoto procedure. Structural breaks can be successfully captured using Fourier functions, and the number, date, and types of breaks do not need to be determined in advance.
In addition to these tests developed, Yilanci and Gorus (2020) propose a panel version of the Fourier Toda–Yamato test to test the null hypothesis of causality and estimate a bivariate panel VAR model:
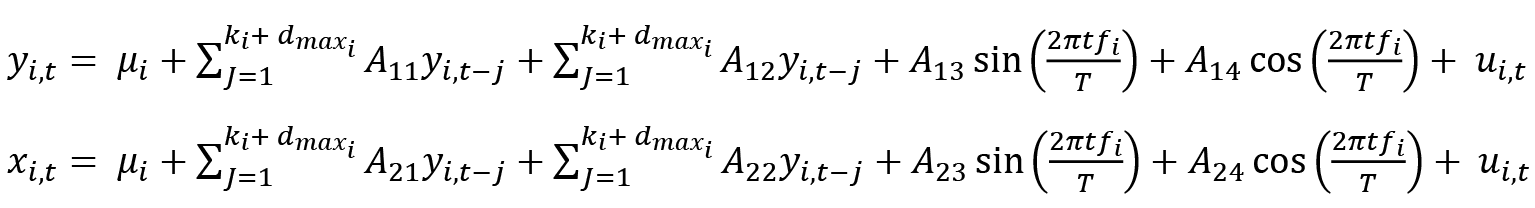
In these models π = 3.1416, t is the trend term and T shows the sample size. fi shows a particular frequency with a Fourier approximation. To test the null hypothesis of no causality, VAR model equations are estimated individually for each country and the Wald test is used to restrict the k lags for computing the bootstrap p value. As a result of the panel Fourier Toda–Yamamoto causality test, the following Fisher test statistic is obtained:
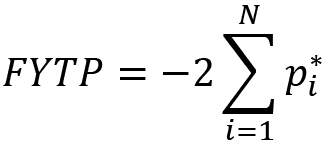
In this model pi* is the bootstap p values of the Wald test statistics fort the ith individual cross-section.
Yilanci and Gorus (2020) test has advantages such as endogenously detecting the number, location and form of structures. The causality relationship can be tested regardless of the panel series’ stationarity level or the cointegration relationship. Variables are added to the model without taking the difference. This test also considers the structural change with the Fourier technique by adding trigonometric terms. In addition, the test takes into account the cross-section dependence.
3.2. Data
The causality relationship between institution quality and inflation has been revealed in this study using Fraser Institute (FI) data for the period 2000–2019 in 24 developing countries (Argentina, Brazil, Bulgaria, Chile, China, Colombia, Croatia, Czech Republic, Hungary, India, Indonesia, Latvia, Lithuania, Malaysia, Mexico, Philippines, Poland, Romania, Russian Federation, South Africa, Taiwan, Thailand, Turkey, Ukraine). The model included all countries in the FI’s database, including institution quality and monetary indicators for the relevant period. Institution quality was represented by the “legal system and property rights” (LP), while monetary indicators were represented by the “most recent year inflation” (RI), “standard deviation of inflation” (SI), and “sound money” (SM) indexes.1
The LP index used to represent institution quality includes the following sub-components: judicial independence, impartial courts, protection of property rights, military interference in rule of law and politics, integrity of the legal system, legal enforcement of contracts, regulatory costs of the sale of real property, reliability of police, business costs of crime and business cost of prime. Individual economic freedom can thus be ensured through the protection of property rights, an independent and unbiased judiciary, and the impartial and effective application of the law. Market failure will occur if these conditions are not met because contracts will be incomplete, and the price system will lose its role in ensuring market efficiency (Bowles and Carlin, 2020: 8-9).
The RI index shows the price stability of the country. While countries that achieve perfect price stability get 10 points, the score decreases as the inflation rate approaches 50%. If the inflation rate is 50% or more, zero points are given to the relevant country. The SI index measures the standard deviation of the inflation rate over the past five years. The country receives ten points on this index when the inflation rate does not change for five years. Grades drop to zero as the standard deviation of the inflation rate approaches 25% per annum. The SM index brings together the money growth, standard deviation of inflation, most recent year inflation, and freedom to own foreign currency bank accounts sub-variables. For a country to score high on this index, it must adopt policies and institutions that lead to low and stable inflation rates and avoid regulations limiting its ability to use alternative currencies.
Descriptive statistics are given in Table 1. The results indicate that the series are not normally distributed. The LP variable, on the other hand, has a left-skewed and pointed distribution, whereas the other variables have a right-skewed and flattened distribution. This indicates that the data is asymmetric and the skewness plays an important role in the series. Also LP has the lowest standard deviation, while monetary indicators have higher standard deviations. According to this finding, institutional change in the countries changes slowly when we evaluate it with the minimum and maximum values of LP.
Table 1. Descriptive Statistics
|
Statistics |
LP |
SM |
RI |
SI |
|
Mean |
5.540 |
8.134 |
8.805 |
8.552 |
|
Median |
5.440 |
8.321 |
9.225 |
9.186 |
|
Standard Deviation |
0.847 |
1.423 |
1.469 |
1.744 |
|
Kurtosis |
-0.913 |
1.670 |
15.308 |
10.488 |
|
Skewness |
0.104 |
-1.313 |
-3.529 |
-3.081 |
|
Maximum |
3.223 |
2.244 |
0 |
0 |
|
Minimum |
7.230 |
9.812 |
10 |
9.930 |
|
Jacque-Bera |
17.554* |
193.822* |
5683.039* |
2959.215* |
|
JB p-value |
0.000 |
0.000 |
0.000 |
0.000 |
* Significance at 1% level
The correlation matrix of the variables is shown in Table 2. According to the table, the highest correlation value is between sound money and the standard deviation of inflation, while the lowest is between legal system and property rights and the inflation standard deviation. This suggests that economic forces, such as sound money, play an important role in driving the standard deviation of inflation, while the legal system and property rights have comparatively less influence. This suggests that in the short run sound money is a stronger driver of inflation than the legal system and property rights. This could be because sound money influences the supply of money, which affects the price of goods, services, and assets, and thus has a more direct impact on the standard deviation of inflation.
Table 2. Correlation Matrix
|
|
LP |
SM |
RI |
SI |
|
LP |
1 |
|||
|
SM |
0.499 |
1 |
||
|
RI |
0.319 |
0.663 |
1 |
|
|
SI |
0.273 |
0.695 |
0.559 |
1 |
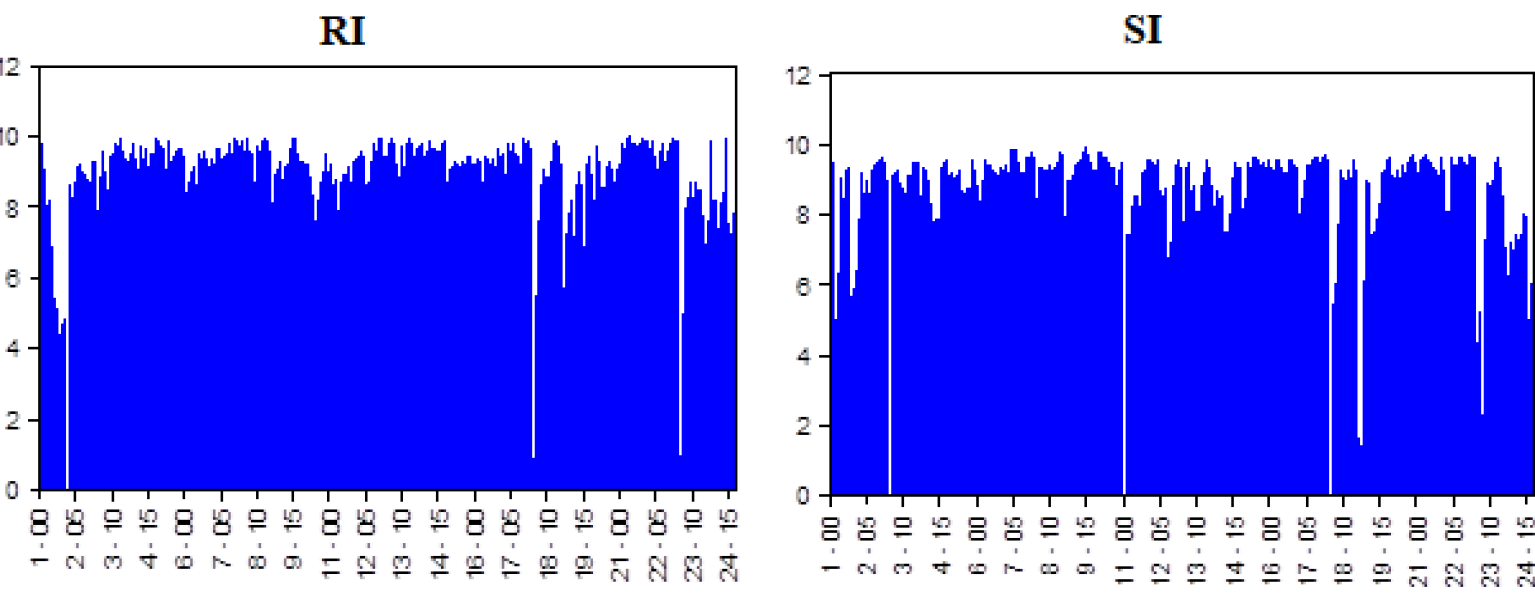
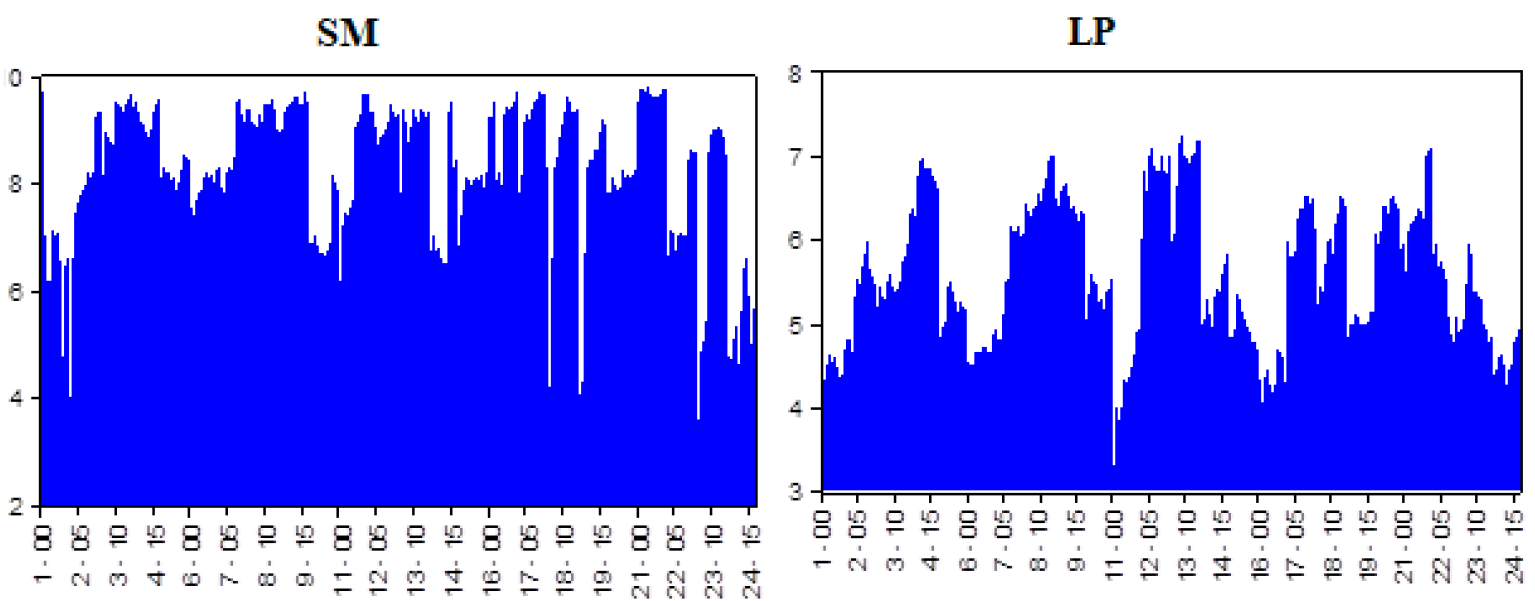
Figure 1. Time Dynamics of Series (For picturing the graphs, Eviews 9 is used)
In addition, the plot of the time path of the series is presented in Figure 1.2 The highest values of RI are close to each other and are at the level of 10. Turkey, Argentina, and Ukraine had the lowest values, close to zero. Accordingly, inflation in these countries rose towards 50%. While the highest values of SI are seen in many countries, the lowest ones are in Bulgaria, Indonesia, and Romania. Sound money was highest in Taiwan in 2007 and lowest in Ukraine in 2000. LP was highest in Lithuania in 2007 and lowest in Indonesia in 2003.
4. Empirical Results
This study revealed the relationship between LP and three different monetary variables. First, the relationship between LP and RI variables was examined, and the results are presented in Table 3. The findings show unidirectional causality from LP to RI in Argentina, India, and Romania. There is also unidirectional causality in RI to LP in Lithuania, Malaysia, and the Russian Federation. Finally, the empirical results of the PFTY test provide evidence of bidirectional causality between LP and RI. This means that in Argentina, India, and Romania, the level of LP affects the level of RI, while in Lithuania, Malaysia, and the Russian Federation, the level of RI affects the level of LP. The PFTY test also suggests that there is a bidirectional relationship between LP and RI, indicating that both variables can affect each other. This indicates that both LP and RI are important determinants of economic performance, and should be taken into account when making policy decisions in these countries.
Table 3. The Causal Relationship Between Legal System and Property Rights and Most Recent Year Inflation
|
LP does not cause RI |
RI does not cause LP |
|||||||||
|
Country |
Frequency |
Test Stat |
p-value |
Country |
Frequency |
Test Stat |
p-value |
Results |
||
|
Argentina |
3 |
27.82458 |
0.003* |
Argentina |
3 |
0.313494 |
0.851 |
LP→RI |
||
|
Brazil |
1 |
1.096652 |
0.565 |
Brazil |
1 |
3.48108 |
0.232 |
LP ̶ RI |
||
|
Bulgaria |
2 |
0.018051 |
0.883 |
Bulgaria |
2 |
0.155389 |
0.716 |
LP ̶ RI |
||
|
Chile |
3 |
0.229738 |
0.612 |
Chile |
3 |
0.911282 |
0.339 |
LP ̶ RI |
||
|
China |
1 |
1.453896 |
0.257 |
China |
1 |
0.406878 |
0.534 |
LP ̶ RI |
||
|
Colombia |
2 |
0.40257 |
0.569 |
Colombia |
2 |
0.760139 |
0.421 |
LP ̶ RI |
||
|
Crotia |
1 |
2.278468 |
0.141 |
Crotia |
1 |
2.257533 |
0.16 |
LP ̶ RI |
||
|
Czech Republic |
2 |
0.01934 |
0.865 |
Czech Republic |
2 |
1.59547 |
0.216 |
LP ̶ RI |
||
|
Hungary |
3 |
0.094826 |
0.748 |
Hungary |
3 |
0.657247 |
0.431 |
LP ̶ RI |
||
|
India |
1 |
16.42872 |
0.014** |
India |
1 |
0.25269 |
0.876 |
LP→RI |
||
|
Indonesia |
1 |
1.131239 |
0.299 |
Indonesia |
1 |
0.730907 |
0.4 |
LP ̶ RI |
||
|
Latvia |
1 |
0.080556 |
0.77 |
Latvia |
1 |
1.653796 |
0.221 |
LP ̶ RI |
||
|
Lithuania |
1 |
0.028315 |
0.989 |
Lithuania |
1 |
9.922228 |
0.037** |
LP←RI |
||
|
Malaysia |
2 |
4.916944 |
0.16 |
Malaysia |
2 |
6.778956 |
0.069*** |
LP←RI |
||
|
Mexico |
1 |
1.159918 |
0.307 |
Mexico |
1 |
0.354745 |
0.584 |
LP ̶ RI |
||
|
Philippines |
1 |
2.512572 |
0.361 |
Philippines |
1 |
1.435745 |
0.506 |
LP ̶ RI |
||
|
Poland |
1 |
0.39039 |
0.522 |
Poland |
1 |
0.432631 |
0.51 |
LP ̶ RI |
||
|
Romania |
1 |
7.710245 |
0.022** |
Romania |
1 |
0.105765 |
0.752 |
LP→RI |
||
|
Russian Federation |
2 |
1.765881 |
0.224 |
Russian Federation |
2 |
8.558322 |
0.013** |
LP←RI |
||
|
South Africa |
1 |
2.625785 |
0.133 |
South Africa |
1 |
1.753376 |
0.23 |
LP ̶ RI |
||
|
Taiwan |
3 |
1.386902 |
0.274 |
Taiwan |
3 |
1.016941 |
0.328 |
LP ̶ RI |
||
|
Thailand |
1 |
0.06016 |
0.814 |
Thailand |
1 |
3.253422 |
0.105 |
LP→RI |
||
|
Turkey |
3 |
0.382543 |
0.54 |
Turkey |
3 |
2.251865 |
0.158 |
LP ̶ RI |
||
|
Ukraine |
2 |
1.115737 |
0.322 |
Ukraine |
2 |
0.157878 |
0.732 |
LP ̶ RI |
||
|
Panel Fisher |
- |
64.64677 |
0.0546*** |
Panel Fisher |
- |
61.56346 |
0.0903* |
LP↔RI |
||
Note: *, **, and *** show statistical significance at 1%, 5%, and 10%, respectively. “→” and “←” denote unidirectional causality, and “↔” shows bidirectional causality while “—” states no causal link between variables.
The relationship between LP and SI variables was examined, and the results are presented in Table 4. The findings show unidirectional causality from LP to SI in the Czech Republic, Hungary, Malaysia, Romania, Taiwan and Ukraine, Argentina, India, and Romania. Also there is unidirectional causality from SI to LP in Argentina, Chile, the Philippines, and Turkey. In addition, Indonesia has bidirectional causality between these variables. Accordingly, the empirical results of the PFTY test show that there is bidirectional causality between LP and SI for the period studied. The results indicate that there is a strong relationship between levels of LP and SI in all of the countries studied, with the direction of causality changing in some cases. This implies that changes in the levels of LP can influence the levels of SI, and vice versa. The findings also suggest that this relationship is complex, as the direction of causality varies depending on the country.
Table 4. The Causal Relationship Between Legal System and Property Rights and Standart Deviation of Inflation
|
LP does not cause SI |
SI does not cause LP |
|||||||||
|
Country |
Frequency |
Test Stat |
p-value |
Country |
Frequency |
Test Stat |
p-value |
Results |
||
|
Argentina |
1 |
1.373199 |
0.502 |
Argentina |
1 |
9.841369 |
0.04** |
LP←SI |
||
|
Brazil |
1 |
1.723036 |
0.446 |
Brazil |
1 |
1.716133 |
0.462 |
LP ̶ SI |
||
|
Bulgaria |
1 |
2.141305 |
0.388 |
Bulgaria |
1 |
1.922289 |
0.448 |
LP ̶ SI |
||
|
Chile |
1 |
0.000974 |
0.974 |
Chile |
1 |
6.06879 |
0.028** |
LP←SI |
||
|
China |
2 |
0.134313 |
0.694 |
China |
2 |
2.252644 |
0.154 |
LP ̶ SI |
||
|
Colombia |
1 |
0.413096 |
0.828 |
Colombia |
1 |
5.576683 |
0.114 |
LP ̶ SI |
||
|
Crotia |
2 |
0.595386 |
0.464 |
Crotia |
2 |
1.485565 |
0.26 |
LP ̶ SI |
||
|
Czech Republic |
1 |
10.23854 |
0.022** |
Czech Republic |
1 |
5.394694 |
0.158 |
LP→SI |
||
|
Hungary |
1 |
9.392092 |
0.036** |
Hungary |
1 |
0.364534 |
0.868 |
LP→SI |
||
|
India |
1 |
2.989586 |
0.27 |
India |
1 |
1.246274 |
0.57 |
LP ̶ SI |
||
|
Indonesia |
2 |
10.42684 |
0.038** |
Indonesia |
2 |
10.40631 |
0.03** |
LP↔SI |
||
|
Latvia |
3 |
0.38761 |
0.83 |
Latvia |
3 |
1.68283 |
0.484 |
LP ̶ SI |
||
|
Lithuania |
1 |
4.687346 |
0.18 |
Lithuania |
1 |
1.214261 |
0.592 |
LP ̶ SI |
||
|
Malaysia |
3 |
6.58738 |
0.016** |
Malaysia |
3 |
0.058603 |
0.812 |
LP→SI |
||
|
Mexico |
1 |
5.387542 |
0.146 |
Mexico |
1 |
0.556422 |
0.778 |
LP ̶ SI |
||
|
Philippines |
1 |
3.696873 |
0.232 |
Philippines |
1 |
6.85175 |
0.082*** |
LP←SI |
||
|
Poland |
1 |
2.743665 |
0.268 |
Poland |
1 |
4.563806 |
0.142 |
LP ̶ SI |
||
|
Romania |
1 |
8.098745 |
0.066*** |
Romania |
1 |
0.816173 |
0.682 |
LP→SI |
||
|
Russian Federation |
1 |
7.101902 |
0.074*** |
Russian Federation |
1 |
140.1686 |
0.000* |
LP↔SI |
||
|
South Africa |
1 |
2.644733 |
0.29 |
South Africa |
1 |
0.825838 |
0.706 |
LP ̶ SI |
||
|
Taiwan |
1 |
4.322059 |
0.06*** |
Taiwan |
1 |
0.011785 |
0.918 |
LP→SI |
||
|
Thailand |
2 |
0.035781 |
0.85 |
Thailand |
2 |
0.524275 |
0.514 |
LP ̶ SI |
||
|
Turkey |
1 |
1.265142 |
0.528 |
Turkey |
1 |
18.3235 |
0.006* |
LP←SI |
||
|
Ukraine |
3 |
4.394701 |
0.056*** |
Ukraine |
3 |
0.711334 |
0.44 |
LP→SI |
||
|
Panel Fisher |
- |
78.61384 |
0.0035* |
Panel Fisher |
- |
INF |
0.000* |
LP↔SI |
||
Note: *, **, and *** show statistical significance at 1%, 5%, and 10%, respectively. “→” and “←” denote unidirectional causality, and “↔” shows bidirectional causality while “—” states no causal link between variables.
Both Tables 3 and 4 support each other’s findings. Accordingly, LP is not only responsible for recent inflation, but it is also responsible for explaining changes in inflation. Additionally, recent inflation and its standard deviation have led to changes in institutional structures as a result of reverse causality. Consequently, LP plays a critical role in understanding the dynamics of inflation, both in the short and long term.
In Table 5, the results of the relationship between the variables of LP and SM are presented. There is unidirectional causality from LP to SM in Brazil, China, Latvia, Lithuania, and Taiwan. Furthermore, Chile, Croatia, Mexico, Romania, and the Russian Federation have unidirectional causality from SM to LP. As a result, in Brazil, China, Latvia, Lithuania and Taiwan, an increase in LP will result in an increase in SM, while in Chile, Croatia, Mexico, Romania and the Russian Federation, an increase in SM will result in an increase in LP. Additionally, there is a bidirectional causal relationship between these variables in Indonesia. As such, both LP and SM play a role in influencing each other in Indonesia, making it unique compared to the other countries mentioned. As a result of PFTY, empirical results in the relevant period show a bidirectional causal relationship between LP and SM. This indicates that the two factors are intertwined, resulting in Indonesia standing out from the other countries. Thus, it is evident that LP and SM have a reciprocal influence, as evidenced by the empirical results of PFTY.
Table 5. The Causal Relationship Between Legal System and Property Rights and Sound Money
|
LP does not cause SM |
SM does not cause LP |
|||||||||
|
Country |
Frequency |
Test Stat |
p-value |
Ülkeler |
Frequency |
Test Stat |
p-value |
Results |
||
|
Argentina |
2 |
5.9548541 |
0.106 |
Argentina |
2 |
0.071860449 |
0.968 |
LP ̶ SM |
||
|
Brazil |
1 |
7.2160924 |
0.086*** |
Brazil |
1 |
1.9619378 |
0.416 |
LP→SM |
||
|
Bulgaria |
2 |
0.66250249 |
0.442 |
Bulgaria |
2 |
1.1440703 |
0.346 |
LP ̶ SM |
||
|
Chile |
1 |
2.529604 |
0.36 |
Chile |
1 |
6.1356491 |
0.094*** |
LP←SM |
||
|
China |
1 |
12.524224 |
0.018** |
China |
1 |
0.14686573 |
0.932 |
LP→SM |
||
|
Colombia |
2 |
0.82373855 |
0.7 |
Colombia |
2 |
0.64393745 |
0.706 |
LP ̶ SM |
||
|
Crotia |
3 |
0.11538804 |
0.738 |
Crotia |
3 |
16.07083 |
0.000* |
LP←SM |
||
|
Czech Republic |
2 |
3.5279787 |
0.23 |
Czech Republic |
2 |
1.4803876 |
0.482 |
LP ̶ SM |
||
|
Hungary |
1 |
0.24933565 |
0.596 |
Hungary |
1 |
2.9745281 |
0.116 |
LP ̶ SM |
||
|
India |
1 |
1.321384 |
0.262 |
India |
1 |
0.057707589 |
0.824 |
LP ̶ SM |
||
|
Indonesia |
3 |
0.23670759 |
0.656 |
Indonesia |
3 |
0.41777386 |
0.516 |
LP ̶ SM |
||
|
Latvia |
3 |
9.6315948 |
0.008* |
Latvia |
3 |
0.13664818 |
0.768 |
LP→SM |
||
|
Lithuania |
3 |
10.657035 |
0.004* |
Lithuania |
3 |
0.33994362 |
0.608 |
LP→SM |
||
|
Malaysia |
3 |
1.2287171 |
0.286 |
Malaysia |
3 |
0.45558678 |
0.544 |
LP ̶ SM |
||
|
Mexico |
1 |
1.1013818 |
0.342 |
Mexico |
1 |
4.0548006 |
0.052*** |
LP←SM |
||
|
Philippines |
1 |
4.2827421 |
0.158 |
Philippines |
1 |
3.8573084 |
0.236 |
LP ̶ SM |
||
|
Poland |
1 |
0.160598 |
0.668 |
Poland |
1 |
0.059858141 |
0.83 |
LP ̶ SM |
||
|
Romania |
2 |
5.9988455 |
0.118 |
Romania |
2 |
13.483135 |
0.016** |
LP←SM |
||
|
Russian Federation |
1 |
1.0412463 |
0.61 |
Russian Federation |
1 |
36.995267 |
0.002* |
LP←SM |
||
|
South Africa |
1 |
0.80664675 |
0.382 |
South Africa |
1 |
2.5436014 |
0.116 |
LP ̶ SM |
||
|
Taiwan |
1 |
5.3974911 |
0.036** |
Taiwan |
1 |
0.000758542 |
0.976 |
LP→SM |
||
|
Thailand |
3 |
0.036226874 |
0.846 |
Thailand |
3 |
0.49557402 |
0.48 |
LP ̶ SM |
||
|
Turkey |
1 |
0.83358465 |
0.392 |
Turkey |
1 |
1.7819877 |
0.222 |
LP ̶ SM |
||
|
Ukraine |
2 |
0.031920555 |
0.88 |
Ukraine |
2 |
0.18853552 |
0.684 |
LP ̶ SM |
||
|
Panel Fisher |
- |
76.068995 |
0.006* |
Panel Fisher |
- |
INF |
0.000* |
LP↔SM |
||
Note: *, **, and *** show statistical significance at 1%, 5%, and 10%, respectively. “→” and “←” denote unidirectional causality, and “↔” shows bidirectional causality while “—” states no causal link between variables.
Table 5 confirms Table 3 and Table 4. Based on all three tables, bidirectional causality exists between these variables. Weak institutional quality affects monetary indicators across the board, making developing countries more vulnerable to financial shocks, because a long-term approach is required to increase institutional quality. Furthermore, if effective monetary policies are not established, the institution’s quality will suffer. As a result, this cycle continues. This relationship can be referred to as a monetary indicator–institutional quality trap. This trap becomes a vicious cycle, with no immediate resolution in sight. However, it is important to recognize that the only way to break this cycle is to make a concerted effort to improve institutional quality and implement effective monetary policies.
5. Conclusion
This study tested three different causal relationships between institutional quality and monetary indicators. Therefore, it can be concluded that the legal system and property rights are mutually causally related to the most recent year’s inflation, inflation standard deviation, and sound money. In the same way, monetary indicators are not only influenced by the financial market, but also by the quality of institutions. There are various aspects of causality that differ among countries. Consequently, this research highlights the importance of institution quality in influencing monetary indicators, as well as the complex and varied nature of the causal relationship between them.
There is evidence in this study that institutional quality has a significant impact on inflation rates and is responsible for the change in inflation rates over time. Consequently, improving the quality of institutions will also reduce volatility in inflation rates in that country. Thus, it is evident that focusing on building better institutional quality can lead to improved economic outcomes, including the stabilization of inflation rates. This is because improved institutional quality leads to better governance, which in turn leads to better macroeconomic management. This ultimately leads to a more stable macroeconomic environment, which will have a positive effect on inflation rates.
6. Discussion
It is important to examine the relationship between inflation and institutions in developing countries because they have exclusionary institutions, which, in essence, cause macroeconomic problems through political stability. Without low inflation in developing countries, economic indicators and political stability will be negatively affected. This circuit is likely to result in a long-term cyclical problem. Furthermore, the exclusionary institutions that exist in developing countries often lead to persistent inflationary pressure, which in turn can further destabilize macroeconomic conditions, leading to further economic disruption.
The central bank will be easily induced to monetize if its institutional quality is weak. In general, inflation is always a monetary phenomenon over the long run, but it can be disrupted by a number of factors on a short-term basis. Therefore, inflation targeting is more likely to succeed in countries with high inflation rates and volatile inflation. This is because the recovery will help control inflation expectations. In this way, both expected inflation costs (for example, shoe leather costs, menu costs, relative price deterioration) and unexpected inflation costs (changes in purchasing power) will be minimized. Several countries have successfully controlled inflation by applying the right policies. For example, India has been steadily decreasing its inflation rate since 2010, while its economy has been increasing.
A sound money system is also ensured by institutions’ credibility. Thus, countries must improve the quality of their institutions in order to build a fiduciary currency. They must also ensure that their monetary policies are consistent to achieve this. There is no need for a quantity theory to be valid to establish that there is a connection between institutional quality and inflation. Insofar as the New Keynesian model does not utilize quantity theory to predict inflation, institutional quality will affect the current inflation rate by impacting inflation expectations. As a result of these conditions, the quality of institutions in a country decreases not just in terms of the Central Bank but also for the general public as well. Then, it can be expected that the fiscal policy will worsen, the monetary policy will exert pressure on the budget balance in a Leeper (1991) manner, and this in turn will lead to an increase in inflation. For instance, in Venezuela, the Central Bank of Venezuela has been printing money to cover the budget deficit, which has led to a rapid increase in inflation and a devaluation of its currency (Pittaluga et al. 2020: 341) .
In contrast, the deterioration of price stability, coupled with the inability to provide a stable and sound monetary system, also affects the quality of the countries’ institutional structure. Because of price system instability, long-term contracts will not be possible. Due to the uncertainty in this environment, it is likely that individuals and corporations will behave in a short-term manner, which will result in incomplete contracts and property rights failure. It is expected that as a result of high inflation, the value of monetary assets will erode. These developments will destabilize political institutions in the context of rising market transaction costs. As the value of money decreases, the cost of goods and services will increase, meaning that long-term contracts that are priced in the currency will become increasingly difficult to execute and enforce. In addition, individuals and firms may be more likely to make decisions that are more focused on the short-term, leading to a lack of trust and an inability to form long-term relationships. Finally, the erosion of value in monetary assets will lead to a lack of political stability in the face of rising transaction costs.
References
Acemoglu, D., Johnson, S., Querubin, P., & Robinson, J. (2008). When does policy reform work? The case of Central Bank Independence. Brooking Papers on Economic Activity, (1), 351–421. https://doi.org/10.1353/eca.0.0002
Acemoglu, D., Johnson, S., Robinson, J., & Thaicharoen, Y. (2003). Institutional causes, macroeconomic symptoms: volatility, crises and growth. Journal of Monetary Economics, 50(1), 49-123. https://doi.org/10.1016/S0304-3932(02)00208-8
Acemoglu, D., & Robinson, J. A. (2019). Rents and economic development: the perspective of Why Nations Fail. Public Choice, 181, 13-28. https://doi.org/10.1007/s11127-019-00645-z
Aisen, A., & Veiga, F. (2008). Political instability and inflation volatility. Public Choice, 135, 207–223. https://doi.org/10.1007/s11127-007-9254-x
Berlemann, M., & Enkelmann, S. (2014). Institutions, Experiences and Inflation Aversion (No. 143). Diskussionspapier.
Bowles, S., & Carlin, W. (2020). Shrinking capitalism. In AEA Papers and Proceedings (Vol. 110, pp. 372-77). https://10.1257/pandp.20201001
Chugunov, I., Pasichnyi, M., Koroviy, V., Kaneva, T., & Nikitishin, A. (2021). Fiscal and monetary policy of economic development. European Journal of Sustainable Development, 10(1), 42-42. https://10.14207/ejsd.2021.v10n1p42
Dumitrescu, E. I., & Hurlin, C. (2012). Testing for Granger non-causality in heterogeneous panels. Economic Modelling, 29(4), 1450-1460. https://doi.org/10.1016/j.econmod.2012.02.014
Emirmahmutoglu, F., & Kose, N. (2011). Testing for Granger causality in heterogeneous mixed panels. Economic Modelling, 28(3), 870-876. https://doi.org/10.1016/j.econmod.2010.10.018
Ibarra, R., & Trupkin, D. R. (2016). Reexamining the relationship between inflation and growth: Do institutions matter in developing countries?. Economic Modelling, 52, 332-351. https://doi.org/10.1016/j.econmod.2015.09.011
Fazio, D. M., Silva, T. C., Tabak, B. M., & Cajueiro, D. O. (2018). Inflation targeting and financial stability: Does the quality of institutions matter?. Economic Modelling, 71, 1-15. https://doi.org/10.1016/j.econmod.2017.09.011
Fenira, M. (2014). Democracy: A determinant factor in reducing inflation. International Journal of Economics and Financial Issues, 4(2), 363. https://dergipark.org.tr/en/download/article-file/362867
Fisher R.A. (1932). Statistical Methods for Research Workers, 4th edn. Oliver & Boyd, Edinburgh
Garriga, A. C., & Rodriguez, C. M. (2020). More effective than we thought: Central bank independence and inflation in developing countries. Economic Modelling, 85, 87-105. https://doi.org/10.1016/j.econmod.2019.05.009
Khan, M. (2018). Institutions in Transformational Governance: Lessons for Africa. Africa Economic Brief, 9(8), 1-12.
Khan, M., & Hanif, W. (2020). Institutional quality and the relationship between inflation and economic growth. Empirical Economics, 58(2), 627-649. https://doi.org/10.1007/s00181-018-1479-7
Krause, S., & Méndez, F. (2008). Institutions, arrangements and preferences for inflation stability: Evidence and lessons from a panel data analysis. Journal of Macroeconomics, 30(1), 282-307. https://doi.org/10.1016/j.jmacro.2006.11.001
Law, C. H., & Soon, S. V. (2020). The impact of inflation on income inequality: The role of institutional quality. Applied Economics Letters, 27(21), 1735-1738. https://doi/full/10.1080/13504851.2020.1717425
Leeper, E. M. (1991). Equilibria under ‘active’ and ‘passive’ monetary and fiscal policies. Journal of Monetary Economics, 27(1), 129-147.
Lim, J. J. (2021). The limits of central bank independence for inflation performance. Public Choice, 186(3), 309-335. https://doi.org/10.1007/s11127-019-00771-8
Minea, A., Tapsoba, R., & Villieu, P. (2021). Inflation targeting adoption and institutional quality: Evidence from developing countries. The World Economy. Inflation targeting adoption and institutional quality: Evidence from developing countries. The World Economy. https://10.1111/twec.13074
Nazlioglu, S., Gormus, N. A., & Soytas, U. (2016). Oil prices and real estate investment trusts (REITs): Gradual-shift causality and volatility transmission analysis. Energy Economics, 60, 168-175. https://doi.org/10.1016/j.eneco.2016.09.009
Neyapti, B. (2012). Monetary institutions and inflation performance: Cross-country evidence. Journal of Economic Policy Reform, 15(4), 339-354. https://doi.org/10.1080/17487870.2012.731805
Peters, B. G. (2019). Institutional theory in political science: The new institutionalism. Edward Elgar Publishing.
Toda, H. Y., & Yamamoto, T. (1995). Statistical inference in vector autoregressions with possibly integrated processes. Journal of Econometrics, 66(1-2), 225-250. https://doi.org/10.1016/0304-4076(94)01616-8
Van Lelyveld, I. P. P. (2000). Inflation, Institutions, and Preferences (Doctoral dissertation, Radboud University Nijmegen).
Yilanci, V., & Gorus, M. S. (2020). Does economic globalization have predictive power for ecological footprint in MENA counties? A panel causality test with a Fourier function. Environmental science and pollution research, 27(32), 40552-40562.
1 The technical details of the relevant index can be accessed from the relevant link: https://www.fraserinstitute.org/sites/default/files/economic-freedom-of-the-world-2019-appendix.pdf - Accessed on 12.12.2021
2 In the chart in Figure 1, the numbers of the countries are as follows: Argentina (1), Brazil (2), Bulgaria (3), Chile (4), China (5), Colombia (6), Croatia (7), Czech Republic (8), Hungary (9), India (10), Indonesia (11), Latvia (12), Lithuania (13), Malaysia (14), Mexico (15), Phillippines (16), Poland (17), Romania (18), Russian Federation (19), South Africa (20), Taiwan (21), Thailand (22), Turkey (23) and Ukraine (24). Years start from 2000, and the first year is denoted by (0).