
Ekonomika ISSN 1392-1258 eISSN 2424-6166
2023, vol. 102(1), pp. 81–101 DOI: https://doi.org/10.15388/Ekon.2023.102.1.5
Esra Soyu Yıldırım**
Aksaray University, Vocational School of Social Sciences, 68200, Aksaray, Turkey
esrasoyu@aksaray.edu.tr
Munise Ilıkkan Özgür
Aksaray University, Faculty of Economics and Administrative Sciences, 68200, Aksaray, Turkey
mozgur@aksaray.edu.tr
Abstract. This study investigates the relationship between the geopolitical risk in Turkey arising out of the war and terror incidents happened in the region during the period 2003:01-2020:06 with the CDS premium. A two-step approach is undertaken for this assessment, in which an ARDL limit test and then a time-varying symmetric and asymmetric causality test are applied to study the possible causality vis-a-vis the subperiods. The ARDL limit test does not reject the hypothesis that there is a co-integrated relationship between CDS premium and geopolitical risk index. In addition, the time-varying symmetric and asymmetric test also identifies causality between CDS premium and geopolitical risk, and establishes periods where the latter influences the former variable both in a positive and negative way. In summary, both the ARDL limit test and the time-varying symmetric and asymmetric test deduce a causal relationship between the studied variables.
Keywords: CDS, Geopolitical Risk, ARDL, Time Varying Causality, Turkey
__________
* This assessment has been derived from Esra SOYU YILDIRIM’s PhD thesis titled “Three Essays on the Determinants of Turkey’s CDS Premium” supervised by Assoc. Prof. Munise ILIKKAN ÖZGÜR in 2022.
** Corresponding author.
Received: 10/11/2023. Revised: 22/12/2022. Accepted: 03/03/2023
Copyright © 2023 Esra Soyu Yıldırım, Munise Ilıkkan Özgür. Published by Vilnius University Press
This is an Open Access article distributed under the terms of the Creative Commons Attribution License, which permits unrestricted use, distribution, and reproduction in any medium, provided the original author and source are credited.
Geopolitical risk (GPR), as a global concept, is widely accepted as a critical factor playing an important role in the financial markets. Coupled with the exponential development of information technologies, the transactions made in the financial markets are facilitated to be more effective and efficient, thus causing the assets being traded in those markets to be more sensitive to the emergence of GPR shocks. This sensitivity can arise in several ways: (i) rising GPR uncertainty hampers the decision making process of market participants, (ii) rising GPR causes a cost increase for firms through its unfavorable impact on both demand and supply channels, (iii) rising GPR amplifies the risk of investing in the financial markets (Yang, Zhang, Yi & Peng, 2021). Therefore, it can be stated that GPR influences the investment propensity and makes investors more averse in their decision-making (Le & Tran, 2021). This might cause a negative impact on the investments undertaken in a country, whether foreign or domestic, and respectively, on the financial asset prices (Erb, Harvey & Viskanta, 1998; Harvey, Solnik & Zhou, 2002). Within this context, it is accepted that GPR plays an important role in the structuring of macroeconomic and financial cycles (Yang & Yang, 2021).
The concept of GPR represents the risks related to war, terrorism and tension among governments that influence the relationship between countries (Caldara & Iacoviello, 2018). Therefore, a myriad of factors such as terror incidents, wars, military and nuclear disputes in a country or in-between countries constitute geopolitical risk (Currie, Vaughan & Oluwakemi, 2008). As the twentieth century experienced various events like internal and international wars, political tension and terror attacks, the impact of civil wars on the global scale cannot be neglected. Plenty of developments such as September 11 attacks,1 Paris attacks, Brexit,2 the presidency of Donald Trump, the ongoing tension between North Korea and the United States caused a surge in geopolitical risks (Bouoiyour, Selmi, Hammoudeh & Wohar, 2019).
The decisions of the investors getting impacted from geopolitical events may have an effect on the currency flows. In the case of a currency exchange outflow, through the pressure it puts on balance of payments, the possibility that a country might default on the foreign debt obligations may increase. As a consequence of this chain reaction, the CDS premium, simply representing the credit risk (Chiaramonte & Casu, 2013), becomes a vital indicator an investor takes into account upon making an investment decision (European Central Bank (ECB), 2009), since a change in the risk level of a country is highly likely to be echoed in the CDS market (Chiaramonte & Casu, 2013; Bozkurt & Kaya, 2017). A common credit derivative known as CDS allows investors to acquire protection against the risk of default by an unrelated party known as an institutional or reference asset. CDS serves as an insurance contract for a bondholder (Longstaff et al., 2011).
It should be added that, for a long time, the investment decisions have been based on the respective ratings calculated by credit rating agencies. Nevertheless, these institutions have been widely criticized for the insufficiency of these ratings to thoroughly reflect the country-specific risks (Mora, 2006), leading countries to rely more on the CDS market to gather more comprehensive information regarding credit risks. Consequently, the pre-determinants of CDS premium, and their respective impact on the aforementioned dependent variable gain importance and within this context, the effects of risks arising out of Turkey’s geopolitical position on CDS premium constitute the main research topic of this assessment.
The reason why this study focuses on Turkey can be explained as follows: The country is located in a region where various events that can be considered as geopolitical risks occur on a frequent basis. Turkey, having hosted different civilizations, blends both eastern and western culture within, hence encapsulates a relatively higher level of political choices both on a global and a regional level. Numerous risk factors, such as political upheavals, terror attacks and wars, have contaminated the countries bordering or surrounding Turkey, and that the spillover effects of most of the problems in Middle East on the aforementioned country, emphasizes the importance of geopolitical risks.
Within this context, the objective of this study is to investigate the impact of geopolitical risks on the CDS premium of Turkey. Literature reviewed within this scope assesses the relationship between geopolitical risk and gold (Baur & Smales, 2018; Das, et al., 2019), bitcoin (Bouri et al., 2020; Aysan et al., 2019), real economy (Deng & Habib, 2021), economic growth (Akadiri et al., 2019; Soybilgen et al., 2019), tourism (Lee et al., 2020; Demir et al., 2020), stock market (Bouras et al., 2019; Chiang, 2021; Jiang et al., 2020; Gemici & Kılıç, 2019; Polat et al., 2021; Üçler & Özşahin, 2020; Sekmen, 2020; İltaş, 2020) and petroleum (Liu et al., 2019). In this step, only one study (Alptürk et al., 2021) investigating the interdependency between geopolitical risk and CDS premium is reviewed. This study aims to further that investigation by extending the studied period (from January 2003 to June 2020) and by simultaneously analyzing both the short- and long-term relationships between variables to gather consistent outputs with relatively less deviation in the case of small samples. On the other hand, as put forward by Tang (2008) and Arslantürk, Balcılar & Özdemir (2011), the correlation among variables may change over time. Therefore, the analysis of the relationship among variables via a time-varying causality method to identify varying causal interactions among factors in different periods constitutes another objective of this assessment.
This study uses the ARDL limit test and time-varying symmetric and asymmetric causality test to scrutinize the relationship between Turkey’s geopolitical risk index with its CDS premium in the period 2003:01–2020:06 and comprises six sections, namely: introduction, literature, data and model, methodology, empirical findings and conclusion.
The lemma that geopolitical risks are related to other risk areas has been emphasized by the World Economic Forum (2018), through a publication that maps the interactions among five risk categories, being (i) geopolitical risks (collapsed states, interstate conflicts, terror attacks, etc.), (ii) economic risks (financial crises, deflation, unmanageable inflation, illicit trade, failure of financial mechanisms or institutions, asset bubbles, unemployment, etc.), (iii) environmental risks (natural disasters, climate change, loss of biodiversity and collapse of the ecosystem), (iv) technological risks (cyberattacks) and (v) social risks (migration, social instability, water crises, food crises, spread of infectious diseases, failure of urban planning) (WEF, 2018). If the multi-faceted relationship and inter-dependencies among geopolitical risks and economy are taken into consideration, CDS premium, being an economic and financial activity, can be assumed to be affected by the geopolitical risk. Consequently, this study investigates the relationship between the two aforementioned variables and presents the literature on geopolitical risk reviewed within the scope (Table 1).
|
Authors and Year |
Method |
Findings |
|
|
Akadiri et al. (2019) |
1985Q1–2017Q4 Turkey |
Granger causality |
There exists a one way causality from GPR to growth and tourism. |
|
Aysan et al., (2019) |
18 July 2010–31 May 2018 |
OLS regression analysis |
The price volatility and return of Bitcoin has a positive and negative correlation with GPR, respectively. |
|
Baur & Smales (2018) |
January 1985–November 2017 |
OLS regression analysis |
The hypothesis that gold has a positive correlation with GPR is not rejected. |
|
Bouras et al. (2019) |
1998:11–2017:06 18 countries |
GARCH approach |
While the hypothesis that geopolitical risks of countries have a significant impact on stock market returns is rejected, a positive effect of the former variable on the volatility on the stock market is found, albeit statistically insignificant. |
|
Bouri et al. (2020) |
30 April 2013–31 October 2019 |
AR-GARCH model |
The price changes in Bitcoin are shown to be related to the changes in the geopolitical risk index. |
|
Chiang (2021) |
January 2000–May 2020 |
Dynamic conditional correlation model |
The correlation between returns on stocks–bonds and Economic Policy Uncertainty (EPU) are shown to be negative, whereas the correlation between returns on stocks-gold and GPR is calculated to be positive. |
|
Demir et al. (2020) |
January 1990–December 2018 Turkey |
NARDL model |
It is put forward that an increase in GPRI (Geopolitical Risk Index) causes a fall in the number of tourists visiting Turkey while no significant impact in the short-term is discovered in case of a decrease in the GPRI. |
|
Deng & Habib (2021) |
1985–2017 |
OLS regression analysis |
It is argued that geopolitical risk has an important influence over the real economy. |
|
Gemici & Kılıç (2019) |
October 1995–April 2019 BRICS-T |
Panel data analysis |
It is put forward that there is a long-term relationship between the stock market indices of the countries sampled and GPRI, except for Brazil and China. In addition, the indices with the most sensitivity are found to belong to Russia, India and Turkey. |
|
Hemrit (2021) |
2013–2019 |
ARDL |
The hypothesis that geopolitical risk and the uncertainty regarding the government’s economic policy has a negative short-term impact on insurance demand is not rejected. |
|
Jiang et al. (2020) |
January 2000– February 2019 |
Regression model |
The authors identify that GPR creates a permanent negative effect on the return on tourism stocks. |
|
Khan et al. (2020) |
1991–2018 9 countries |
Panel bootstrap Granger causality analysis |
It is deduced that causality from GPR to defense expenditures exists for China, India and Saudi Arabia; whereas this relationship is of an opposite direction when it comes to South Korea and Turkey. |
|
Lee et al. (2020) |
2005:01–2017:12 |
Panel data analysis |
Being one of the most important determinants of demand for tourism, geopolitical risk is calculated to have a negative impact on the aforementioned dependent variable. |
|
Liu et al. (2019) |
2 January 1986–31 May 2018 |
GARCH-MIDAS model |
It is identified that geopolitical risk causes volatility in the petroleum markets. |
|
Lu et al. (2020) |
1985–2018 18 countries |
Panel data analysis |
It is deduced that geopolitical risk has a negative impact on the domestic loans provided to the private sector. |
|
Mansour-Ichrakieh & Zeaiter (2020) |
January 2006–November 2018 |
Threshold VAR |
While higher GPR in Russia results in higher financial stability for Turkey, higher GPR in Saudi Arabia proceeds with higher financial fragility in Turkey. |
|
Polat et al. (2021) |
January 1998–October 2020 |
Hatemi-J causality test |
It is argued that an asymmetric relationship is prevalent between Turkey’s geopolitical risks and BIST tourism index. |
|
Qin et al. (2020) |
28 June 1990–31 October 2018 |
OLS model |
The authors discover the significant impact of geopolitical risk on crude oil returns. |
|
Sweidan (2021) |
1973:q1–2020: q1 US |
Cointegration analysis |
The hypothesis that geopolitical risk has a positive impact on the renewable energy allocation of the US is not rejected. |
|
Triki & Ben Maatoug (2021) |
January 1985–December 2018 |
MV-GARCH model |
The degree of correlation between S&P 500 with gold is calculated to have a positive correlation with the geopolitical risk index. |
|
Yalçınkaya & Daştan (2020) |
1992:Q1–2018:Q3 |
SVAR approach |
Global economic, political and geopolitical uncertainties have significant, negative and quantitative impacts in both short and long term on the main macroeconomic indicators of the Turkish economy. |
|
Alptürk et al. (2021) |
March 2010–October 2020 |
Hatemi-J causality test |
The changes in the geopolitical risk in Turkey are deduced to have an impact on the CDS premia. |
|
Üçler & Özşahin (2020) |
December 1987–August 2018 |
Kónya (2006) panel causality test |
The authors conclude that there exists a one way causality from geopolitical risk to stock market index in Argentina, Brazil, Mexico and Thailand. |
|
Sekmen (2020) |
January 1998–September 2019 14 countries |
Time varying causality test |
While the countries least affected by geopolitical risk in regard to stock market returns are found to be Israel and Brazil, Ukraine is shown to be the most vulnerable in the sample. The author also concludes that for Turkey, the stock market returns are relatively less sensitive to geopolitical risks. |
|
Buzdağlı & Özdemir (2021) |
1993–2018 17 countries |
Cointegration analysis |
It is argued that increases in the geopolitical risk index cause a hike in military expenditures. |
|
Arslan (2019) |
1994–2017 17 countries |
Panel data analysis |
The hypothesis that there is a negative correlation between foreign direct investments (FDI) and geopolitical risk is not rejected. |
|
Soybilgen et al. (2019) |
1986–2016 18 countries |
Panel data analysis |
It is discovered that an increase in the geopolitical risk index causes a decrease in the growth rates. |
|
Das et al. (2019) |
January 1985– December 2017 |
Regression analysis |
It is calculated that a surge in geopolitical risk has a positive impact on gold returns, in contrast to its negative effects on silver, platinum and palladium returns. |
|
İltaş (2020) |
January 1999– December 2014 Turkey |
Toda–Yamamoto and Hacker–Hatemi-J (2012) bootstrap causality test |
The author argues that whereas there is a two-way causal relationship between economic and political risk and BIST100, no causality can be deduced to exist between the latter variable and financial and geopolitical risk. |
Table 1 presents the literature focusing on geopolitical risk, reviewed within the scope of this study, where the relationship between the aforementioned phenomenon and other variables such as gold (Baur & Smales 2018, Das et al., 2019), bitcoin (Aysan et al. 2019, Bouri et. al. 2020), real economy (Deng & Habib 2021), economic growth (Akadiri et al. 2019, Soybilgen et al. 2019), tourism (Akadiri et al. 2019, Demir et al. 2020, Lee et al. 2020) , stock market (Bouras et al 2019, Chiang 2021, Gemici & Kılıç 2019, Jiang et al. 2020, Polat et al. 2021, Triki & Ben Maatoug 2021, Üçler & Özşahin 2020, Sekmen 2020, İltaş 2020), petroleum (Liu et al. 2019, Qin et al. 2020) and direct foreign investment (Arslan 2019) is investigated. Still, to the authors’ knowledge, apart from Alptürk et al. (2021) no study concentrating on the dependency between CDS premium and geopolitical risk is available.
This assessment investigates the relationship between CDS premium and geopolitical risk through data of a monthly frequency spanning the period 2003:01–2020:06. Eviews and Gauss program were used to analyze the data used in the study. The characteristics of the variables are presented in Table 2.
|
Type |
Code |
Variable |
Source |
|
Dependent Variable |
CDS |
Turkey’s 5-Year CDS Premium |
Bloomberg |
|
Independent Variable |
GPR |
Turkey’s Geopolitical Risk Index |
To analyze the association between the aforementioned variables, the model described below is developed.
Model:
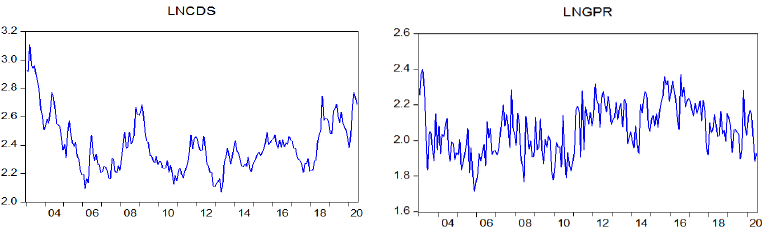
It can be inferred from Figure 1, where the logarithmic values of variables used in the analyses are graphed against time, that both CDS premium and geopolitical risk index fluctuate through the period studied.
The geopolitical risk index used in this assessment is developed by Caldara & Iacoviello (2019), by counting of the words related to geopolitical tensions that are published in 11 prestigious newspapers3 throughout the US and the globe. The words selected during the calculation are classified in six groups, namely (i) words that explicitly use notions related to geopolitical risk and words related to military tensions that involve US and the large regions of the world, (ii) words directly related to nuclear tensions, (iii) war threats, (iv) terrorist attacks, (v) words related to possible geopolitical events that may give rise to geopolitical uncertainties such as build up of war and/or terror. This assessment uses the geopolitical risk index calculated for Turkey by Caldara & Iacoviello (2019).
The identification of the existence of unit root in a time series analysis is of crucial importance since this test is undertaken to correctly assess the causality among variables and eliminate the fake regression problem. Since nonstationary time series could econometrically be misleading, necessary steps to make the series stationary are applied (Gujarati, 1995). Augmented Dickey and Fuller (1981) and Phillips and Perron (1988) unit root tests are used to investigate the stationarity of a time series.
The bound test approach developed by Pesaran and Shin (1995) and Pesaran, Shin and Smith (2001) is described as the ARDL method, which bears significant advantages compared to conventional cointegration approaches such as Engle–Granger and Johansen cointegration tests. In the model, the variables I(0) and I(1) can be used simultaneously without the prerequisite of being cointegrated at the same degree. Moreover, the test allows for the joint estimation of short and long term parameters, and it can be applied to small samples and still bears consistent and reliable outcomes despite limited number of observations (Pesaran et al., 2001; Narayan, 2004). Owing to these advantages, this study also utilizes the ARDL bound test approach, which is presented in the below equation:
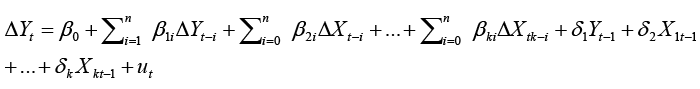 (1)
(1)
As the first step of this test, the optimal lag length is calculated. The existence of cointegration among series is determined vis-a-vis the test-statistics values, which are the lower bound I(0) and upper bound I(1) specified by Pesaran et al. (2001). These values are then compared to the calculated F statistical-value, and if the latter is higher than I(1), H0 is rejected to conclude that cointegration is prevalent; whereas if the F statistical value is lower than I(0), no proof of cointegration could be provided. The long-term relationship among variables is described via Equation (2).
 (2)
(2)
Short-term volatilities are represented in Equation (3)
 (3)
(3)
Error correction term represented by is µ a one-unit-lagged value of the residuals of the model where the long-term relationship is obtained and it shows the portion of the deviation in the short-term converging into the equilibrium in the longer run. It should also be emphasized that this coefficient needs to be statistically significant and vary between 0 and -1.
The application steps of ARDL bound test can be summarized as follows: Initially, the stationarity levels of the series and lag-length of the model are calculated via the unit root test. Then, the test-statistic table is constructed with the help of the optimal lag length identified in the previous step. Finally, short- and long-term coefficients are evaluated in case of existence of cointegration.
Time varying causality test is based on the bootstrap causality test developed by Hacker and Hatemi-J (2006), which allows for different stationarity levels and does not require the existence of cointegration among variables. Similar to Toda and Yamamoto (1995), the aforementioned test estimates the VAR model presented in Equation 4.
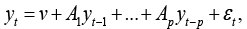 (4)
(4)
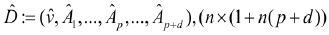
Here, yt, ν and εt are n-sized vectors, whereas ν represents the unit vector, Yt denotes the explanatory variable vector, εt is the error term vector and Ar stands for the n × n matrix of the parameters for the r number of lags. Moreover p and d indicate the lag length and the maximum cointegration degree of the variables, respectively (Hacker and Hatemi-J, 2006).
For the sample size T
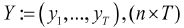 matrix is represented as
 matrix.
For 
Given that
 ,
, 
 , (n × T) sized matrix, VAR model is constructed as
  (Hacker and Hatemi-J, 2006).
Hacker and Hatemi-J (2006) argue that in the event that the MWALD test with a χ2 distribution is conducted via the bootstrap technique, problems such as misleading output arising due to the inability to ensure the correct size in a limited sample can be eliminated. Therefore the deviations in the estimate can be minimized.
Conventional causality tests take into account the whole period tested in the sample. Nevertheless, while some subperiods within the time span might support this causality, other subperiods may not demonstrate such an association, mainly due to the structural changes pertaining to the period studied, as advocated by Arslantürk, Balcılar & Özdemir (2011). In other words, time-varying causal relationships may be prevalent among variables. Consequently, the subperiods of the sample are taken into account in the time-varying causality test, in which these subperiods are represented as follows:
𝑡 = 𝜏 – 𝑙 + 1,𝜏 – 𝑙,…,𝜏, 𝜏 = 𝑙, 𝑙 + 1,…, 𝑇 (5)
l: presented in Equation (5) represent the number of rolling windows (Arslantürk, Balcılar & Özdemir, 2011). In the time-varying causality test, the number of windows should be identified to separate the time span into subperiods and this approach should be applied through a long period, as argued by Brooks & Hinich (1998). In light of this, and by an approach similar to Phillips, Shi & Yu (2015) and Caspi (2017), this study calculates the number of windows as 28.4 The test statistics obtained then can be compared to the bootstrap5 critical value calculated for each sample range. Therefore, not only the Wald test statistics but also the bootstrap critical values change with time. Then, the periodic test statistical value6 for each subperiod is calculated and the values are graphed to evaluate the Wald test statistics obtained, in which a causal relationship can be stipulated for the periods where these values are assessed to be more than 1 (Hatemi-J, 2021; Erdoğan, Gedikli & Kırca, 2019; Yılancı & Bozoklu, 2014).
Conventional causality tests (i.e. Granger (1969) and Toda and Yamamoto (1995)), as well as Sims (1972) and Hsiao (1981), accept the impacts of the positive and negative shocks to be of the same magnitude. Nevertheless, the effects of structural changes can bear difference, since, for instance, in financial markets, conditions such as the prevalence of asymmetric information or varying characteristics of market participants can lead to fluctuating reactions against positive and negative shocks. Under these circumstances, causality analyses like Granger (1969), Toda and Yamamoto (1995) and Hacker & Hatemi-J (2006) may lead to misleading outcomes.
Hatemi-J (2012) has developed the Granger & Yoon (2002) approach and adapted it into a causality analysis, in which the main lemma suggests that positive and negative shocks may have asymmetric structures due to different causal associations.
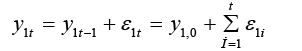
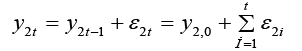
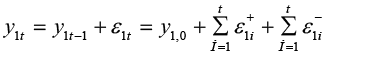
Hatemi-J (2012) defines two cointegrated series y1t and y2t, whose causal relationship is being investigated as follows:
 (6)
(6)
 (7)
(7)
In the definitions, y1,0 and y2,0 represent the initial values, whereas ε1i and ε2i denote the sum of shocks prevalent within the variables. These shocks are described below:
 ,
, 
 ,
,  (8)
(8)
 and
and 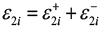
If, by using these equations, the variables y1i and y2i are redefined:
 (9)
(9)

Negative and positive shocks within each variable are demonstrated in Equation (10) through the accumulated form, where  and
and  represent the positive and negative shocks of the first variable; and
  and
and  denote the positive and negative shocks of the second variable, respectively.
 ,
,  ,
,  ,
,  , (10)
Time varying asymmetric causality test examines the consistency of the causal association between positive and negative shocks. Akin to the symmetrical analysis, this analysis also takes the subsample size as 28 and undertakes similar steps. In addition, the optimal lag length is determined via the information criteria proposed by Hatemi-J (2003) and, in line with Dolado & Lütkopohl’s (1996) argument, an additional lag is incorporated into the VAR model developed by taking this lag length into account.
Initially, a stationarity test is conducted to scrutinize the relationship between geopolitical risks and CDS premium in Turkey. The descriptive statistics of variables are presented in Table 3.
|
LNCDS |
LNGPR |
|
|
Mean |
2.3985 |
2.0641 |
|
Median |
2.3733 |
2.0691 |
|
Maximum Value |
3.1076 |
2.4011 |
|
Minimum Value |
2.0711 |
1.7119 |
|
Standard Deviation |
0.1889 |
0.1412 |
|
Skewness |
1.0380 |
0.0144 |
|
Kurtosis |
4.1497 |
2.3609 |
|
Jarque-Bera Test |
49.2790 |
3.5852 |
|
Probability |
0.0000 |
0.1665 |
|
Summary |
503.1890 |
433.9724 |
|
Summary Standard Deviation |
7.4578 |
4.1682 |
|
Number of Observations |
210 |
210 |
This assessment uses ADF and PP as linear unit root tests, of whose results are presented in Table 4.
|
Var. |
ADF |
PP |
||||||||
|
At Level |
First Difference |
At Level |
First Difference |
|||||||
|
Test sta. |
Prob |
Test sta. |
Prob |
Test sta. |
Prob |
Test sta. |
Prob |
Result |
||
|
Intercept |
LNCDS |
-2.367 |
0.152 |
-15.591 |
0.000 |
-2.391 |
0.145 |
-15.852 |
0.000 |
I(1) |
|
LNGPR |
-5.667 |
0.000 |
-7.367 |
0.000 |
I(0) |
|||||
|
Fixed and Intercept |
LNCDS |
-2.302 |
0.430 |
-15.627 |
0.000 |
-2.338 |
0.411 |
-16.075 |
0.000 |
I(1) |
|
LNGPR |
-8.007 |
0.000 |
-8.165 |
0.000 |
I(0) |
|||||
Outcomes put forward in Table 4 demonstrate that LNCDS is stationary at difference for both models, thus I(1); whereas the variable LNGPR is stationary at level, hence I(0), leading to the conclusion that none of the variables are I(2).
The selection where CDS premium and geopolitical risk are constructed as the dependent and independent variables of the model, respectively, is graphed in Figure 2.

AIC critical value7 is taken into account for the calculation of lag length and the one that satisfies the lowest critical value is determined as the lag length of the model. Within the context of the (1,0) model chosen, the cointegration relationship between variables is exhibited via the limit test, and the results are demonstrated in Table 5.
|
Degree of Significance |
k |
F Statistics |
Minimum Limit |
Maximum Limit |
|
10% |
1 |
5.9702 |
4.04 |
4.78 |
|
5% |
1 |
5.9702 |
4.94 |
5.73 |
|
1% |
1 |
5.9702 |
6.84 |
7.84 |
Table 5 exhibits the F-statistics value (5.970234) to be higher than maximum critical level in both 5% and 10% degrees of significance, leading to the nonrejection of the hypothesis that a long-term cointegration relationship is prevalent among variables. In other words, ARDL limit test outcomes put forward that there is long-term cointegration between CDS premium and geopolitical risk index.
To ensure consistency and completeness, autocorrelation should not exist in both the series in question and the ARDL equation. The outputs of the application conducted to test autocorrelation (Breusch–Godfrey autocorrelation LM test) are shown in Table 6, where the probability level being higher than 0.05 significance level is inferred as the nonrejection of the hypothesis of “nonexistence of autocorrelation”. Therefore, it can be concluded that the assumption of no autocorrelation is consistent. Since 0.7564 is higher than 0.05, it can be stated that no autocorrelation exists among series.
|
F-sta. |
0.2731 |
Prob. F(2.204) |
0.7612 |
|
Obs*R-squared |
0.5582 |
Prob. Chi-Square(2) |
0.7564 |
In order to test heteroskedasticity in the model estimated by ARDL, the Breusch–Pagan Godfrey test is applied, outcomes of which are exhibited in Table 7. Since the test statistics show that 0.1776>0.05, the hypothesis of existence of heteroskedasticity can be rejected.
|
F-sta. |
1.7317 |
Prob. F(2.206) |
0.1795 |
|
Obs*R-squared |
3.4559 |
Prob. Chi-Square(2) |
0.1776 |
This assessment also forecasts the coefficients and signs of the variables in the long-term relationship estimated between CDS premium and geopolitical risk (Table 8).
|
Variable |
Coefficient |
Standard Error |
t-statistic |
Probability |
|
LNGPR |
0.4140 |
0.4207 |
0.9840 |
0.3263 |
|
C |
1.5289 |
0.8712 |
1.7550 |
0.0807 |
Table 8 proposes that a 1% increase in geopolitical risk may result in a 0.4140 unit surge in CDS premium, surmising a positive cointegration among the variables in question. In addition, because the probability level of the geopolitical risk index is calculated to be more than 5%, a meaningful statistical inference cannot be made, therefore it can be concluded that the geopolitical risk index is relatively inelastic vis-a-vis the CDS premium in the long run.
In order to inspect the error correction mechanism that shows the speed of elimination of deviations from long-run steady state, arising out of any kind of shock, the estimation results of the short-term error correction model, which are shown in Table 9, are also scrutinized.
|
Variable |
Coefficient |
Standard Error |
t-statistics |
Probability |
|
D(LNGPR) |
0.0346 |
0.0338 |
1.0257 |
0.3062 |
|
CointEq(-1) |
-0.0837 |
0.0253 |
-3.3101 |
0.0011*** |
CointEq(-1) displayed in Table 9 represents the error correction term. It should be emphasized that the evaluation of the significance and sign of the error correction term is of crucial importance. If this term is statistically significant and has a negative sign, it can be interpreted that the error correction model is effective and the short-term volatilities are eliminated in the long run. In light of this, Table 9 demonstrates the coefficient to be negative (-0.08) and significant.
Pretest results show that the model is successful in its estimation. Still, it should be noted that in the studied period, one or multiple structural fractures can be experienced due to structural changes. Therefore, in order to test for the reliability of the investigation output, the CUSUM structural stability test proposed by Brown et al. (1975) is applied, which essentially aims to identify the prevalence of any type of structural change in the data. Figure 3 displays the outcome of the CUSUM (Cumulative Sum of Consecutive Errors) test.
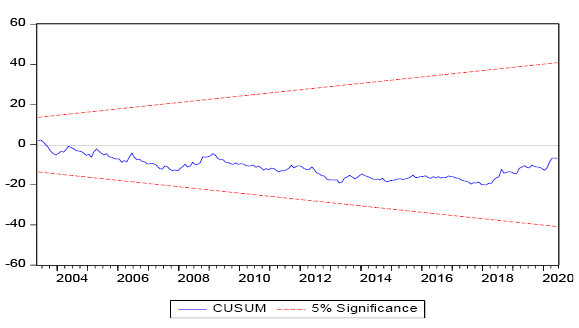
CUSUM test outputs graphed in Figure 3 range between the critical limits demonstrating 5% statistical significance, leading the authors to conclude that the assessed parameters have not been subjected to any type of structural instability in the studied period.
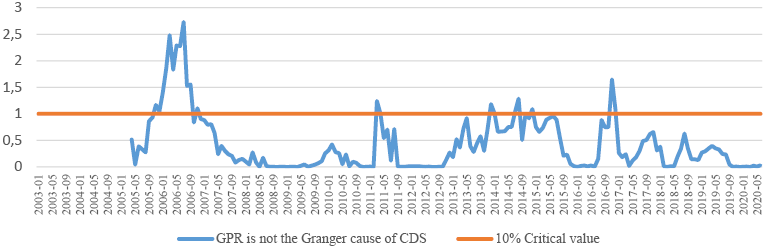
The outcomes of time varying symmetric causality analysis are presented in Figure 4, which demonstrates that the causal relationship between CDS and geopolitical risk in Turkey substantiated in the periods 2003:08–2006:11 and 2008:12–2016:12.
Political developments may give rise to geopolitical risk, and create unfavorable impacts on countries via financial, macroeconomic and economic policy uncertainties. Turkey is one of the few countries with a rich history of both political and geopolitical events, as many incidents can be pinpointed in the periods where causality is found to be existent. Still, a time-varying asymmetric causality analysis is applied to be able to thoroughly evaluate the positive or unfavorable impact of those events, and the consequent outcomes are presented in Figure 5.
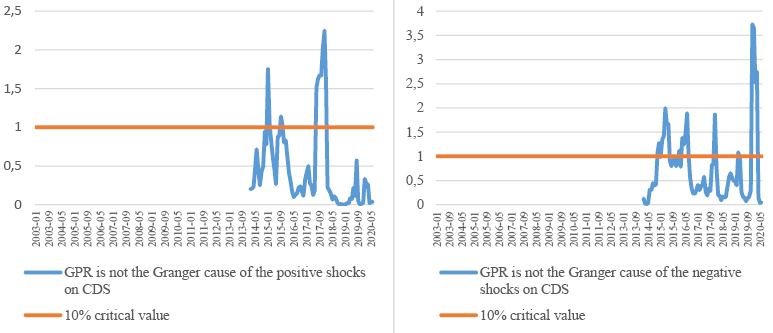
Positive and negative shocks are displayed in the left and right hand side of Figure 5, respectively, which demonstrates that causality exists from positive geopolitical shocks to positive CDS shocks in the period 2002:10–2018:01; and from negative geopolitical shocks to negative CDS shocks in the period 2012:08–2020:03. It should be emphasized that these periods, where causality is identified, are marked by various geopolitical events that had a direct impact on Turkey, such as the Arab Spring,8 turmoil in Middle East, Turkish F-4 Phantom shootdown by Syria (June 2012), Turkey–ISIS clash (2013–...), Russia–Ukraine crisis9 (February 2014), Russian Su-24 shootdown by Turkey (November 2015), Paris terror attacks (November 2015), Turkey’s cross border military operations in Syria (2015, 2016, 2018 and 2020). These incidents emphasize that Middle East is a region constantly facing geopolitical tensions such as political instability, military conflict and terror threats, and coupled with the Arab Spring; war and terror has lead to unfortunate events in Turkey. Within this context, it is striking that in the periods where the asymmetric causality test discovers a causal relationship between CDS premium and geopolitical risk, a series of events have been experienced, a majority of which falls into negative shock periods.
The exponential changes experienced in the world economy in recent years have accelerated financial liberalization, which resulted in the facilitation of technological developments and capital flows across countries. Nevertheless, this has exposed investors to risks that are difficult to foresee and/or manage, one of them being the geopolitical risk, a derivative of political risk. These risks do not only comprise local terror attacks but also contain all global uncertainties such as war risks, military threats and international tensions. Moreover, these uncertainties give rise to geopolitical risk and trigger the ambiguity regarding financial markets and economic outcomes.
This study aims to analyze the relationship between geopolitical risk and CDS premium in Turkey via ARDL limit test and time varying symmetric and asymmetric causality test. The former test stipulates that cointegration exists between the aforementioned variables. Time varying symmetric causality test posits that the causality among CDS premium and geopolitical risk in Turkey took place in the periods 2003:08–2006:11, 2008:12–2011:04 and 2011:09–2016:12. Time varying asymmetric causality test puts forward that geopolitical risk has a positive and negative impact on the aforementioned dependent variable in the periods 2020:10–2018:01 and 2012:08–2020:03, respectively.
All the tests conducted within this assessment support the hypothesis that a relationship is prevalent between the CDS premium of Turkey and the geopolitical risk index, and the outcomes of these applications are in line with Alptürk et al. (2021) which focuses on the same interdependencies. Two main arguments should be emphasized. First, geopolitical risk is found to have a nonnegligible impact on Turkey’s CDS premium. Second, the timing of the results of the time-varying symmetric and asymmetric causality test and geopolitical events coincide, which asserts the importance of this assessment. In addition, both the reviewed literature and the results of the current study prove the relationship between geopolitical risks and economic and financial variables.
When a general evaluation is made, military tensions, economic uncertainties and political problems in the countries where investment is planned bring along important macroeconomic problems and imbalances in that country. If the risks increase, the investor can quickly withdraw his capital from the country in which he intends to invest. This causes a capital outflow. Therefore, the decisions of investors affected by geopolitical events may affect foreign exchange inflows and outflows to countries. In cases of foreign exchange outflow, as a result of the pressure on the balance of payments, the problem of the country’s inability to pay its foreign debts (the probability of default) comes to the fore. In addition, geopolitical risks that cause financial instability are an important factor that negatively affects financial markets and investment decisions. Especially in developing countries, it reduces the profits of companies and the prices of stocks traded in the stock markets in these countries, and increases the risk premiums of financial instruments such as bonds and bills. Thus, the amount of foreign direct investment towards countries decreases significantly. At the end of this chain interaction, geopolitical risks may lead to the postponement of investments and structural reforms. It can damage consumers’ trust in the economy and the government. Therefore, economic contractions can be experienced due to the decrease in consumption. In other words, high geopolitical risk levels can harm the investability profile and democracy of countries. This situation shows how important geopolitical risks are to national economies.
In Turkey, there are a number of variables that contribute to increased geopolitical risk, including both domestic and international issues. The conflict between Russia and Ukraine, the Iranian uprisings, the threat of terrorism from northern Iraq and northern Syria, the unrest in Greece, and other geopolitical challenges all center on Turkey. It is also evident that regional and international issues like immigration laws, the economic repercussions of COVID-19, and the earthquakes known as the disaster of the century (the Kahramanmaraş earthquakes) have a direct or indirect impact on Turkey’s geopolitical and security situation. Turkey’s normalization efforts are crucial to lowering geopolitical risk in light of all of this. For instance, it is believed that events like Turkey’s signal to normalize relations with the Syrian government in 2022, its function as a mediator during the Russia–Ukraine war, and the Grain Corridor Agreement will lower the country’s risk level. The war against terrorism in Turkey will continue in 2023 on both a domestic and international level. Moreover, efforts at normalization and reconciliation with numerous nations will be made.
Therefore, the more the geopolitical risk in Turkey can be kept under control, the more its impact on economic and financial variables will disappear. In this respect, it is important to analyze the factors that may increase the geopolitical risk in Turkey and to adopt appropriate policy practices to mitigate these risks. Thus, with the policies designed to minimize the geopolitical risk, the problems that will disrupt the economic and financial stability of the country will be prevented.
Akadiri, S. S., Eluwole, K. K., Akadiri, A. C. & Avci, T. (2019). Does Causality Between Geopolitical Risk, Tourism and Economic Growth Matter? Evidence from Turkey. Journal of Hospitality and Tourism Management, 43, 273-277. https://doi.org/10.1016/j.jhtm.2019.09.002
Alptürk, Y., Sezal, L. & Gürsoy, S. (2021). Türkiye’de Jeopolitik Risk ile CDS Primleri Arasındaki İlişki: Asimetrik Nedensellik Analizi. Çukurova Üniversitesi İİBF Dergisi, 25(1), 107-126. https://doi.org/10.51945/cuiibfd.900224
Arslan, C. K. (2019). Jeopolitik Riskin Doğrudan Yabancı Yatırımlar Üzerindeki Etkisi. Avrasya Sosyal ve Ekonomi Araştırmaları Dergisi (ASEAD), 6(6), 435-441.
Arslantürk, Y., Balcılar, M. & Özdemir, Z. A. (2011). Time-Varying Linkages Between Tourism Receipts and Economic Growth in A Small Open Economy. Economic Modelling, 28(1-2), 664-671. https://doi.org/10.1016/j.econmod.2010.06.003
Aysan, A. F., Demir, E., Gozgor, G. & Lau, C. K. M. (2019). Effects of the Geopolitical Risks on Bitcoin Returns and Volatility. Research in International Business and Finance, 47, 511-518. https://doi.org/10.1016/j.ribaf.2018.09.011
Baur, D. G. & Smales, L. (2018). Gold and Geopolitical Risk. SSRN: https://ssrn.com/abstract=3109136 http://dx.doi.org/10.2139/ssrn.3109136
Bouoiyour, J., Selmi, R., Hammoudeh, S. & Wohar, M. E. (2019). What are the Categories of Geopolitical Risks That Could Drive Oil Prices Haigher? Acts or Threats? Energy Economics, 84, 1-14.
Bouras, C., Christou, C., Gupta, R. & Suleman, T. (2019). Geopolitical Risks, Returns, and Volatility in Emerging Stock Markets: Evidence From A Panel GARCH Model. Emerging Markets Finance and Trade, 55(8), 1841-1856. https://doi.org/10.1080/1540496X.2018.1507906
Bouri, E., Gupta, R. & Vo, X. V. (2020). Jumps in Geopolitical Risk and the Cryptocurrency Market: The Singularity of Bitcoin, Defence and Peace Economics. Working Paper 2020, 15, 1-16.
Bozkurt, I. & Kaya, M. V. (2018). Arap Baharı Coğrafyasından Gelen Haberleri̇n CDS Pri̇mleri Üzeri̇ndeki Etki̇si̇: Türki̇ye Örneği̇. Uluslararası İktisadi ve İdari İncelemeler Dergisi -JEAS, 20, 1-16.
Brown, R. L., Durbin, J. & Evans, J.M. (1975). Techniques for Testing the Constancy of Regression Relationships over Time. Journal of the Royal Statistical Society, 37(2), 149-192.
Brooks, C. & Hinich, M. (1998). Episodic Nonstationarity in Exchange Rates. Appl. Econ. Lett., 5(11), 719-722.
Buzdağlı, Ö. & Özdemir, D. (2021). Jeopolitik Risk Endeksinin Askeri Harcamalar Üzerindeki Etkisi, Süleyman Demirel Üniversitesi Vizyoner Dergisi, 12(29), 188-203. https://doi.org/10.21076/vizyoner.761633
Caldara, D. & Iacoviello, M. (2018). Measuring Geopolitical Risk. Board of Governors of the Federal Reserve Board Working Paper, Version: January 10, 2018.
Caldara, D. & Iacoviello, M. (2019). Measuring Geopolitical Risk. FRB International Finance Discussion Paper, (1222).
Caspi, I. (2017). Rtadf: Testing For Bubbles With Eviews. Journal of Statistical Software, 81(1), 1-16.
Chiang, T. C. (2021). Geopolitical Risk, Economic Policy Uncertainty and Asset Returns in Chinese Financial Markets. China Finance Review, 11(4), 474-501.
Chiaramonte, L. & Casu, B. (2013). The Determinants of Bank CDS Spreads: Evidence from the Financial Crisis. The European Journal of Finance, 19(9), 861-887.
Currie, W. L., Vaughan, M. & Oluwakemi, A. (2008). Knowledge Process Outsourcing in Financial Services: The Vendor Perspective. European Management Journal, 26(2), 94-104. https://doi.org/10.1016/j.emj.2007.11.002
Das, D., Kannadhasan, M. & Bhattacharyya, M. (2019). Geopolitical Risk and Precious Metals. Journal of Economic Research, 24, 49-66.
Demir, E., Simonyan, S., Chen, M. H. & Lau, C. K. M. (2020). Asymmetric Effects of Geopolitical Risks on Turkey’s Tourist Arrivals. Journal of Hospitality and Tourism Management, 45, 23-26. https://doi.org/10.1016/j.jhtm.2020.04.006
Deng, X. & Habib, A. (2021). Geopolitical Risk and Technological Innovation. 8 Eylül 2021 tarihinde https://www.efmaefm.org/0efmameetıngs/efma%20annual%20meetıngs/2021-leeds/papers/efma%202021_stage-2049_question-full%20paper_id-361.pdf adresinden erişilmiştir.
Dickey, D. A. & Fuller, W. A. (1979). Distribution of the Estimators for Autoregressive Time Series with A Unit Root. Journal of The American Statistical Association, 74 (366a), 427-431.
Dickey, D. A. & Fuller, W. A. (1981). Likelihood Ratio Statistics for Autoregressive Time Series with a Unit Root. Econometrica, 49(4), 1057-1072.
Dolado, J. & Lütkepohl, H. (1996). Making Wald Tests Work for Cointegrated VAR Systems. Econometric Theory, 15(4), 369-386.
Ece, N. J. (2022). Rusya-Ukrayna Savaşı’nın Dış Ticaret ve Küresel Güvenliğe Etkisi: Montrö Boğazlar Sözleşmesinin Savaşın Genişlemesinin Önlenmesine Katkısı, Kent Akademisi Dergisi, 15(3):1391-1412. https://doi.org/10.35674/kent.1132664
Erb, C., Harvey, C. & Viskanta, T. (1998). Risk in Emerging Markets. The Financial Survey, 42-46.
Erdoğan, S., Gedikli, A. & Kırca, M. (2019). A Note on Time-Varying Causality Between Natural Gas Consumption and Economic Growth in Turkey. Resources Policy, 64, 1–7. https://doi.org/10.1016/j.resourpol.2019.101504
Eryılmaz, F. (2022). Rusya-Ukrayna Krizinin Türkiye Ekonomisine Etkileri. https://btsoekonomi.com/haber-detay/rusya-ukrayna-krizinin-turkiye-ekonomisine etkileri (19.12.2022).
European Central Bank (ECB). (2009). Credit Default Swaps and Counterparty Risk. European Central Bank (ECB), Frankfurt, August.
Gemici, E. & Kılıç, Y. (2019). Jeopolitik Risk Altında Finansal Piyasalar: BRICS-T Ülkeleri Örneği, İşletme Fakültesi, 738-752.
Göçer, İ. & Çınar, S. (2015). Arap Baharı’nın Nedenleri, Uluslararası İlişkiler Boyutu ve Türkiye’nin Dış Ticaret ve Turizm Gelirlerine Etkileri. Kafkas Üniversitesi İktisadi ve İdari Bilimler Fakültesi Dergisi, 6(10), 51-68.
Granger, C. (1969). Investigating Causal Relations by Econometric Models and Crossspectral Methods. Econometrica, 37(3), 424-438.
Granger, C. & Yoon, G. (2002). Hidden Cointegration (No. 2002–02).
Gujarati, D. N. (1995). Basic Econometrics (Third edit). McGraw Hill Com. Inc.
Hacker, R. & Hatemi-J, A. (2006). Tests for Causality Between Integrated Variables Using Asymptotic and Bootstrap Distributions: Theory and Application. Appl. Econ., 38(13), 1489-1500.
Harvey, C.R., Solnik, B. & Zhou, G. (2002). What Determines Expected International Asset Returns?, Annals of Economics and Finance, 3(2), 249-98.
Hatemi-J, A. (2003). A New Method to Choose Optimal Lag Order in Stable and Unstable VAR Models. Applied Economics Letters, 10(3), 135-137. https://doi.org/10.1080/1350485022000041050
Hatemi-J, A. (2012). Asymmetric Causality Tests With an Application. Empirical Economics, 43(1), 447-456. https://doi.org/10.1007/s00181-011-0484-x
Hatemi-J, A. (2021). Dynamic Asymmetric Causality Tests with an Application. Papers 2106.07612, arXiv.org.
Hsiao, C. (1981). Autoregressive Modelling and Money-Income Causality Detection. Journal of Monetary Economics, 7(1), 85-106.
Hemrit, W. (2021). Does İnsurance Demand React to Economic Policy Uncertainty and Geopolitical Risk? Evidence From Saudi Arabia. The Geneva Papers on Risk and Insurance - Issues and Practice, https://doi.org/10.1057/s41288-021-00229-3
Iltas, Y. (2020). Farklı Risk Türleri ve Borsa Endeksi Arasındaki İlişki: Türkiye için Nedensellik Testleri. Business and Economics Research Journal, 11(2), 371-384.
Jiang, Y., Tian, G., Wu, Y. & Mo, B. (2022). Impacts of Geopolitical Risks and Economic Policy Uncertainty on Chinese Tourism-Listed Company Stock. International Journal of Finance & Economics, 27(1), 320-333.
Keyman, F. (2022). Ukrayna savaşı: Jeopolitik değişim, yaşamsal yıkım, Türkiye. https://www.politikyol.com/ukrayna-savasi-jeopolitik-degisim-yasamsal-yikim-turkiye/ (19.12.2022).
Khan, K., Su, C. W. & Rizvi, S. K. A. (2020). Guns and Blood: A Review of Geopolitical Risk and Defence Expenditures, Defence and Peace Economics, 1-17.
Koçak, M. (2022). Rusya-Ukrayna savaşının Türkiye için doğurabileceği sonuçları. https://www.aa.com.tr/tr/analiz/gorus-rusya-ukrayna-savasinin-turkiyeye-etkileri/2519470# (19.12.2022).
Le, A-T. & Tran, T. P. (2021). Does Geopolitical Risk Matter for Corporate Investment? Evidence from Emerging Countries in Asia. Journal of Multinational Financial Management, 62, 1-18.
Lee, C. C., Williams, G. O. & Akadiri, S. S. (2020). Geopolitical Risk and Tourism: Evidence From Dynamic Heterogeneous Panel Models. International Journal of Tourism Research, 23(1), 26-38. https://doi.org/10.1002%2Fjtr.2389
Liu, J., Ma, F., Tang, Y. & Zhang, Y. (2019). Geopolitical Risk and Oil Volatility: A New Insight. Energy Economics, 84, 1-10.
Longstaff, F. A., Pan, J., Pedersen, L. H. ve Singleton, K. J. (2011). How Sovereign is Sovereign Credit Risk?. American Economic Journal: Macroeconomics, 3(2), 75-103.
Lu, Z., Gozgor, G., Huang, M. & Lau, C. K. M. (2020). The Impact of Geopolitical Risks on Financial Development: Evidence from Emerging Markets. Journal of Competitiveness, 12(1), 93–107.
Mansour-Ichrakieh, L. & Zeaiter, H. (2019). The Role of Geopolitical Risks on the Turkish Economy Opportunity or Threat. North American Journal of Economics and Finance, 50, 1-15. http://dx.doi.org/10.1016/j.najef.2019.101000
Mora, N. (2006). Sovereign Credit Ratings: Guilty Beyond Reasonable Doubt? Journal of Banking & Finance, 1(30), 2041-2062.
Narayan, P. K. (2004). Reformulating Critical Values for the Bounds F-Statistics Approach to Cointegration: An Application to the Tourism Demand Model For Fiji. Discussion Papers-Department of Economics Monash University, 02/04(2), 1-32.
Neacşu, M.C., Neguţ, S. & Vlăsceanu, G. (2018). The Impact of Geopolitical Risks on Tourism. Amfiteatru Economic, 20, 870-884. http://dx.doi.org/10.24818/EA/2018/S12/870
Özcan, C. C. (2022). Ukrayna-Rusya Savaşının Türkiye Turizmine Etkileri: Güncel Bir Değerlendirme. ULİSA12, Sayı 15, https://aybu.edu.tr/GetFile?id=59940f5f-4463-4e92-83e2-f681a51a0033.pdf
Pesaran, M. H. & Shin, Y. (1995). Long-run Structural Modelling. Cambridge, Department of Applied Economics, University of Cambridge.
Pesaran, M. H., Shin, Y. & Smith, R. J. (2001). Bounds Testing Approaches to the Analysis of Level Relationships. Journal Of Applied Econometrics, 16(3), 289-326.
Phillips, P. C. & Perron, P. (1988). Testing For A Unit Root in Time Series Regression, Biometrika, 75(2), 335-346.
Phillips P. C., Shi S. & Yu, J. (2015). Testing for Multiple Bubbles: Historical Episodes of Exuberance and Collapse in the S&P500. International Economic Review, 56(4), 1043-1078. https://doi.org/10.1111/iere.12132
Polat, M., Alptürk, Y. & Gürsoy, S. (2021). Impact Of Geopolitical Risk on BIST Tourism Index and Tourist Arrivals in Turkey. Journal of Tourism Theory and Research, 7(2), 77-84. https://doi.org/10.24288/jttr.926617
Qin, Y., Hong, K. Chen, J. & Zhang, Z. (2020). Asymmetric Effects of Geopolitical Risks on Energy Returns and Volatility Under Different Market Conditions. Energy Economics, 1-10.
Sekmen, T. (2020). Gelişmekte Olan Ülkelerde Jeopolitik Riskler ve Borsa Davranışları: Zamanla Değişen Nedensellik Yaklaşımı. Eskişehir Osmangazi Üniversitesi Sosyal Bilimler Dergisi, 21(2), 359-381.
Sims, C. (1972). Money, Income, and Causality. American Economic Review, 62(4), 540-552.
Soybilgen, B., Kaya, H. & Dedeoglu, D. (2019). Evaluating the Effect of Geopolitical Risks on the Growth Rates of Emerging Countries. Economics Bulletin, 39(1), 717-725.
Sweidan, O. D. (2021). The Geopolitical Risk Effect on the US Renewable Energy Deployment, Journal of Cleaner Production, 293, 1-10.
Tang, C. F. (2008). Wagner’s Law Versus Keynesian Hypothesis: New evidence From Recursive Regression Based Causality Approaches, ICFAI Journal of Public Finance, 6(4), 29-38.
Toda, H. & Yamamoto, T. (1995). Statistical Inference in Vector Autoregressions with Possibly Integrated Processes. J. Econom., 66(1), 225-250.
Triki, M. B. & Maatoug, B. A. (2021). The Gold Market As a Safe Haven Against the Stock Market Uncertainty: Evidence From Geopolitical Risk. Resources Policy, 101872. https://doi.org/10.1016/j.resourpol.2020.101872
Uçak, H. (2022). Ukrayna Savaşı’nın Ekonomik Etkileri: Tarım. ULİSA12, Sayı 15, https://aybu.edu.tr/GetFile?id=59940f5f-4463-4e92-83e2-f681a51a0033.pdf
Üçler, G. & Özşahin, Ş. (2020). Jeopolitik Risk ve Borsa Endeksinin Nedensellik Analizi: Gelişmekte Olan Ülkeler Üzerine Bootstrap Panel Nedensellik Testi. Muhasebe ve Finansman Dergisi, (87), 167-180. http://dx.doi.org/10.25095/mufad.756266
World Economic Forum (WEF). (2018). The Global Risks Report 2018. Geneva: World Economic Forum.
Yalçınkaya, Ö. & Daştan, M. (2020). Effects of Global Economic, Political and Geopolitical Uncertainties on the Turkish Economy: A Svar Analysis. Romanian Journal of Economic Forecasting, XXIII(1), 97-116.
Yang, J. & Yang, C. (2021). The Impact of Mixed-Frequency Geopolitical Risk on Stock Market Returns. Economic Analysis and Policy, 72, 226-240. https://doi.org/10.1016/j.eap.2021.08.008
Yang, M., Zhang, Q., Yi, A. & Peng, P. (2021). Geopolitical Risk and Stock Market Volatility in Emerging Economies: Evidence from GARCH-MIDAS Model. Discrete Dynamics in Nature and Society, 8, 1-17. http://dx.doi.org/10.1155/2021/1159358
Yılancı, V. & Bozoklu, Ş. (2014). Türk Sermaye Piyasasında Fiyat ve İşlem Hacmi İlişkisi: Zamanla Değişen Asimetrik Nedensellik Analizi. Ege Akademik Bakış, 14(2), 211-220.
Yüksel Çendek, S. & Örki, A. (2019). Arap Baharı Sürecinde Libya, Suriye ve Yemen’de Yaşanan İç Savaşlar: Karşılaştırmalı Bir Çözümleme. Elektronik Siyaset Bilimi Araştırmaları Dergisi, 10(1), 42-58.
1 Neacşu, Neguţ & Vlăsceanu (2018), in their assessment propose that the geopolitical risks era has been ushered in by the September 11 attacks.
2 The withdrawal of the United Kingdom from the European Union.
3 The Boston Globe, Chicago Tribune, The Daily Telegraph, Financial Times, The Globe and Mail, The Guardian, Los Angeles Times, The New York Times, The Times, The Wall Street Journal, and The Washington Post.
4 The formula used for the identification of the number of windows: T(0.01+1.8/T)
5 Here, the bootstrap method is specified as 10000
6 Periodic test statistical value= MWALD statistics calculated for a subperiod 10% bootstrap critical value of a subperiod.
7 It should be stated that other information criteria such as SC and HQ are also taken into consideration, and it has been concluded that these bear similar lag length as AIC. These results are omitted from the assessment due to concerns of optimality and efficiency.
8 Termed as “Arab Spring”, the series of protests and uprisings that were stipulated with the self-immolation of a citizen in Tunisia impacted various Middle Eastern (Egypt, Libya, Syria, Bahrain, Algeria, Jordan, Yemen, Mauritania, Saudi Arabia, Oman, Iraq, Lebanon, Morocco) countries. Arab Spring is a regional and societal movement arising out of the Arab citizens’ demands for democracy, freedom and human rights (Yüksel, Çendek and Örki, 2019; Göçer and Çınar, 2015).
9 The war between Russia and Ukraine started with a military operation in Donbas on February 24, 2022; it actually started with the annexation of Crimea by Russia on February 20, 2014. With the start of the Russian war, Western countries and the USA have applied economic sanctions (sanctions covering political, economic, financial, energy, tourism and even social and cultural fields) against Russia. The Russia–Ukraine war had a negative impact on Turkey’s (Black Sea region) regional security and trade. The World Trade Organization predicts that the Russia–Ukraine war may halve the growth in global trade in 2022. The Russia–Ukraine war negatively affects agricultural production, global food and logistics supply chain, and energy security. However, in the Russia–Ukraine War, Turkey played a mediatory role as a neutral country and demonstrated its geostrategic importance in the international arena. The Grain Corridor Agreement was signed under the leadership of Turkey in order to bring a solution to the food crisis that emerged due to the war in question. The important point to remember is that Turkey is a neighboring country to Russia. The risk and war pricing there may adversely affect Turkey with the ‘contagion effect’. If Turkey is not a party in this process, but is forced to become a party, its geopolitical reflection will be negative (Özcan, 2022; Airplane, 2022; Eryılmaz, 2022; Ece, 2022; Keyman, 2022; Koçak, 2022).