Ekonomika ISSN 1392-1258 eISSN 2424-6166
2023, vol. 102(1), pp. 122–139 DOI: https://doi.org/10.15388/Ekon.2023.102.1.7
SOE Corporate Governance Reform in Lithuania – Explained and Еmpirically Tested
Liudas Jurkonis*
Institute of International Relations and Political Science,
Vilnius University, Vokieciu str. 10, Vilnius LT-01130, Lithuania
e-mail: liudas.jurkonis@gmail.com
Šarūnas Merkliopas
Vilnius University, Institute of International Relations and Political Science, Lithuania
Deividas Gabulas
Vilnius University, Institute of International Relations and Political Science, Lithuania
Abstract. Following previous research on management efficiency of state-owned enterprises (SOEs) in Lithuania, this paper continues previous discussion via extension of the observed time period seeking to continuously analyze the impact of corporate governance principles to the management effectiveness of Lithuanian SOEs.
For the purpose of this study, elements of corporate governance principles established in the initial reform of the SOEs in Lithuania are used as key dependent variables to measure and quantify the dynamics of corporate governance culture and its impact to the management efficiency of SOEs. Analysis performed is of a special importance as it covers the 10-year period (2010–2020) and could serve as a case study in analyzing practical implications of managerialism principles in public sector and SOEs specifically.
New public management paradigm (Politt, 1993) combined with policy learning theory (Bennett, Howlett, 1992) are used as the theoretical background to explain the initiation and logical framework of SOE reform as well as the selection of variables used in this study. Additionally, principles of corporate governance established by OECD and other international organizations (OECD, 2015) are also used to enrich the analytical framework.
The results of the analysis do not only prove that the implementation of corporate governance principles has a positive influence on the efficiency of management of SOEs, but also reveals additional factors that were not identified in the previous research – this impact is not static, but rather dynamic changing in accordance with the maturity of managerial practices within SOEs. The revealed dynamic nature of effects of the SOE policy should lead to the continuation of research seeking to expand it both geographically and vertically including other governmental organizations into the scope of future research.
Keywords: state-owned enterprises, corporate governance, management efficiency
_________
* Corresponding author.
Received: 23/11/2022. Revised: 12/03/2023. Accepted: 20/03/2023
Copyright © 2023 Liudas Jurkonis, Šarūnas Merkliopas, Deividas Gabulas. Published by Vilnius University Press
This is an Open Access article distributed under the terms of the Creative Commons Attribution License, which permits unrestricted use, distribution, and reproduction in any medium, provided the original author and source are credited.
1. Introduction
Manyors analyzing dependencies between implementation of managerial practices and the impact of those to the improvement of the organizations performance consistently show that strengthening of internal control functions, improvement of transparency and corporate governance practices, monitoring of performance results have a positive effect not only on the management effectiveness of private businesses, but also of SOEs (Miazek 2021, Nan et al. 2019, Eforis 2018, Milhaupt & Pargendler 2018, Heo 2018, Daiser et al. 2017, Boateng et al. 2017, Rossieta 2017, Dumitraşcu et al. 2015, Grossi & Papenfuß 2015, and others). Nevertheless, the key weaknesses of such studies are (i) the lack of consistency of methodology, (ii) the short period of time (usually based on the limited time span) as well as (iii) limited number and quality of independent variables used for the purposes of the research.
The unique novelty of this paper is related to the fact that (i) this is already the 3rd iteration of the analysis of Lithuanian SOEs, (ii) Lithuanian SOEs are analyzed using consistent theoretical model, developed methodology and hypothesis, (iii) it includes not only the quantifiable metrics into the model, but also the qualitative analysis related to the change of the process of SOE policy making in Lithuania related to internal factors (e.g., changes of governments) and/or external factors (e.g., compliance with the requirements of OECD).
This paper was prepared building up on the previous analysis explaining the initiation of SOE reform as well as aspects affecting effectiveness of management of SOEs in Lithuania. The previous results showed that:
• Politicization is heavily embedded in the management of SOEs via (i) patronage strategies and egalitarian loyalty bargaining (Nakrošis 2014) being actively exercised, (ii) appointment of politicized CEOs with the change of ruling majorities and governments (Laurišonytė 2014) being a usual practice.
• Greater autonomy (independence) from politicization as well as freedom of decision-making process (control) within SOEs would increase the management efficiency of SOEs (Jurkonis 2012).
• Research focusing on the aspects of corporate social responsibility (Jurkonis 2013) and diversity of the boards (Jurkonis 2015) also show that composition of the board, investment to the development of competence of management would ultimately have a positive effect on the motivation of SOE staff and results generated by the organization.
Based on the above listed outcomes and results of the previous research, this paper seeks to:
• check if the output of the regression model analyzing relation between corporate governance principles embedded within SOE reform of the Republic of Lithuania and the effectiveness of SOEs is consistent with the previous results related to the SOE reform n 2010–2015.
• understand what are the key variables having an impact to the change (if such would exist);
• contribute to the discussions on theory of application of managerialism principles in public sector.
Due to the specifics of SOEs and, mainly, to the core focus of the reform being targeted to the management effectiveness and profitability of SOEs, it is expected that the results of the research could contribute to the discussion targeting 2 specific questions:
(i) Which corporate governance elements included into the reform were key elements that should have led to the better outputs in Lithuanian SOEs?
(ii) In the light of conflicting evidence coming from previous theoretical discussions, why some of the specific principles of managerialism (if any) showed positive impact to the effectiveness of public sector performance? What are the specific conditions that where crucial for the successful adoption of these principles?
The following sections of the paper present (i) the recap of the key aspects of the theoretical background explaining the initiation of the SOE reform in Lithuania as well as (ii) the analysis of the effectiveness of SOE management, followed by (iii) the empirical application of the regression model to understand the impact of the managerial practices being implemented within SOEs and their financial performance. We conclude this paper with the key findings of our analysis as well as insights related to the future research aspects to be considered and explored.
2. Literature review – theoretical background for the analysis of SOEs management effectiveness
Despite different factors explaining the place of SOEs in national economies, the importance of SOEs in the global economy is an indisputable fact. The table below presents key sectors, which are dominated by SOEs globally (Ernst & Young, 2010).1
Table 1. Key industries SOEs operate in globally
|
Based on number of entities: |
Based on assets: |
|
1. Energy |
1. Energy |
|
2. Transport |
2. Oil & Gas |
|
3. Telecommunications |
3. Production |
|
4. Production |
4. Telecommunications |
|
5. Oil & Gas |
5. Transport |
Source: modified by author according to Ernst & Young “Government as a best shareholder” (2010)
Data from Ernst & Young research (2010) also shows that SOEs significantly contribute to the GDP and investment climate development within national economies:
• In the developed countries SOEs account for 8% of GDP and 13% of FDI;
• In developing countries, respectively,- 9% GDP and 17% investment;
• In least developed countries, respectively, 14% GDP and 28% investment.
This fact is further developed in “Beyond Economic Growth” (2004) by T.P. Soubbotina who reveals that the relationship between the standard of living and share of SOEs in the economy is reverse. This suggest that the developing of effectiveness of SOE management should lead not only to the better welfare of the state and its citizens, but also to the increasing development of entrepreneurship within respective countries.
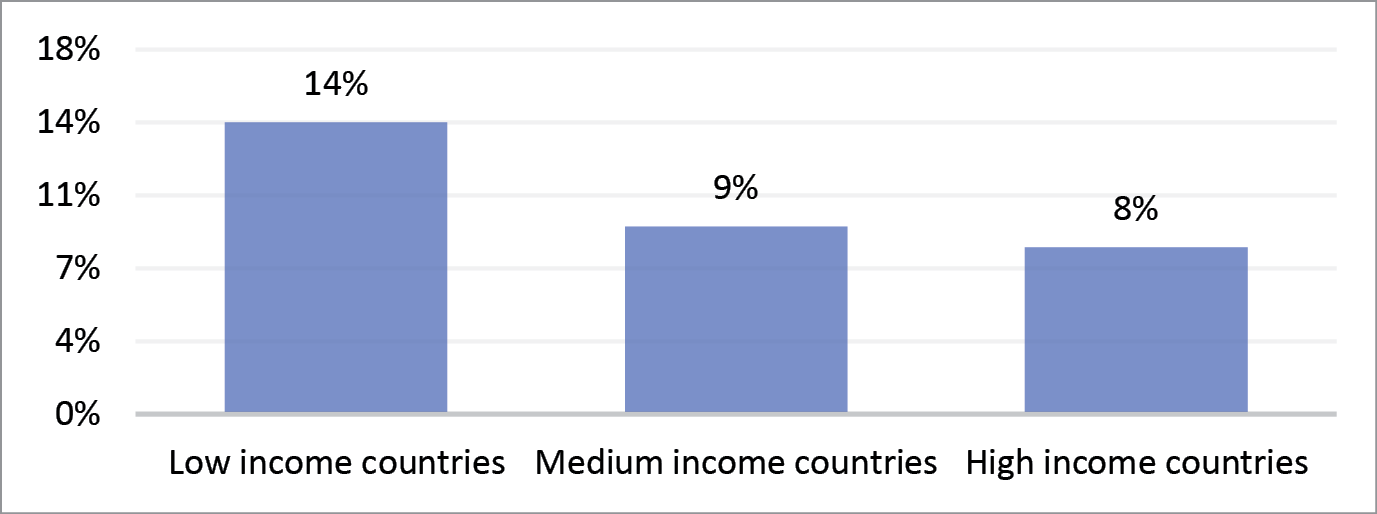
Figure 1. SOE contribution to the GDP in different types of economies (according to standard of living). Source: Modified by authors according to T. Soubbotina “Beyond Economic Growth” (2004)
The above-provided data shows an undeniable importance of quality of SOE management. Therefore, to understand what are the key managerial factors that contribute to the effectiveness of SOE management, this section is designed to provide short overview of the reform itself, explain the appearance of corporate governance principles in it, present the data analysis showing the relationship between corporate governance and its impact to the management efficiency of Lithuanian SOEs.
The theoretical background of this research is built on the basis of new public management (NPM) theory with the focus on the impact of managerialism in public sector.
The adoption of NPM principles has been widely discussed in scholarly world (Hood, 1990, Dunleavy & Hood, 1994, Pollitt & Bouckaert, 2017; Curry & Van de Walle, 2018, Chandra & Walker, 2019). However, despite the large theoretical discussion as well as an increase in empirical studies, understanding about the effects of NPM is very limited to be able to conclude if and how managerialism contributes to the quality and effectiveness of public sector.
Figure 2 below illustrates the model of the research highlighting key actors of the reform as well as variables used for the empirical analysis and measurement of outcomes of it.
An overview provided in the introductory remarks illustrates some of the SOE reform variables which were identified in the previous research as having an impact to SOE management effectiveness. Together with theoretical insights coming from the above-mentioned theories the below hypotheses of our research are formed and tested in this paper.
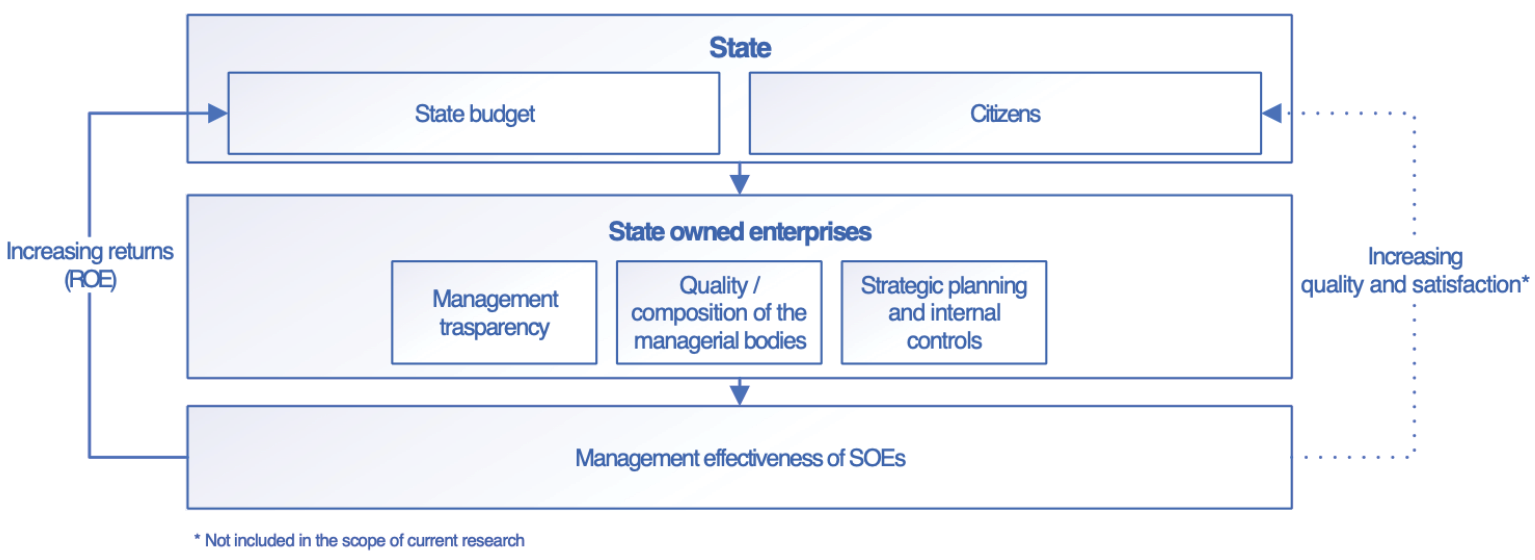
Figure 2. Summarized model of the analysis.
Source: created by authors
Implementation of corporate governance principles should have a positive influence on SOEs management efficiency via:
(i) SOEs management transparency.
Increased management transparency and accountability should have a positive effect on the management of SOEs via stronger public and shareholder oversight as well as establishment of clear code of conduct and anticorruption principles (Baum et al 2019)
(ii) SOEs Board compliance with OECD guideline requirements.
Better qualified, more independent and professional boards should lead to a better strategic management and thus to a better performance of SOEs. Moreover, independent board members are expected to bring more result-oriented focus (Böwer 2017).
(iii) SOEs strategic planning and internal control system effectiveness.
Increased quality of internal control and strategic planning should have a direct positive impact to organization’s operational effectiveness and efficiency (Papenfuß 2020).
It should be stressed that the set of variables used in this research is deepening the understanding of the public administration topic specific in the SOE industry, which is crucial for every country across the globe. Moreover, it is penetrating into the topic of corporate governance which is a relatively new and unexplored topic not only for private business, but – even more – for the state-owned domain.
The above is also relevant to explain originality of the selected approach, as the variables developed in the research are novel and test the public management principles coming from the private sector and being applied in the public management sphere. Lastly, the potential practical application of the results of this research is a crucial cornerstone of this paper as it should help both the political leadership as well as management of SOEs to identify aspects of corporate governance which would contribute to the management efficiency of organizations being a crucial part of national economies and every citizen as the providers of public services.
3. SOE corporate governance reform – process, contents, impact
3.1. Composition of corporate governance indexes and
methodology of the research
The unique dataset containing various indicators expressed as corporate governance indexes comes from Governance coordination center (GCC) which was established in Lithuania as a governmental agency to monitor and supervise the SOE reform.2
In order to measure how each SOE implements good governance practice, SOE Good Governance Index contains 3 main dimensions of indexes, which are used as independent variables in our research:
• Transparency;
• Composition of the board;
• Strategic planning and implementation.
It is worth noting that there are 6 subindicators within Transparency and Composition of the board dimensions and 4 within Strategic planning and implementation (please see the breakdown of indexes into the subindexes presented in Figure 5 below).
|
SOE corporate governance index |
||||
|
Indexes/ dimensions |
Transparency |
Board composition & structure |
Strategic planning and implementation |
|
|
Sub-indexes/ Criteria |
Annual reporting |
Independence |
Strategic planning |
|
|
Sustainability |
Competence |
Implementation and supervision |
||
|
Corruptios prevention |
Involvement |
Implementation of goals |
||
|
Accounting principles |
Selection |
Sustainability of finances |
||
|
Communication |
Functions |
|||
|
Special commitments |
Committees |
|||
Figure 3. SOE corporate governance index.
Source: created by authors based on GCC SOE corporate governance methodology
Every index and its subcategories are evaluated in the scale of 0 to 10 (where 0 and below 5 indicates negative evaluation, 5 to 7 – average, and 8 and above – positive evaluation) and summed-up using the weightings prescribed in the methodology.3
In our research these indexes are mapped with ROEs for each of the SOE in the regression equation below:
Y(management efficiency of SOEs expressed in ROE) =
f(x1(Transparency index);х2(Composition of the board); х3(Strategic planning and impact))
Regression framework used in this paper closely follows Jurkonis et al (2016). Section 3.4 specifies more details on model specification.
Since there were structural changes in the methodology of measuring management efficiency by GCC, the dataset used in the analysis distinguishes 2 periods of the corporate governance reform 2012–2014 and 2015–2019 in order to make the indices comparable.
For the period 2012–2014, relationship between GCC indicators and ROE have already been analyzed in detail in previous papers and, therefore, the results will not be presented here.
For the period of 2015–2019, there were 134 individual companies in the dataset. The following data cleaning steps were applied to the dataset:
• SOEs that have experienced a change in their name were treated as the same entity, i.e. at some stage UAB “Lietuvos Energija” was renamed to UAB “Ignitis”
• At some point AB “Kelių priežiūra” and VĮ “Valstybinių miškų urėdija” were consolidated into merged entities comprising of smaller entities, i.e. VĮ “Valstybinių miškų urėdija” in 2016 was merged into a single entity from regional counterparts, like VĮ “Alytaus miškų urėdija”, VĮ “Anykščių miškų urėdija”, etc. To treat these regional counterparts as a single parent company, we have averaged out GCC indicators and ROE values. Specifically, we applied weighted mean with weights corresponding to the size of the equity.
• SOEs that did not have some of the GCC indicators relevant for the empirical application were excluded from the dataset. There were 9 such SOEs.
It is important to note that these changes were expertise rather than data driven. That is, these changes were applied before the models were estimated and results inspected.
Similarly, GCC Corporate governance index computes every of the above-mentioned group into subindicators (GCC, 2019). However, only the top-level indicators are used as the main independent variables to minimize any data snooping in the regression analysis.
Another aspect that helps to minimize data snooping is that we kept SOEs that have defaulted or ceased operation in the final dataset. This helps to deal with survivorship bias, i.e. if only the currently operating SOEs were analyzed, a stronger relationship between ROE and GCC indicators might have been discovered but that would have been a spurious discovery.
3.2. Overview of changes within SOE portfolio
Analysis performed using GCC data and SOE reports published throughout the years of the reform show that the overall number of SOEs owned by Lithuania dropped from 180 in 2009 to 48 in 2019.

Figures 4-5. Changes in the number of Lithuanian SOEs and respective return on equity (ROE) generated.
Source: created by authors based on GCC data and SOE reports published
Drastic changes in the number of SOEs was achieved by (i) divestment as well as (ii) centralization of management functions. The biggest change was achieved via optimization of capital structure and divestment of noncore assets (34 out of 113 enterprises were not attributed to any of the core sectors). As for the key industries Lithuanian SOEs are acting in, the changes were not that drastic throughout the years of the reform:
• 43 Lithuanian forestry companies were grouped into 1 holding company;
• Similar centralization efforts were implemented in transport and energy sectors merging the management functions into more homogenous industry-driven structures resulting in decrease by 3 companies in the energy sector and 7 in transport.
In terms of ROE changes, the biggest positive effect was noted after 6 years resulting in an overall 5 p.p. growth compared to the initial ROE generated at the beginning of the reform (see Table 2 below).
Table 2. ROE by sectors 2009–2019
|
2009 |
2012 |
2016 |
2019 |
Dif (%) |
|
|
Energy |
0% |
1% |
10% |
5% |
5% |
|
Transport |
0% |
4% |
2% |
6% |
6% |
|
Forestry |
1% |
3% |
2% |
3% |
2% |
|
Other |
-2% |
0% |
3% |
3% |
5% |
|
Grand Total |
0% |
2% |
5% |
4% |
4% |
Source: created by author based on GCC data and published SOE reports.
The above results show short- and medium-term wins that were instrumental to sustain the reform. However, it does not provide the answer on the dependency between corporate governance principles and the efficiency of SOE management. Thus, the below sections of this paper will:
• provide a quantitative analysis of the relationship between management of SOEs and results of SOEs operations as measured by ROE;
• seek to answer the key question raised in the paper with regards to the potential impact of the corporate governance principles introduced with the SOE reform;
• provide explanations to the identified causalities (if any).
3.3. Impact of corporate governance to the efficiency of SOE management
One of the difficulties during the modelling was the fact that methodology for estimating GCC indicators has changed drastically during 2015. While GCC indicator methodology changes year-to-year, these changes are mostly modest, such as reframing subindex question slightly in order to better capture the main indexes (Transparency, Board composition & Structure, Strategic planning and implementation). However, starting from 2015, GCC indicators have started to be measured on a different scale – from 0 to 10. Previously, the scale was 0 to 2.
Figures 6 and 7 below show the dynamics of ROE and main indexes pre and post the aforementioned change.
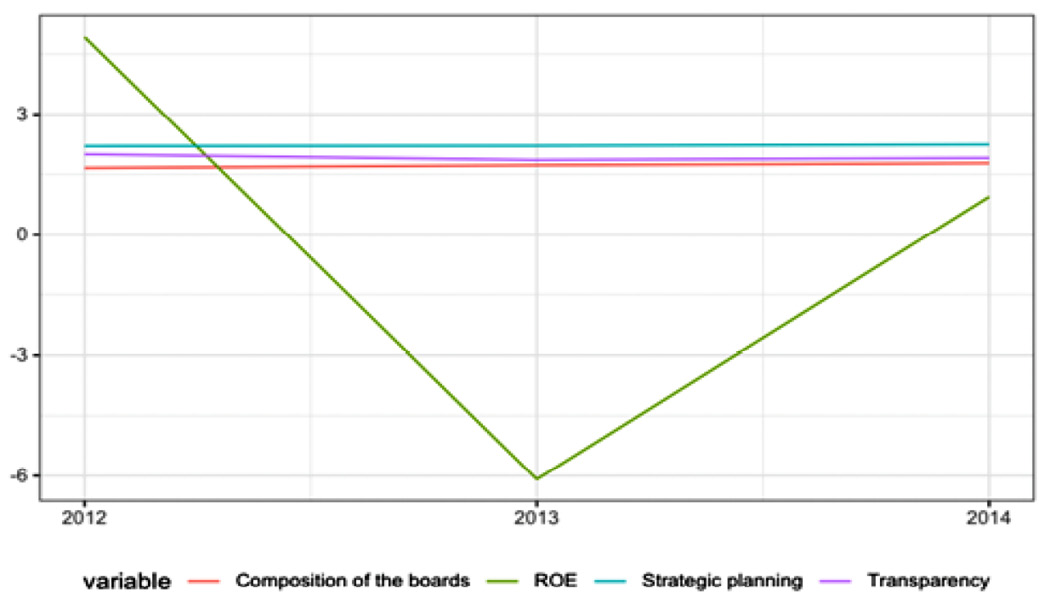
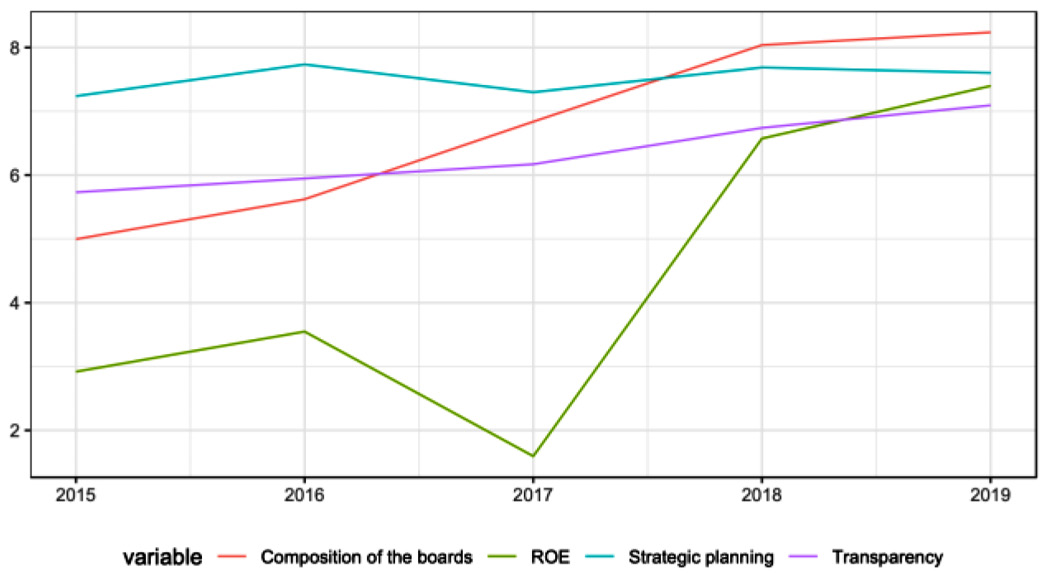
Figures 6-7. Corporate governance indicators’ time dynamics in the period of 2012–2014 and 2015–2019.
Source: created by authors based on GCC data and published SOE reports.
Essentially this means that we will not be able to use a single sample spanning 2012–2019 to quantify the effects of the SOE reform on their ROEs. Instead, we will combine analysis performed for the period of 2012–2014 with regression analysis over 2015–2019 sample to see if similar patterns can be observed despite methodological change. One argument for why this should be the case is that the main GCC indicator still attempt to capture the same underlying dimensions of management effectiveness albeit using different scaling and survey framing.
Additionally, to the methodological change, we can observe that over 2015–2019 average Transparency index and index showing Composition of the boards experienced a strong upward trend, which was almost in-line with the trend of average ROE. Strategic planning, however, has somewhat flat-lined trend. Table below provides further details for the dataset over the analyzed period. For example, it shows that the main indexes are somewhat positively skewed, that is, mean and median for all indexes are above 6 and even close to 8 for Strategic planning. This is one possible explanation for why GCC keeps revising and recalibrating the methodology: given that SOEs improve their management attributes, revisions are necessary in order to better differentiate between good and bad performers (SOEs).
Table 3. Summary statistics for the period of 2015–2019
|
Transparency |
Composition of the boards |
Strategic planning |
ROE |
|
|
Min |
2.182 |
1.994 |
1.592 |
-0.768 |
|
1st Quantile |
5.152 |
4.889 |
6.590 |
0.002 |
|
Median |
6.030 |
6.700 |
7.809 |
0.037 |
|
Mean |
6.237 |
6.506 |
7.749 |
0.040 |
|
3rd Quantile |
7.227 |
8.145 |
8.693 |
0.077 |
|
Max |
9.670 |
9.457 |
9.970 |
1.180 |
Source: created by author based on GCC data and published SOE reports.
Before carrying out the regression analysis, it is important to understand whether the main GCC indexes used as independent variables are not too correlated and capture separate dimensions of management efficiency. Correlation matrix in Table 4 below presents this linear relationship. All correlations are below 0.5 and the strongest correlation with the ROE is 0.368 for Strategic planning. While it is hard to place any priors for these relationships, inter-index correlations below 0.5 do not seem excessive and stand in line with those observed in previous analysis for the 2012–2014 period. Similarly, it is quite reasonable to expect Strategic planning to be the most correlated with ROE as compared to Transparency or Composition of the boards.
Table 4. Indicators and ROE correlation matrix
|
Corporate governance indicators |
Transparency |
Composition of the boards |
Strategic planning |
ROE |
|
Transparency |
1 |
|||
|
Composition of the boards |
0.466 |
1 |
||
|
Strategic planning |
0.457 |
0.261 |
1 |
|
|
ROE |
0.163 |
0.079 |
0.368 |
1 |
Source: created by author based on GCC data and published SOE reports.
3.4. Outcomes of regression analysis
The regression framework used in this paper closely follows our previous analysis. Ideally, we would like to have variables relating to productivity, cost of production and competition (where relevant) in order to attribute left-over variation to dimensions of management effectiveness. In this case we could estimate models using instrumental variables techniques such as 2 Stage Least Squares (2SLS). Since these variables are not available, Least Squares Dummy Variables (LSDV) estimator with various fixed effects will be employed. Some arguments for this specific choice are offered below:
• LSDV estimator exploits available variation and panel data structure much more than pooled OLS estimator.
• During the analysis, we tried to estimate both, LSDV and pooled OLS, models, but F-tests almost always suggested that LSDV estimates were superior to pooled OLS ones.
• Similarly, one can use the Within estimator which employs within transformation (i.e. de-meaning within the used fixed effects such as company or yearly) which is numerically equivalent to LSDV. We decided to stick with LSDV because different sets of fixed effects (i.e. not only company or yearly) will be used for comparison which is more natural in the LSDV framework.
• Finally, one can argue for different kind of heterogeneity in favor of Random Effects model. However, similarly to LSDV vs OLS case, Hausman test rejected random effects approach when compared to fixed effects, which further is consistent with using LSDV estimator.
As such, different sets of fixed effects will be used to gauge whether patterns exist and whether they are consistent (i.e. variable significance and coefficient signs are stable). The list of used fixed effects:4
• Yearly effects: separate dummy variables for each year in the sample (2015–2019)
• SOE effects: separate dummy variables for each SOE in the sample
• Sector effects: dummy variables for Energy, Transport and Other sectors
• Legal form effects: dummy variables for Private Limited Liability Company (UAB), Public Limited Liability Company (AB), Public Institution (VĮ)
• Size effects: dummy variables for Small, Medium, Large, Very Large.
• State institution effects: dummy variables referring to state institution that manages a particular SOE, i.e. Ministry of Finance, Ministry of Energy, etc.
Finally, the dependent variable, ROE, seems to contain negative values and heavier tails when compared to Normal distribution (i.e. leptokurtic). The Kolmogorov–Smirnov test for normality rejects null hypothesis with high significance (P-value < 4*10-8). While normality for dependent variable is not a formal assumption for a linear regression model, in practice it helps to transform the dependent variable to resemble Normal distribution as much as possible. We transform ROEs using Inverse Hyperbolic Sine transformation, which will act in a similar fashion like logarithm but can cope with both positive and negative values easily and overcomes the limitation of the popular logarithmic transformation. After the transformation, absolute skewness is reduced from 1.47 to 0.68, and kurtosis from 23.28 to 1.19. The Kolmogorov-Smirnov test still reject null hypothesis of Normal distribution, but the P-value is higher than before (0.006).
The results presented in the previous analysis show that for the period of 2012–2014 Composition of the boards was a significant factor and positively affected returns. Other variables (Boards and Quality of planning) are insignificant and negative, suggesting that the coefficients might be spurious.
Table 5. Results of regressing management indexes on ROEs for the period of 2015–2019
|
Dependent variable |
|||||
|
ROE |
|||||
|
(1) |
(2) |
(3) |
(4) |
(5) |
|
| Transparency |
-0.0002 (0.005) |
-0.003 (0.005) |
-0.003 (0.004) |
||
| Composition of the boards |
-0.0001 (0.003) |
-0.005 (0.004) |
-0.002 (0.004) |
||
| Strategic planning |
0.016*** (0.003) |
0.017*** (0.004) |
0.022*** (0.003) |
||
| Year fixed effects included: | Yes | No | Yes | Yes | Yes |
| SOE fixed effects included: | Yes | Yes | Yes | No | No |
| Sector fixed effects included: | No | No | No | Yes | Yes |
| Size fixed effects included: | No | No | No | Yes | Yes |
| Legal form fixed effects included: | No | No | No | Yes | Yes |
| State institution fixed effects included: | No | No | No | Yes | Yes |
| Observations | 237 | 237 | 237 | 229 | 229 |
| R-Squared | 0.528 | 0.574 | 0.583 | 0.246 | 0.445 |
| Adjusted R-Squared | 0.359 | 0.426 | 0.425 | 0.137 | 0.354 |
| Residual Std. Error |
0.049 (df = 174) |
0.046 (df = 175) |
0.047 (df = 171) |
0.057 (df = 199) |
0.049 (df = 196) |
| F Statistic |
3.136*** (df = 62; 174) |
3.870*** (df = 61; 175) |
3.684*** (df = 65; 171) |
2.244*** (df = 29; 199) |
4.907*** (df = 32; 196) |
| Note: | * p<0.1; **p<0.05; ***p<0.01 | ||||
Source: created by author based on GCC data and published SOE reports.
For the period of 2015-2019 in total 5 models were reported (see Table 5 above), but these can be viewed as two control and three actual regressions of interest. They are as follows:
• Models (1) and (3) include Year and SOE fixed effects but do not include sector, size, legal form, or state institution effects. Model (2) is the same as model (3) but without Year fixed effects.
• Models (4) and (5) do the opposite, i.e. do not include SOE fixed effects but include the other available variables.
Model (2) is included in the table because when comparing models with SOE and Year fixed effects to models with only SOE fixed effects, F-test rejected the hypothesis of including Year fixed effects when SOE dummies where already included. On the other hand, models (2) and (3) for the most part are very similar: estimates for the coefficient of Strategic planning as well adjusted R-squared values are close for the models.
On the other hand, dropping SOE fixed effects but using all the other remaining dummies are important to models (3) and (4) which seem to explain less variation as indicated by adjusted R2 compared to (1), (2) and (3). Model (2) which includes SOE fixed effects only seem to explain the highest share of variation and is in line with the numbers reported in previous analysis for the period of 2012–2014.
Main conclusions (variable signs and significance) do not change when comparing models (2), (3) and (4) which is important as a measure for specification robustness. While addition of main GCC indexes improve the share of explained variance only slightly for models (2) and (3) when compared to model (1), it does increase the same share quite considerably for model (5) when comparing to (4). However, results for the period of 2012–2014, Composition of the boards is not significant variable anymore and even has a negative point estimate.
In the dataset covering period of 2015–2019 the only important management indicator is the Strategic planning and implementation. It has positive effect varying across 0.016–0.022 for models (2), (3) and model (4). While the Inverse Hyperbolic Sine transformation was used to transform the dependent variable, in order to properly interpret the coefficients, we proceed as follows:
• For each data point in the sample, we add 1% / 1 standard deviation increase to Strategic planning index.
• We then compute fitted ROE values using model (2) for each point with the updated Strategic planning index
• We compute the median effect with respect to ROE over the estimated points
We follow this procedure because while Inverse Hyperbolic Sine transformation should behave similar to logarithm, the coefficient elasticity actually depends on the dependent variable itself. That is, the similarity to logarithm is only approximate.
When we compute the implied ROE change with respect to 1%/1 standard deviation increase in Strategic planning, we see that ROE is increased by 3.02%/64%. This implies that estimated effect is both economically and statistically significant.
When performing the analysis of the residuals for model (2) we do not see any pronounced patters in the residuals vs fitted plot below. However, Scale–Location plot indicates a potential problem for heteroscedasticity. To account for that, we estimate Heteroscedasticity-consistent covariance matrix using the White estimator. It still produces an estimate of standard error of 0.004 for the Strategic planning and implementation coefficient so the conclusions remain intact.
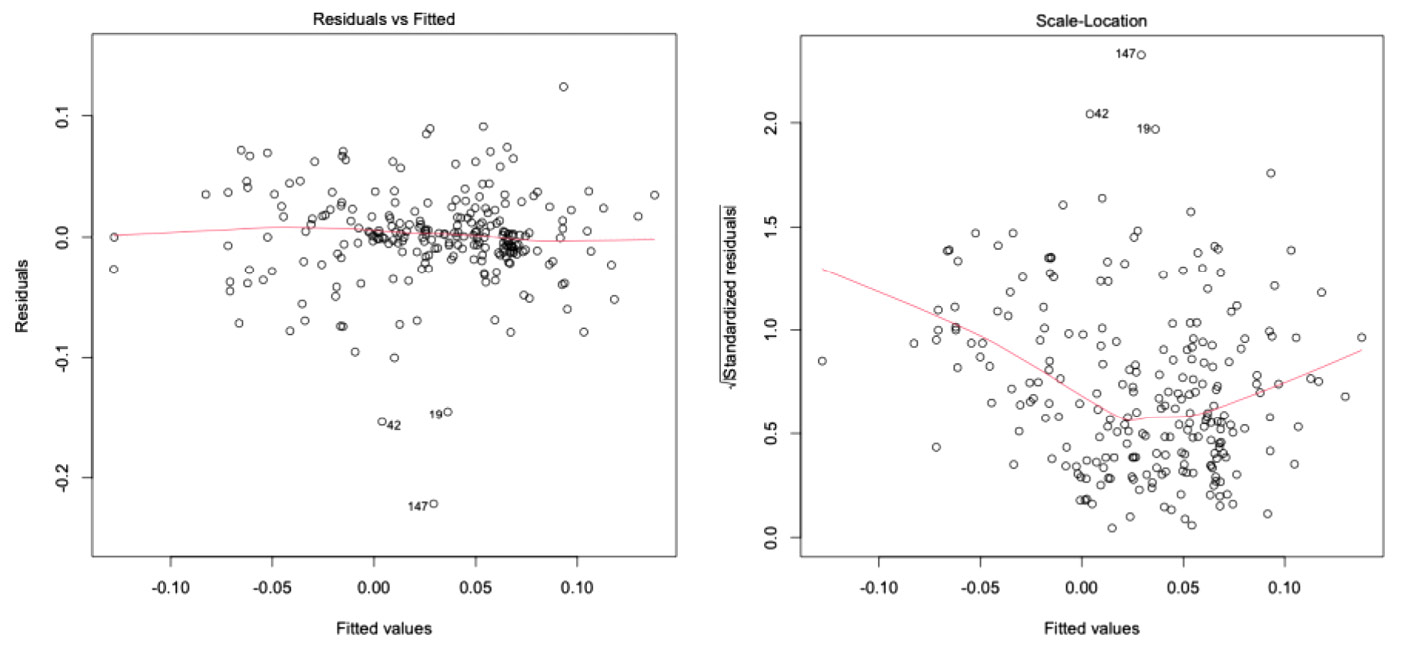
Figure 8. Model residual analysis.
Source: created by authors based on GCC data and published SOE reports.
Additionally, since a lot of fixed effects as dummy variables were used, we tested for problems of multicollinearity using Generalized Variance Inflation Factors (GVIF).
Table 6. Generalized Variance Inflation Factors for estimated regressions
|
GVIF |
|||
|
(2) |
(3) |
(5) |
|
| Transparency | 2.25 | 2.35 | 1.67 |
| Composition of the boards | 1.59 | 2.40 | 2.11 |
| Strategic planning | 1.78 | 1.87 | 1.33 |
| Year fixed effects | 1.17 | 1.20 | |
| SOE fixed effects | 2.25 | 2.35 | |
| Sector fixed effects | 2.10 | ||
| Size fixed effects | 1.22 | ||
| Legal form fixed effects | 1.35 | ||
| State institution fixed effects | 1.14 | ||
Table 6 above shows all of GVIF values for all relevant models ((2), (3) and (5)) and variables are below 5 suggesting that multicollinearity should not pose any significant problems during the estimation.
Thus, combining the results of the performed regression analysis, it seems that while initially (over 2012–2014) the introduction of independent boards into SOE might have had a positive effect on ROE, later in the reform (over 2015–2019) it did not translate into improvement of ROEs. Analysis over 2015–2019 suggests that Strategic planning becomes a more important factor with respect to ROE. We believe that this might have been caused by the fact that, initially, SOE management boards in Lithuania might be not as efficient and introduction of independent ones provided a bump in efficiency. This effect might have decreased over time due to marginal gains and Strategic planning became a more important factor.
This by itself is a very interesting finding showing that managerial aspects are not static but dynamic and change over the course of time. Respectively, governments as the representatives of the shareholders of SOEs have to constantly invest into the analysis of the maturity of management principles’ application, (re)selection of the executives in charge, timely adaptation of management focus to sustain the success of SOEs management.
4. Conclusions
The analysis presented in this paper is of a special importance for number of reasons.
Firstly, corporate governance is a relatively new and unexplored topic not only for private business, but, even more, for the state-owned domain. Therefore, the attempt to include this topic into the NPM theory discussion is considered to be novel and broadening the analysis of the managerialism concepts in public administration.
Secondly, the longitudinal aspect covering the 10-year period of establishment of the corporate governance principles in Lithuanian SOEs makes this study rare and especially strong, providing empirical results explaining the relations between corporate governance practices and their impact on the results of SOEs.
The results of our analysis extend the discussion on the topic of dependencies between implementation of managerial practices and the impact of those to the improvement of the performance of SOEs. The unique angle of this paper is related to the fact that we not only prove that implementation of corporate governance principles has a positive influence on the efficiency of SOEs management, but – what is even more interesting – show that this impact is not static, but dynamic and changes with the increase of the maturity of managerial practices within SOEs:
• During 2009–2014 the main effect was seen from independence of the boards and depoliticization.
• In the period of 2015–2019 the growth of ROE slows down and the effects explaining management efficiency in SOEs are shifting to the variable of strategic planning and implementation.
It is argued and explained that those SOEs which were the first to include independent business professionals in their boards were the ones to shift their focus towards more result-driven approach, which became the core driver determining changes of ROEs. The gradual implementation of the reform, equalizing the levels of independent board members within the boards, eroded this effect, highlighting the importance of strategic planning and implementation as a more long-term factor distinguishing the quality of management of SOEs.
Authors of the paper acknowledge the limitations of research (mainly those being related to the changes of corporate governance index, qualitative nature of the used indexes, lack of foreign examples to be used for comparison purposes). Nevertheless, we believe that the results presented in the paper should encourage governments – as the representatives of the shareholders of SOEs – to constantly invest into the analysis of the maturity of management principles’ application as this will enable data-based decision and policy-change process. On the other hand, the dynamic nature and changes in factors determining the effects of the SOE policy should inspire to continue our research seeking to expand it both geographically via promotion of corporate governance index application in SOEs and vertically, including other governmental organizations (e.g., municipality owned companies) into the scope of future research.
References
Baum, A. & Hackney, C. & Medas, P.& Sy, M. (2019). Governance and State-Owned Enterprises: How Costly is Corruption? IMF Working Papers, 253. https://doi.org/10.5089/9781513519296.001
Bennett, C. & Howlett, M. (1992). The Lessons of Learning: Reconciling Theories of Policy Learning and Policy Change. Policy Sciences, 25, 275-294. https://doi.org/10.1007/BF00138786
Boateng, A., Bi, X. & Brahma, S. (2017). The impact of firm ownership, board monitoring on operating performance of Chinese mergers and acquisitions. Review of Quantitative Finance and Accounting , 49, 925-948. https://doi.org/10.1007/s11156-016-0612-y
Böwer, U. (2017). State-Owned Enterprises in Emerging Europe: The Good, the Bad, and the Ugly. IMF working paper, 2017/221. https://doi.org/10.5089/9781484315163.001
Curry, D. & Van de Walle, S. (2018). A Bibliometrics Approach to Understanding Conceptual Breadth, Depth and Development: The Case of New Public Management. Political Studies Review, 16(2), 113–124. https://doi.org/10.1177/1478929916644869
Daiser, P, Ysa, T., & Schmitt, D. (2017). Corporate governance of state-owned enterprises: a systematic analysis of empirical literature. The International Journal of Public Sector Management, 30(5), 447-466. https://doi.org/10.1108/IJPSM-10-2016-0163
Dumitraşcu, M., Feleagă, L. & Feleagă, N. (2015). The practical implementation of corporate governance principles for Romanian state owned enterprises. Audit Financiar. 13(121), 91–99.
Dunleavy, P.& Hood, C. (1994). From old public administration to new public management. Public Money & Management, 14(3), 9–16. https://doi.org/10.1080/09540969409387823
Eforis, C. (2018). Corporate Governance, State Ownership and Firm Performance: An Empirical Study of State-Owned Enterprises in Indonesia. GATR Accounting and Finance Review, 3, 26-32. doi: 10.35609/afr.2018.3.1(4).
Ernst & Young. (2010). Government as a best shareholder. EYGM.
Fullan, Michael. (2009). Large-scale reform comes of age. Journal of Educational Change, 101-113. doi: 10.1007/s10833-009-9108-z
Governance coordination center. (2021). SOE annual reports for 2009-2019. Accessed March 3, 2021. https://governance.lt/en/vkc-ataskaitos/#.
Governance coordination center. (2021). SOE corporate governance index. Methodology. Accessed May 29, 2021. https://governance.lt/wp-content/uploads/2020/03/VVI_valdysenos_indeksas_metodika_201920.pdf.
Grossi, G., Papenfuß, U., & Tremblay, M.-S. (2015). Corporate governance and accountability of state-owned enterprises: Relevance for science and society and interdisciplinary research perspectives. International Journal of Public Sector Management, 28(4/5), 274-285. https://doi.org/10.1108/IJPSM-09-2015-0166
Heo, K. (2018). Effects of Corporate Governance on the Performance of State-Owned Enterprises. Policy Research Working Paper, 8555. https://doi.org/10.1596/1813-9450-8555
Hood, C. & Dixon, R. (2015). A government that worked better and cost less?: Evaluating three decades of reform and change in UK central Government. Oxford, UK: Oxford University Press.
Hood, C. (1990). A public Management for all seasons?. Public Administration, 69(1), 3–19. https://doi.org/10.1111/j.1467-9299.1991.tb00779.x
Jurkonis, L, Merkliopas, Š. & Kyga, K. (2016). Impact of Corporate Governance Reform on the Management Effectiveness of State Owned Enterprises in Lithuania in 2012–2014. Ekonomika, 95(2),158-178. https://doi.org/10.15388/Ekon.2016.2.10130
Jurkonis, L. and Anicas, I. (2015). Impact of the Board on Management of Lithuanian State Owned Enterprises”, Ekonomika, 94(3), pp. 139-151. https://doi.org/10.15388/Ekon.2015.3.8792
Jurkonis, L. (2012). Effects of control and autonomy to the management efficiency of state-owned companies. Politologija, 66(2), 3-31. https://doi.org/10.15388/Polit.2012.2.1521
Jurkonis, L. (2013). State-owned companies’ management effectiveness - the perspective of corporate social responsibility. International Scientific Conference― “Whither Our Economies” October 24-25. ISSN (online) 2029-8501, Mykolas Romeris university, Vilnius
Laurišonytė, N. (2014). Lietuvos valstybės valdomų įmonių vadovų politizacija. Politologija, 74(2), 68-95. https://doi.org/10.15388/Polit.2014.2.3637
McLaughlin, K., Ferlie, E., & Osborne, S. (2002). New Public Management: Current Trends and Future Prospects. Routledge.
Miazek, R. (2021). Corporate governance in state-owned enterprises. A systematic literature review: an international perspective. International Journal of Contemporary Management, 57, 1-13. https://doi.org/10.2478/ijcm-2021-0011
Milhaupt, C. J. & Pargendler, M. (2018). Governance Challenges of Listed State- Owned Enterprises Around the World: National Experiences and a Framework for Reform. Cornell International Law Journal, 50(3). https://doi.org/10.31228/osf.io/zrxmn
Nakrošis, V. (2014). Lietuvos viešojo sektoriaus organizacijų vadovų kaita ir politizacija. Vilnius university. Politologija, 74(2), 3-37. https://doi.org/10.15388/Polit.2014.2.3639
Nakrošis, V. (2018). The Agendas of Public Administration Reforms in Lithuania: Windows of Opportunity in the Period 2004 – 2017. NISPAcee Journal of Public Administration and Policy, 11(1), 91-114. https://doi.org/10.2478/nispa-2018-0004
Nan, J., Kenneth, G. H. and Cyndi, M. Z. (2019). Public Governance, Corporate Governance and Firm Innovation: An Examination of State-Owned Enterprises. Academy of Management Journal, 62(1). https://doi.org/10.5465/amj.2016.0543
OECD. Lithuania’s accession to the OECD. Accessed July 25, 2019. http://www.oecd.org/countries/lithuania/lithuania-accession-to-the-oecd.htm>, Accessed June 22, 2021.
OECD. (2015). OECD Guidelines on Corporate Governance of State-Owned Enterprises. 2015 Edition, OECD Publishing, Paris.
OECD. (2020). The COVID-19 crisis and state ownership in the economy: Issues and policy considerations. OECD Policy Responses to Coronavirus (COVID-19). Accessed June 1, 2021. https://www.oecd.org/coronavirus/policy-responses/the-covid-19-crisis-and-state-ownership-in-the-economy-issues-and-policy-considerations-ce417c46/
Papenfuß, U. (2020). Corporate Governance of State-Owned Enterprises. Conceptualization, challenges and perspectives for the public corporate governance field. The Routledge Handbook of State-Owned Enterprises. 1st Edition.
Pargendler, M. (2012). State Ownership and Corporate Governance. Fordham Law Review, 80(6). http://dx.doi.org/10.2139/ssrn.1854452
Pierson, P. (2000). Increasing returns, path dependence and the study of politics. American Political Science Review, 94(2), 251-267. http://dx.doi.org/10.2307/2586011
Pollitt, C. & Bouckaert, G. (2017). Public management reform: A comparative analysis-into the age of austerity. Oxford, UK: Oxford University Press.
Pollitt, C. (1993). Managerialism and the Public Series. 2nd edn. Blackwell, Oxford.
Rossieta, H. (2017). Good governance mechanism, agency problems and privatized SOEs performance: Empirical evidences from Indonesian stock exchange. International Journal of Economics & Management, 11(Suppl. 2), 287–307.
Sabatier, P. A. (1988). An Advocacy Coalition Framework of Policy Change and the Role of Policy-Oriented Learning Therein. Policy Sciences, 21(2/3), 129–168. http://www.jstor.org/stable/4532139
Soubbotina, T. P. (2004). Beyond Economic Growth : An Introduction to Sustainable Development. Second Edition. Washington, DC: World Bank. https://doi.org/10.1596/0-8213-5933-9
World Bank. (2021). Listing State-Owned Enterprises in Emerging and Developing Economies. The World Bank Group. https://doi.org/10.1596/35919
References to legal acts and governmental decisions
Government of the Republic of Lithuania. 2009. “Decision No. 223 of the Government of the Republic of Lithuania dated 25 March 2009 regarding provision of overview report for 2008 to the Parliament of the Republic of Lithuania”. Accessed July 30, 2021. https://e-seimas.lrs.lt/portal/legalAct/lt/TAD/TAIS.339847?jfwid=124djr4tff.
Government of the Republic of Lithuania. 2009. “Decision No. 189 of the Government of the Republic of Lithuania dated 25 February 2009 regarding confirmation of the programe of the Government of the Republic of Lithuania for the period of 2008–2012”. Accessed July 30, 2021. https://e-seimas.lrs.lt/portal/legalAct/lt/TAD/TAIS.339847?jfwid=124djr4tff.
Government of the Republic of Lithuania. 2010. “Decision No. 1052 of the Government of the Republic of Lithuania dated 14 July 2010 regarding approval of SOE transparency guidelines and establishment of Governance coordination center”. Accessed July 30, 2021. https://e-seimas.lrs.lt/portal/legalAct/lt/TAD/TAIS.378545/ApfBFqWDqo.
Government of the Republic of Lithuania. 2016. “Decision No 19 of the Government of the Republic of Lithuania dated 4th April 2016 regarding the implementation of OECD recommendations related to the improvement of corporate governance principles in Lithuanian SOEs”. Accessed July 25, 2021. http://eimin.lrv.lt/uploads/eimin/documents/files/valst_valdomos_imones/conclusions.pdf
Parliament of the Republic of Lithuania. 2010. “The Law on the Implementation of Transparency Guidelines in the State Owned Enterprises of the Republic of Lithuania”. Accessed July 22, 2021. https://e-seimas.lrs.lt/portal/legalAct/lt/TAD/TAIS.378545?jfwid=bkaxn6dj
1 Note: 2 out of 5 key global industries SOE operate in are dominant both in Lithuania and Baltics, which shows the potential application of the research regionally and globally.
2 Note: It should be recognized that this dataset is limited to Lithuania and is one of the limiting factors of this study. Nevertheless, if the collection of similar indexes would be applied globally and/or at least to the OECD countries, it could serve as a huge impulse for further research and comparative analysis exploring the topic of SOE management effectiveness on a much wider scale.
3 Explanatory note: main indexes (Transparency, Board composition & structure, Strategic planning and implementation) are averages of the subindexes and while they vary from 0 to 10, the increment within main indexes can be less than 1 full unit.
4 Explanatory note: these variables were provided by GCC and we did not alter their definitions.