Ekonomika ISSN 1392-1258 eISSN 2424-6166
2023, vol. 102(2), pp. 145–165 DOI: https://doi.org/10.15388/Ekon.2023.102.2.8
Europe’s Energy Crisis; Winners of the Crisis with Market Data
Anıl Çağlar Erkan
Burdur Mehmet Akif Ersoy University, Turkey
Email: acerken@mehmetakif.edu.tr
https://orcid.org/0000-0001-9693-6556
Samet Gürsoy
Burdur Mehmet Akif Ersoy University, Turkey
sametgursoy@mehmetakif.edu.tr
https://orcid.org/0000-0003-1020-7438
Mesut Doğan*
Bilecik Seyh Edebali University, Turkey
https://orcid.org/0000-0001-6879-1361
mesutdogan07@gmail.com
Sevdie Alshiqi
University of Prishtina, Kososvo
sevdie.alshiqi@uni-pr.edul
https://orcid.org/0000-0002-1110-3078
Abstract. Prices of natural gas, coal, and electricity have risen to the highest level of the last ten years in the last quarter of 2021. It’s possible to express that energy prices in 2021 were much higher, compared to the crisis of 2020’s Covid-19 breakout’s historical descent in the first few months. There are a few factors to this rally. The epidemic caused structural fractions on a global scale. But in general, there is no doubt that crisis factors, which mainly concern Europe, are not limited (with) recovery process in the economy. With this notion, the main structure of this work’s subject aims to analyze the lead-up to the energy crisis that became apparent in 2021. Also, in the work, the energy crisis that’s been occurring will be analyzed thoroughly, with the help of its dynamics and causes. Within the scope of the study, the Hatemi-J (2012) asymmetric causality test was run using the weekly stock closing data of EU natural gas prices (EUGP), Gazprom (XGASPR), and Equinor (XEQUNR) for the period 05.11.2017–28.11.2021. As a result of the analysis, a causal relationship between the variables was determined. However, the work will positively contribute to the literature, being a guide to the current situations and overcoming the similar crisis that might occur in the future.
Keywords: Energy Crisis, Energy Prices, Natural Gas, Gazprom, Equinor
________
* Correspondent author.
Received: 12/12/2022. Revised: 10/05/2023. Accepted: 21/06/2023
Copyright © 2023 Anıl Çağlar Erkan, Samet Gürsoy, Mesut Doğan, Sevdie Alshiqi. Published by Vilnius University Press
This is an Open Access article distributed under the terms of the Creative Commons Attribution License, which permits unrestricted use, distribution, and reproduction in any medium, provided the original author and source are credited.
Introduction
Energy prices in the first months of the Covid-19 breakout were on a trend of descent. But in contrast to 2020, as we move on to the last quarter of 2021, the prices took a turn and they’ve been increasing with a record pace, setting the prices at all-time high in the last ten years. This dazzling climb of energy prices is at an unstoppable speed to the point where it threats the global economy’s recovery. As a matter of fact, the data says that it is actually threatening it. The dynamism of the global economy is critically important. Because the reason of this crisis is shown as the global economy’s dynamism, that’s been recovering compared to 2020. But there is no doubt that the mentioned dynamism is the main trigger of the crisis. Therefore, the main purpose of the study is to analyze the energy crisis in 2021 with all its dynamics in depth.
It is the European countries that have felt the energy crisis the most as of the end of 2021. Considering that there are serious tensions with Russia’s share in Europe’s energy consumption, a separate dimension of the crisis emerges. In addition, geopolitical issues such as Ukraine complicate the situation and require an in-depth analysis of the crisis. In the light of all these, the study consists of three parts. First of all, the crisis process experienced in the study will be discussed and the effective dynamics will be brought to light. Secondly, the dynamics of the energy crisis will be analyzed and the influence of Russia in the process will be discussed. In the last part of the study, the increase in energy prices in the European energy markets, the movements of the actors playing an active role in the energy flow between the parties, especially Gazprom, in the stocks traded in the relevant exchanges will be evaluated comparatively in natural gas prices, and the effect of Moscow on the crisis will be discussed. In terms of limitations, these analyses and discussions within the scope of the study are handled specifically for natural gas.
1. General Outlook of Global Energy Demand (2019–2021)
The Covid-19 pandemic is creating the biggest global crisis that can affect a generation, creating shock waves around the world that can cause permanent damage to health systems and economies, and society. The primary goal of almost all governments facing an unprecedented situation in recent history is expressed as focusing on controlling the epidemic and stimulating their economies (International Energy Agency, 2021). Since the first weeks of the epidemic, the energy sector, like others, has been severely affected by this crisis, which has brought economic activities to a halt in many aspects around the world. According to the report titled “Global Energy Review 2020” published by the International Energy Agency (IEA), the energy demand of countries that implemented full quarantine until April 2020 experienced an average decrease of 25 percent per week, and this rate was 18 percent in countries that went into a partial shutdown (International Energy Agency, 2021). In the report titled “BP Statistical Review of World Energy 2021 70th Edition,” where the energy data for the year 2021 are announced, the decrease for the whole year is expressed as 4.5 percent (BP, 2021: 10-13). In terms of natural gas, this figure decreased by 2.3 percent worldwide compared to the previous year (BP, 2021: 10-13). When considered in terms of consumption rates, oil ranks first with 31.2 percent, coal ranks second with 27.2 percent, and natural gas ranks third with a consumption rate of 24.7 percent. These fossil fuels are followed by hydro with 6.9 percent, renewable energy sources with 5.7 percent, and nuclear energy with 4.3 percent (BP, 2021: 52).
1.1. Overview of Global Oil Activities
Considering the associated activities including primary and all other energy sources globally, it is seen that the most important commodity is oil. The fact that it is among the important shaping dynamics of international politics increases the nature of oil many times over. So much so that oil takes on a quality beyond being a raw material from time to time, which is one of the indicators of this. In light of all these, it is possible to state that other important players, especially the main actors of the international system, give priority to oil-related activities compared to others. What is mentioned here is a total of 244.4 billion tons of oil reserves, which are asymmetrically distributed over the world geography. Asymmetrical distribution of oil reserves to world geography: The Middle East is 48.3 percent, South America 18.7 percent, North America 14 percent, Europe 8.4 percent, Africa 7.2 percent, and Asia-Pacific 2.6 percent (BP, 2021: 22). The country with the largest oil reserves in the world is Venezuela with a share of 17.5 percent, while Saudi Arabia ranks second with a share of 17.2 percent. Canada, on the other hand, is the world’s third economy with 9.7 percent oil reserves (BP, 2021: 22).
Another important issue with oil reserves is the activities covering the stage up to the consumption of the resources owned. Activities within the scope of production play an extremely critical role at this stage. Considering global oil production, the total oil production was realized as 88.4 million barrels/day by the end of 2020. While the lion’s share in oil production belongs to the USA, which was recorded as 16,476 million barrels/day, Saudi Arabia ranks second with 11 million barrels/day, and the Russian Federation (Russia) ranks third with 10 million barrels/day (BP, 2021: 18). The share of these three countries in total oil production is over 30 percent.
Along with the developments up to the oil reserves and production stage, another important issue is the data on consumption, which we can count among the most basic determinants of performance in other stages. According to the data published at the end of 2020, the world’s total oil consumption was 88.4 million barrels/day. The USA, which consumes 17 million barrels/day of oil, ranks first, followed by China and India. China’s oil consumption was recorded as approximately 14 million barrels/day, while India’s was recorded as approximately 4.6 million barrels/day. The shares of these countries in the world’s total oil consumption are 19.4 percent, 16.1 percent, and 5.3 percent, respectively (BP, 2021: 22). When all these are taken into account and compared to the previous year, a very interesting picture emerges. Leaving aside the global oil reserves, the decrease in oil production and consumption by the end of 2020 is one of the most important reasons for this. So much so that compared to the previous year, oil consumption decreased by approximately 9.3 percent and production decreased by approximately 7.4 (BP, 2021: 22). It is possible to state that the developments in 2021 are shaped in the light of the global decline.
1.2. Overview of Global Natural Gas Activities
Due to its characteristics and nature, natural gas is among the most important primary energy sources that combine opportunities and threats. One of the most important features of natural gas is that it is connected to an energy source. Considering the environmental dimensions of energy security, this quality of natural gas is extremely important, and the increase in global demand after the 1973 global oil crisis is one of the indicators of this. However, at this stage, it is useful to mention the threats posed by natural gas due to the negativities. The most important of these negativities are related to the transportation and storage of natural gas. So much so that natural gas is transferred from the producer to the consumer through pipelines in the most efficient way, and the infrastructure that can be stored in large quantities has not been fully established yet. Related to this, although some progress has been made in the field of “Liquefied Natural Gas (LNG),” the distance covered regarding the storage problem is still far from meeting expectations.
To have a clearer understanding of the activities related to natural gas on a global scale, it is useful to first mention the amount and geographical distribution of the reserves. In this direction, when considered in terms of quantity, global natural gas reserves are announced as 188.1 trillion cubic meters by the end of 2020 (BP, 2021: 34). The said reserves are 40.3 percent in the Middle East, 30.1 percent in the Commonwealth of Independent States (CIS), 8.8 percent in Asia-Pacific, 8.1 percent in North America, 6.9 percent in Africa, and 4.2 percent in South-Central America and 1.7 percent in Europe (BP, 2021: 34). More specifically, the world’s top two ranks in terms of reserves are Russia and Iran. Russia has 37.4 trillion cubic meters and Iran has 32.1 trillion cubic meters of natural gas reserves (BP, 2021: 34).
The first step of the activities related to natural gas on a global scale is the production phase. The data announced on natural gas production in 2021 are highly instructive. For example, the report titled “BP Statistical Review of World Energy Outlook 2021 70th Edition” emerges as an important source for accessing the reliable data announced in 2021. According to BP’s aforementioned report, as of the end of 2020, the total world natural gas production was 3853.7 billion cubic meters. The United States of America (USA), which produces 914.6 billion cubic meters, which corresponds to 23.7 percent of the world’s total natural gas, ranks first, while Russia, which produces 638.5 billion cubic meters, which corresponds to 16.6 percent, ranks second in this regard. While Iran follows the top two countries, Tehran produces 250,8 billion cubic meters of natural gas, which corresponds to 6.5 percent of the world’s total, according to the end of 2020 data (BP, 2021: 34).
Another step of the activities related to natural gas on a global scale is the consumption phase. When considered in terms of consumption, and compared to production quantities, we see directly proportional data valid for the first two rows of the ranking. The USA, which produces the most of natural gas, ranks first with a consumption of 832 billion cubic meters, while Russia ranks second with a consumption of 411.4 billion cubic meters (BP, 2021: 38). However, it can be misleading from time to time to refer only to data on reserves, production, and consumption within the scope of activities related to global energy resources. It would be extremely useful to mention the natural gas import and export amounts about access to resources, which we can consider within the scope of consumption. In such an environment, Russia is the most important natural gas exporter, while the European Union (EU) and China are the importing economies. When considered in terms of the formation and operability of the market mechanism, especially the European market comes to the fore.
2. Gazprom and European Natural Gas Market
Considering Russia specifically, Gazprom emerges as a “state within a state” entity. The process of Gazprom’s integration with Russia’s state administration is based on the company’s transformation in the last years of the Union of Soviet Socialist Republics (USSR). So much so that in 1989, shortly before the disintegration of the USSR, the Russian Ministry of Natural Gas was transformed into a state-affiliated entity under the name Gazprom. Therefore, Gazprom, which took over the authorities of the Ministry, became the executive of the activities in this field. As a result, the transition period started with Gazprom, not with the government, but with the European market, to which the USSR Ministry of Gas supplied natural gas. On the other hand, the dominance of the Russian state over Gazprom was quite different at that time compared to today. One of the most important reasons for this is the wind of privatization, which was blindly adhered to in the first years of Russia, starting from the USSR period. It is possible to say that Gazprom, like the others, was affected by the crazy privatization wind, even though it emerged with the transformation of the Russian Gas Ministry. Therefore, it is worth emphasizing that the Kremlin’s dominance over Gazprom took place step by step over a certain period. In this process, especially with Putin’s coming to power, the changing management approach has been effective. In other words, putting Gazprom under state control is a product of Putin’s management approach. It is possible to deal with the fact that the Kremlin, which held 41 percent of the company’s shares in the 1990s, increased its share to over 50 percent in 2005 and became the majority shareholder (Gazprom, 2005). However, the rapidly developing company is now the owner of the world’s largest natural gas system, with a total length of 175,000 kilometers in the country. The fact that Russia has energy assets that make up 16 percent of the total installed capacity of the national energy system is one of the indicators of the current level of the company (Gazprom, 2021). When considered as production capacity, this capacity is more understandable. Such assets under the control of the company mean that Gazprom is capable of meeting 12 percent of global natural gas production and 68 percent of domestic production (Gazprom, 2021).
Gazprom, which has been the main supplier to many European countries for more than half a century, is also the largest natural gas exporter in the European market. As of the end of 2020, Gazprom Group exported 219 billion cubic meters of natural gas to consumers only outside the disintegrating USSR countries. Net income from these sales totals 1,811.6 billion rubles (Gazprom, 2021). The importance of these revenues for the Kremlin will be more understandable when the country’s budget and its share in the European market are taken into account. So much so that while Gazprom’s contribution to the Federal Budget is 1 billion rubles per day, its share in the European market is expressed as 32.2 percent (PJSC Gazprom, 2021). Being the sole owner and operator of the combined natural gas transmission system, Gazprom carries out its domestic and international transportation activities through nearly 20 companies. For example, Gazprom Export is one of the most successful and developed companies in Russia. The company in question is a subsidiary of PJSC Gazprom, which holds all its shares. For more than fifty years, Gazprom Export has made a significant contribution to the reliable supply of Russian natural gas, energy security in Europe, and the Russian federal budget revenues. The natural gas exported by Gazprom Export within the framework of contracts is around 175 billion cubic meters (Gazprom Export, 2021). This makes Gazprom a natural gas giant with a market value of 5 trillion rubles, according to statements at the end of 2020.
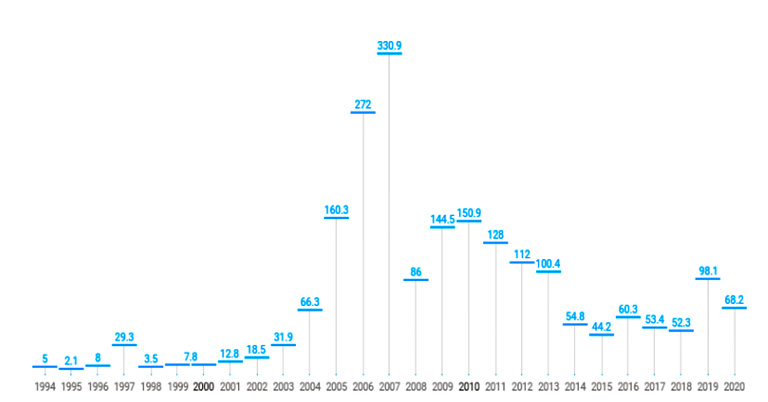
Chart 1. Gazprom and Market Cap by Years
Source: (Gazprom, 2020).
Gazprom, one of the most important actors in the European natural gas market, carries out its activities in this area through established partnerships and partners in cooperation. Among the companies with which the company has signed agreements recently are Italian ENI, French Gaz de France, Dutch Gasunie, German BASF and E.OnRuhrgas stand out, while Austrian OMV AG., Bulgarian Bulgargaz EAD are other important partners (Akçapa, 2020: 152). In addition to these, Gazprom, which is the owner or shareholder of nearly ten important companies operating in the sector such as German Wintershall and Wingas, has similar partnerships in important countries such as France, Italy, and England (Gazprom, 2018).
Gazprom’s operation in the European market is not a new phenomenon. For example, the company history of Gazprom, which was established as one of the parts of the Soviet state mechanism, shows that Russia started to export natural gas to Poland in 1940 (Akçapa, 2020: 121). It is possible to state that Poland is Russia’s first natural gas export destination (Akçapa, 2020: 122). However, this step taken toward Poland should not be considered an ordinary commercial move. Even though it seems like a commercial move, the export to Poland is important in that it is the first natural gas export to Western Europe (Akçapa, 2020: 122). In addition, the said initiative is also very important in terms of its effect on the developments in the next period. Because Soviet Russia’s next move was to export natural gas to West Germany and Italy in 1969. This means that Moscow opened itself to the capitalist economic system for the first time (Akçapa, 2020: 122).
Russia is currently the main natural gas supplier of many European countries, especially the EU. It is a well-known fact that many continental countries have become 100% dependent on Russian natural gas. This provides significant advantages to Gazprom, which is one of the most important actors in its foreign policy, especially Russia, and the gains made are directing such energy companies of the Kremlin to initiatives that will serve their long-term interests, especially economic ones. It is possible to consider the transformation of energy companies such as Rosneft, Novatek, and Lukoil, especially Gazprom, into “national champions”. Such an orientation plays a key role in making European economies more dependent on Russian natural gas. So much so that Europe’s level of dependency will increase and it will become inevitable for Gazprom to establish dominance in the European natural gas market. This scenario has been witnessed for a while. The EU’s characterization of Gazprom’s activities as a source of concern is one of the indicators of this.
Considering the developments until recently, it is possible to state that Gazprom has achieved a significant part of what it wants in the European natural gas markets. Studies that systematically explain Russia’s gains from its initiatives in the European natural gas market through Gazprom by analyzing the process with the energy weapon model can be found in the international relations literature – “albeit in small numbers”. Based on the developments in the energy weapon model and the achievements of Russia, lies the dependence of the European countries on themselves. Essentially, this dependency also means that Russia is a threat to EU energy security (Popovic, 2020). There is data to support the potential impact of Russia on EU energy security and recent developments. It is possible to evaluate the data on the dependency ratio announced by Eurostat in this direction. Accordingly, Eurostat announced the EU’s dependency ratio as 61 percent in 2019. This means that more than half of the EU’s net energy needs are met through imports. These rates vary according to the members of the Union. For example, this rate varies between 5 and 90 percent from Malta to Estonia (Godzimirski and Nowak, 2018: 222). The prominent suppliers in the EU’s increasing dependence on oil and natural gas imports are Russia and Norway (Eurostat, 2021). On the other hand, Russia is relatively more prominent because of Gazprom, which controls nearly one-third of the European natural gas market.
Russia is the most important partner of the EU, especially in the context of natural gas. Högselius describes the Russia–EU partnership as “system-building coalitions” (Högselius, 2013: 5). While this interaction between the parties, which appears to be of close interdependence, brings with it some consequences, it is possible to consider Russia’s opening the door to the most important opportunities in terms of natural gas policy (Godzimirski and Nowak, 2018: 230). Undoubtedly, the opportunities obtained and the effects of the stage reached in the relations are the result of a certain important process. Russia’s initiatives in the EU market constitute one of the important pillars of this process. In the outputs at the end of this process, the political methods and tools that Russia put into practice through Gazprom are extremely effective. It is possible to consider methods and tools such as long-term agreements, investments in the energy sector, partnership projects, and strategic infrastructure projects (Tichy, 2019: 22-23). These methods and tools caused Gazprom to increase its influence on an incredible scale until recently, and its image in the market to reach a level that creates a perception of monopoly. From time to time, it has been witnessed that some of Gazprom’s practices that shifted to the political axis in the European energy markets, although it caused the crisis, the member states could not react effectively. For example, even though many EU countries were affected by the natural gas cuts to Ukraine in January 2006 and January 2009, it is possible to evaluate that none of them had an effective and meaningful counter-reaction to Gazprom(Overland, 2017: 116). It was even witnessed that quite a few Western European countries took a supportive stance towards Gazprom in this process.
3. The Energy Weapon Model and the Effect of Increase in Prices
When it comes to Russia and strategic energy resources, the first thing that comes to mind is the events related to the use of these resources as leverage in foreign policy. Russia’s actions in this direction are discussed in detail in many literature studies. However, Karen Smith Stegen’s study titled “Deconstructing The ‘Energy Weapon’: Russia’s Threat To Europe As Case Study” published in 2011 is one of the main reference sources for this study, although it is one step ahead of the others due to its systematic approach to the subject. Stegen’s aforementioned study is important in terms of analyzing the use of energy resources as leverage in foreign policy within the framework of a systematic model. In addition, the energy weapon model developed by Stegen provided a systematic perspective to the field and contributed significantly to the adaptation of the international relations literature to the dynamism of the changing conditions of the period in line with the new conceptual framework it drew (Erkan and Ateş, 2019: 431).
While the Energy Weapon Model emphasizes the need for some conditions to be realized in an interconnected and gradual manner in terms of analysis, Stegen (2011: 6505) considers the conditions suggested by the model as four stages. In this direction, in the first stage, the actor should dominate energy resources and strengthen their control over them. When the second stage is passed, this actor should be able to take under his control and manage the transmission lines or transit routes for the transfer of energy resources. In the third stage, this state administration can directly or indirectly intimidate, punish or reward the resources it has in line with the political purposes of this state administration against the targeted consumers. In the fourth stage, the effects of the reaction to the effect of these moves on the opposite side should be observed (Stegen, 2011: 6506).
In terms of Russia, strong findings are expressed in the literature regarding the use of energy resources as a weapon, especially natural gas within the framework of Stegen’s model. When considered in light of recent developments, it is witnessed that Russia has made new moves in energy toward Europe. It is possible to explain these moves within the scope of the model. So much so that we are witnessing that Russia has already carried out the first three stages within the scope of the energy weapon model. Therefore, in the following situation, the process of the reaction of the other party, which is included in the fourth stage, should be addressed. It is necessary to mention the developments that caused the recent crisis. It is thought that the progress of the process, the moves of the parties on the subject, and their approaches to the subject will be guiding within the framework of the developments.
4. Development Process of the Energy Crisis in Europe and Its Dynamics
By leaving behind the devastating effects of the Covid-19 epidemic on the global economic system, Russia’s practices related to energy resources towards European countries, one of the locomotive actors of the recovery process around the world, brought a new crisis environment. The most important reason for the development that caused the crisis is undoubtedly the increase in both natural gas and electricity prices in Europe by more than 250 percent in the last 11 months. At this stage, the increase in the markets will be more understandable when compared with the prices of the previous period. So much so that the prices of forward natural gas contracts traded at TTF (Title Transfer Facility), the Netherlands-based natural gas trading point with the deepest depth in Europe, decreased to 3.75 Euros per megawatt/hour in 2020 when demand fell due to the epidemic. While the price of natural gas was 12 Euros per megawatt/hour in TTF last September, it increased to 85 Euros on 27 September, breaking the all-time record. This means that the price of natural gas in monthly forward contracts in Europe has increased by more than 600 percent in the last year (Yeni Şafak, 2021) Therefore, it is possible to say that the price increases are due to several factors that we can classify as visible and invisible. According to analysts, increased energy consumption and supply constraints due to extreme cold and heat waves are some of the reasons for the apparent high prices. Related to this, analysts also point out that the crisis will intensify and prolong due to the combination of temporary and structural problems (Euronews, 2021).
While Europe has learned important lessons from the natural gas cuts originating from Russia in 2006 and 2009, it has implemented a series of regulations, taking into account the future possibilities, to avoid similar problems in this direction. However, this crisis that occurred in 2021 is of a slightly different nature. So much so that, considering the time frame until November 1, 2021, the most important difference of this crisis from the others is that it is not a “completely” interruption problem yet. Instead, the main factors that are currently causing them distress, relative to Europe, are the rise in prices associated with natural gas and the decrease in the volume of supply. Therefore, it is possible to state that European countries are of the opinion that Russia will not be able to play the cut-off game in 2006 and 2009 again. Europe’s thinking in this direction seems generally rational. However, it should not be overlooked that Moscow still has many tools that it can use to put pressure on Europe and make itself richer (Dempsey, 2021). The invisible causes of the energy crisis in Europe emerge at this point.
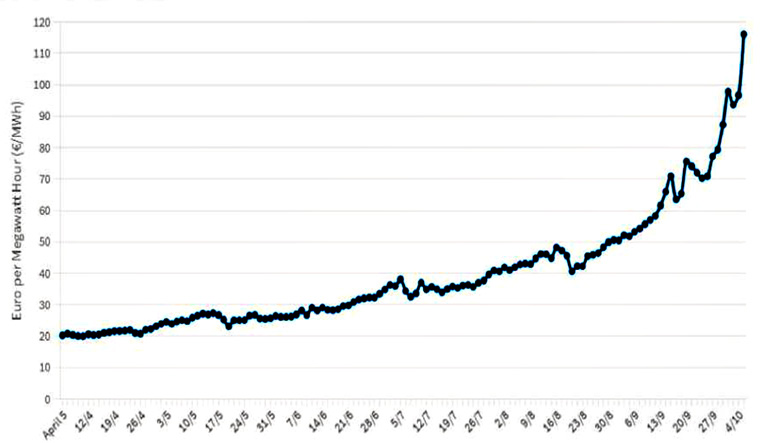
Chart 2. Development of Natural Gas Prices in European Markets as of April 2021
Source: (Cohen, 2021).
The world public opinion agrees that Russia is the invisible cause of the energy crisis in Europe. There is very strong evidence that pushes the world public opinion, especially European countries, to this idea. It is possible to consider Russia’s initiatives, which started as of October 2021. The developments in the natural gas framework between Moldova and Russia are extremely important. So much so that the parties are in disagreement on the extension of the natural gas contract, which expired on September 30, between Moldova and Russian energy giant Gazprom. The existing agreement between the parties was extended for a period of one month and Moldova purchased each thousand cubic meters of natural gas for 790 dollars throughout October. The subject of disagreement between the parties is that the price in October was well above $550 in September. Therefore, Moldova had to pay 240 dollars more for the same amount of natural gas in October compared to the previous months (Necsutu, 2021). When evaluated together with what happened in the following days, it becomes indisputable that the serious increase in natural gas prices is a part of the energy crisis in Europe. The factor that makes the natural gas dispute between Moldova and Russia important is beyond the disagreements on prices. Considering what happened in the process, it caused Europe to reconsider its opinion that Russia would not cut natural gas. Because Gazprom’s attempt towards Moldova is actually the price dispute, as well as the request to pay the 709 million dollar debt that the Chisinau administration objected to. Therefore, in the unlikely event that Gazprom cuts off to Moldova, the threat of interruption comes to the fore (Rosenberg, 2021).
It is possible to state that it will be guided within the scope of the study to refer to the developments in the process to understand more clearly whether Russia has a direct or indirect effect on the process of the deepening energy crisis in Europe. The developments on November 1, 2021, are of great importance in terms of a clearer understanding of the process. The forerunner of what happened on that date took place in October 2021. So much so that in October 2021, Russia announced that it had reduced the amount of natural gas pumped via the Yamal–Europe line to Western European countries by one-third. It is possible to describe the effect of this interruption by Gazprom as “pouring gasoline” on Europe’s fight against the energy crisis. To mention the amount of the cut, Germany-based distribution company Gascade announced the number of cuts has decreased from 2.2 billion cubic meters to 0.8 billion cubic meters (CNNTürk, 2021). Russia’s moves within the scope of the cuts were not limited to this. So much so that Gazprom announced on the same date that it had stopped the flow of natural gas sent to Hungary via Ukraine. The statement made by the Ukrainian Gas Delivery System Company in October 2021 is as follows: “The Russian energy company Gazprom has stopped the natural gas flow to Hungary through Ukraine.” The statement also pointed out that although the agreement on the amount of natural gas is 24.6 million cubic meters per day, the flow has stopped (TASS, 2021). The amount of natural gas to which the flow is interrupted is 24.6 million cubic meters per day (Morrow, 2021).
Although it is perceived as a show of power, Russia’s initiatives towards Europe are not unexpected considering the energy resources in this process. Therefore, Europe should be better prepared for such a move by Russia. Because, both in its strategy documents and in the statements made by Gazprom and government officials, Russia has stated at every opportunity that it will reduce the amount of natural gas sent to Europe via Ukraine and that it will implement transmission line projects that will bypass this country. However, this does not mean that Russia does not use its energy resources as a weapon in its relations with European states or does not seek power gain. In this respect, it would be a more correct approach to consider issues such as power and weapons in Russia’s foreign policy aims, among the unseen reasons for the initiatives, within the scope of the energy crisis in Europe. Therefore, the reasons that appear in the analysis of the crisis process should also be taken into account.
It is possible to discuss the apparent causes of Russia’s European energy crisis under two headings. Almost all of these reasons are related to the Ukraine Crisis, which has been going on since 2014. First of all, Russia, which is in a transit position in the natural gas sent to Europe for energy, poses the question of its existence with Ukraine. So much so that Russia accuses Ukraine of not paying its debts and stealing natural gas during transit transmission, as in previous crises. A second reason emerges for this. Russia has turned to alternative routes to solve the transit problems experienced in the natural gas transmitted to Europe via Ukraine. It is possible to consider the Turkish Stream and Nord Stream 1-2 projects in this context. Leaving aside the developments regarding the Turkish Stream, we can say that the second reason that triggered the crisis is related to the Nord Stream transmission lines. However, to understand the reason in question more clearly, it is necessary to realize at this point that Nord Stream is not a simple alternative transmission line bypassing Ukraine. Because the importance of the transmission line in question is beyond the nature of an alternative route or diversification initiative. One of the most important features of Nord Stream lines is that they reveal the differences in approach among EU members. So much so that it is known that the EU has a difference of opinion on the issue of Nord Stream. In addition to this, another feature is that Nord Stream transmission lines are at the center of the second reason, due to the key role they played in the process, being one of the triggers of the crisis that Europe had problems with. In other words, it is possible to state that the developments related to Nord Stream lines were effective in Russia’s involvement in the energy crisis in Europe.
After the Ukraine crisis, the sanctions imposed on Russia by many countries, especially the USA and the EU, are the most important triggers of the process related to Nord Stream transmission lines. The connection between the transmission lines of the sanctions emerges within the scope of the Nord Stream 2 project. While some of the EU members such as Germany witnessed the USA abstain from the sanctions against Nord Stream 2 in the first period, some such as Poland displayed a supportive attitude. However, the differences of opinion among the members did not prevent the implementation of the sanctions. On the other hand, the EU’s stance has been to exclude the natural gas trade from sanctions against Russia. Therefore, even though it has excluded the natural gas trade, the EU is now in the position of one of the parties that impose sanctions on itself in the eyes of Russia. In this process, Russia’s counter-reaction emerges as an orientation toward the Eastern market. However, this orientation of Russia does not mean breaking relations with Europe. In fact, despite the sanctions related to the Nord Stream 2 project, care has been taken to ensure that the process continues despite the interruptions with the important locomotive powers of EU member states, especially Germany. However, some developments during the implementation of the Nord Stream 2 project could not prevent the association of the energy crisis in Europe. The most important developments in this process are the attitude of Russia towards the countries that are against the Nord Stream 2 project and support the sanctions, which creates the impression that Russia is using energy resources as a trump card in the agreements covering the new period, and the statements made by Armin Laschet, who is known as Merkel’s heir. The effect of what happened during the agreement process in the crisis process is already known. Therefore, at this point, it is the statement of Germany, which supported Nord Stream 2 during Merkel’s era and even played an important role in reaching an agreement with the USA on sanctions, which gives the impression that it will change with Laschet. After Russia, which she thought to have played a role in the crisis, using natural gas, one of the biggest trump cards in its relations with the EU, as a political power, Merkel’s successor Armin Laschet told Russia, “If you turn down the gas, even if the construction is finished, the flow in Nord Stream 2 It is possible to consider giving the ultimatum “we will stop” (Sarı, 2021). On the other hand, the escalation of the crisis is not limited to only ultimatum-like statements. Therefore, it is possible to state that the concrete steps taken by Germany in this context have deepened the crisis process. Therefore, it is extremely wrong to expect Russia to react negatively in the face of such a situation. So much so that in the incident in November 2021, it is clearly seen that Russia reacted against Germany’s attitude. In this regard, it is possible to consider the 17 percent increase in natural gas prices in Europe after the German energy market regulatory agency (Bundesnetzagentur-BNetzA) suspended the licensing of the Nord Stream 2 pipeline, which is planned to transport natural gas from Russia to Germany (BBCNews, 2021). In light of all this, it is possible to state that any behavior of European countries against Russia against the increasing pressure deepens the crisis even more (Ambrose, 2021).
Whether Russia is one of the main causes of the European energy crisis is debatable. On the other hand, the only certain thing is that the deepening and continuing crisis process provides advantages in favor of Moscow. Amos Hochstein, one of the expert advisors to the US State Department at the time, said, “Russia did not cause Europe’s energy crisis, but it did not help either. Instead, they tried to take advantage of the crisis environment and it did so” are indicators of this (Ng, 2021). Considering the share of revenues from the export of energy resources in the Russian economy, there is no doubt that Moscow will be one of the advantageous sides of the crisis, even only related to the rising prices. According to the world’s leading investors, the crisis situation should be seen as a blessing for Gazprom. The 15 percent increase in the company’s share prices in a short period of one month supports this idea. In addition, it is possible to consider the statements of Andrei Gromodin, one of the Sberbank analysts, that “Gazprom’s revenues in the next three years will be more than the sum of the past ten years” (The Moscow Times, 2021). However, Russia is not the only winner of this crisis, because Russia is not the only natural gas supplier to European countries. European countries also import natural gas from different suppliers, albeit in limited quantities. Norway is an example of this. Norway can profit from the European natural gas crisis. To understand the situation in question more clearly, it is necessary to analyze whether there is a connection between the price movements during the crisis and the financial indicators of the energy companies operating in the European natural gas market. In the next part of the study, the price movements in the European markets and the financial performances of the energy companies supplying natural gas to these countries are analyzed in light of various indicators.
5. Movements in the Shares of the European Natural Gas Market and Energy Companies During The Crisis
We analyze of the changes in the price movements in the important natural gas markets of the region during the energy crisis in Europe and the changes in the shared values of the energy companies that are traded in the stock exchanges. The share movements of Russian Gazprom and Norwegian Equinor, which are the most important natural gas suppliers of European economies, will be a guide. However, it should be underlined that considering Gazprom and Equinor within the scope of the study is not an ordinary choice. Therefore, it is possible to talk about the effect of several factors on the preference of these energy companies. The first of these is the share and active role of the said companies in the European natural gas market, the other is that Russian Gazprom is among the invisible causes of the crisis, and Norwegian Equinor, one of the qualified actors of this market, is another main supplier.
5.1. Methodology
It is possible to analyze the effects of European natural gas prices on the stock returns of Gazprom and Equinor companies using various methods. Within the scope of the study, the Hatemi-J (2012) asymmetric causality test was run using the weekly stock closing data of EU natural gas prices (EUGP), Gazprom (XGASPR), and Equinor (XEQUNR) for the period 05.11.2017–28.11.2021. In addition, the Lee–Strazicich unit root test, which also takes into account structural breaks and tests stationarity, was used to investigate the relationship between variables. Data on EU natural gas prices used in the methods within the scope of the methodology were obtained from websites such as “www.cmegroup.com” and company stock data from websites such as “www.investing.com” whose reliability was proven by comparative testing.
Several requirements arise about the methodology in terms of the results of the analysis and the reliability of the findings obtained. For example, in studies related to time series, spurious regression should be avoided for the reliability of the results. For this, first of all, the series must be stationary. However, the unit root test developed by Lee and Strazicich (2003, 2004) tests stationarity by taking into account the structural break situations of the series. The method used in the LM unit root test is as follows:
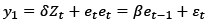 (1)
(1)
In equation (1), the vector of exogenous variables Zt represents the error terms with the property εt ~ iid N(0,σ2). It is important to choose the model in the unit root test with the Lee–Strazich break. It is stated that the A model, which takes into account the break at the level and the B model, which takes into account the break in the slope, are superior to the C model, which takes into account the break at both the level and the slope,. In this study, the C model was used, which takes into account one and two breaks in level and slope (Gürsoy, 2021: 74). The model A that includes two changes in level is expressed as Zt = [1, t, D1t, D2t]. Here; For Djt = 1, t ≥ Tbj + 1, j = 1,2 becomes and for the other cases it is 0. Tbj diparententhe break time.parent on the other hand, iparent2 changes in train and level. The model is defined as Zt = [1, t, D1t, D2t, DT1t, DT2t]. Here; t ≥ Tbj + 1, j = 1, 2 for DTjt = t – Tbj and 0 for other cases. While the data creation process (DGP) includes breaks under the main hypothesis (β = 1) the alternative hypothesis is (β < 1), Lee and Strazicich used the following equation to obtain the LM unit root test statistic.
 (2)
(2)
Here  , t = 2,…,T, and
  are the coefficients obtained from ∆Zt in the regression of
  , is found by y1 – Z1δ where y1 and Z1 are the first elements of yt and Zt in the specified order (Lee and Strazicich 2003: 1083).
Hatemi-J (2012) asymmetric causality test, which was applied within the scope of the study to investigate the relationship between selected variables, will help to monitor the dynamics of the series and allow to develop possible future predictions.
The hypotheses related to the research are organized as follows:
H0: There is no causal relationship between the EUGP variable and XGASPR, or UQUNPR variables.
H1: There is a causal relationship between the EUGP variable and XGASPR, and UQUNPR variables.
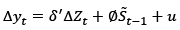
While testing the causality relationship between the two integrated variables y1t and determined for the study, the analysis is carried out using the following equations.
 (3)
(3)
Here, t = 1, 2,…T represent the constant terms, y1t and y2t represent the initial value, ε1i and ε2i represent the error terms. Positive and negative shocks are expressed in the equation
 (4)
(4)
It is expressed as  ve
ve 
equations (3) and (4) were rewritten below
 (5)
(5)
Finally, the positive and negative shocks in each variable are expressed in cumulative form as follows:
 (6)
(6)
Then, assuming  the causality relationship between the positive components is tested with the help of the p-lagged vector autoregressive model (VAR). The VAR (p) model is expressed as in equation (7):
 (7)
(7)
Here,yt+, is expressed as a 2x1 variable vector, v 2x1 constant variable vector, ut+ 2x1 error term, and Ar is a parameter matrix determined by using the 2x2 lag length information criteria of the order “r”. (Hatemi-J, 2012: 449-450);
5.2. Findings
In this part of the research, the empirical findings of the research are given.
The time series of the variables used in the study are included in Chart 3. EUGP, XGASPR, and EQUNR variables increased significantly in 2021.
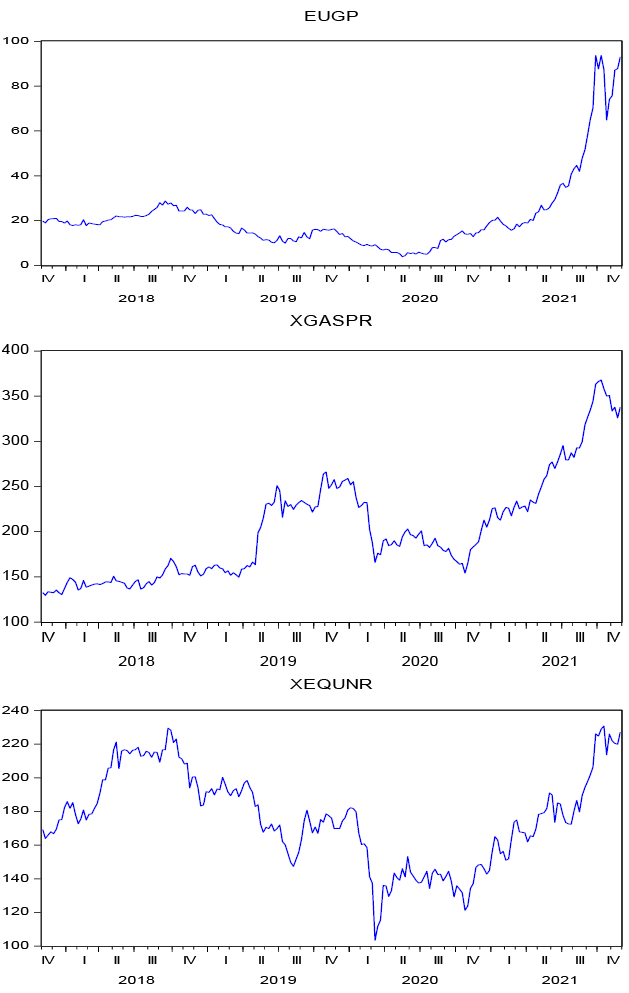
Chart 3. Time Series of the Variables
According to Table 1, when the Lee–Strazich unit root tests are examined, it is determined that the XGASPR variable becomes stationary at I(0), while the EUGP variable and XEQUNR variable become stationary after an I(1) difference is taken. In addition, it is striking that there are important turning points in the tables related to the historical process. The dates when significant changes in share movements are related to the rates in the natural gas markets come to the fore. To put it more clearly, it can be claimed that the dates when the connection between the movements in the natural gas markets and the share values of the companies considered in the indicators in the tables became visible should be considered as turning points. On the other hand, it is among the possibilities of the study that the thought that some factors were ignored in the dates that are considered as turning points in the progress of the process. The most important factors are undoubtedly the discourses, which are among the natural outputs of the contacts in the interaction process between the actors in the position of supplier and consumer. Although the factors in this context are not ignored in the study, it is possible to state that they played a role in the determination of the aforementioned dates, which are turning points. On the other hand, it should be underlined that the quality of the role they play is considered among secondary factors.
Table 1. Lee–Strazicich (Model C) Unit Root Test Results
|
Series |
I(0) |
Break Dates |
Critical Value |
1.Difference |
Break Dates in Difference |
Critical Value |
|
Stat. |
Stat. |
|||||
|
EUGP |
-3.585332 |
November 2020 |
-4.208333 |
-7.468232** |
November 2021 |
-4.098013 |
|
XGASPR |
-6.395767** |
December 2019 |
-4.280843 |
- |
- |
- |
|
XEQUNR |
-3.103129 |
March 2020 |
-4.278867 |
-7.042555** |
May 2020 |
-4.257824 |
** denotes significant at 5%.
Table 2. The Results of causality Tests
|
Null Hypothesis |
Test Value |
Bootstrap Critical Values |
Hypotheses |
||
|
1% |
5% |
10% |
|||
|
EUGP+ => XGASPR+ |
37.174 |
16.043 |
8.574** |
6.303 |
H0: rejected, H1: accepted |
|
EUGP– => XGASPR– |
62.699 |
22.591 |
10.487** |
7.868 |
H0: rejected, H1: accepted |
|
EUGP+ => XEQUNR+ |
48.161 |
15.102 |
10.276** |
8.230 |
H0: rejected, H1: accepted |
|
EUGP– => XEQUNR– |
39.024 |
13.086 |
8.718** |
6.757 |
H0: rejected, H1: accepted |
The denotation A ≠> B means that variable A does not cause variable B. The denotation A => B means that variable A causes variable B.
** denotes significant at 5%.
Source: Generated by Authors
According to Table 2, a causality from EUGP to XGASPR and XEQUNR was tested using the Hatemi-J (2012) asymmetric causality test. The model investigates the causality relationship between the cumulative positive and negative changes of the variables. Due to the setup of the study, EUGP was determined as the only dependent variable. XGASPR and XEQUNR were taken as dependent variables, and analyses were performed in the form of binary tests. In this direction, accordingly, 4 equations in total were established in 2 positive directions and 2 negative directions. In the tests, in which the results at the 5% significance level were taken into account, it was determined that all the equations constructed contained statistically significant causality in both positive and negative directions. Based on this, it was found that H0 was rejected, and H1 accepted for the entire run. It was seen that the strongest interaction was on the XGASPR index from EUGP in general, and a negative causality was detected.
According to the results of the equation, in which a positive causal relationship was tested from the EUGP of European Natural Gas prices, Gazprom share returns to the XGASPR index, the Wald statistical value (37.174) was found and it was found to be significant because it was greater than the bootstrap critical value (8.574). In another equation in which negative causality was tested in the same direction, the Wald statistical value (62.699) was found, and it was found to be significant because it was greater than the bootstrap critical value (10.487). In both cases, the H0 hypothesis was rejected and the H1 hypothesis was accepted.
On the other hand, according to the results of the equation in which a positive causality relationship was tested from EUGP to Equinor stock returns to XEQUNR index, Wald statistical value (48.161) was found and it was found to be significant because it was greater than the bootstrap critical value (10.276). However, in another equation in which negative causality was tested, the Wald statistical value (39,024) was found to be significant because it was greater than the bootstrap critical value (8,718). In both cases, the H0 hypothesis was rejected and the H1 hypothesis was accepted.
Conclusion
It is obvious that European economies have been facing a crisis situation due to the serious increases in energy prices for a while. The Covid-19 epidemic, which deeply affects the functioning of global economic systems, has a quality that further increases the negative effects of the said crisis. It is possible to state that the Covid-19 epidemic process acts as a catalyst for the negative effects of the energy crisis faced by Europe to be felt more than normal. On the other hand, it should be underlined that the Covid-19 epidemic is not the only or the most important reason for the crisis. It is the right start to discuss the causes of the crisis under the headings of visible and invisible, to analyze the process more clearly. When considered in terms of obvious reasons, the most important dynamic is the reflection of the deterioration in the supply and demand balance as a significant increase in prices. In addition, it is extremely difficult to reach such a definitive judgment in terms of invisible causes, but it can be misleading. Therefore, at this stage, focusing on the effects of the crisis rather than its causes allows more accurate outputs to be reached in the analysis of the process. When all these are taken into account, it is witnessed that the effects of the crisis process are not only negative but that there are also segments that make significant gains. In other words, it is possible to state that the effects of the crisis environment triggered by the increase in energy prices appear in two different categories as threats and opportunities. It is possible to deal with the current import dependency problem of European economies as consumers and the negative effects of their energy security and threats. When considered in terms of opportunities, energy companies emerge as the segment that gains significant gains from the process. In fact, in light of the data obtained, it was seen that the increase in gas prices had an impact on the share returns of Russia’s Gazprom and Norwegian Equinor, one of the most important natural gas suppliers in Europe. According to the Hatemi-J (2012) asymmetric causality results performed on the variables, it has been found that increases and decreases in European natural gas prices have both positive and negative effects on Gazprom and Norwegian Equinor stock returns. The increasing natural prices coincide with the increase in the shares of the companies, and the companies gain from this process.
Ethical Statements
The authors of the manuscript declare that the research is the author’s original work, it was not published elsewhere, or is not being currently considered to publish elsewhere. The manuscript appropriately credits the co-authors’ meaningful contributions, and the results are appropriately placed on previous and current research.
Consent to Publish
The authors have consented to participate in this research and publish it.
Funding
The authors declare that no funds, grants, or other support were received during the preparation of this manuscript.
Competing Interests
The authors have no relevant financial or nonfinancial interests to disclose.
Availability of data and materials
The data that used in this manuscript was derived from www.investing.com on 29th November 542 of 2021. It can be reached at 1) https://tr.investing.com/equities/equinix,- inc.?__cf_chl_jschl_tk__=.47XjsYJmf2HVLkQovXknpC0_tCN3UmW3RgVXaJS1zs-1641197495-0-aNycGzNCJE 2) https://tr.investing.com/equities/gazprom 3) https://tr.investing.com/commodities/dutch-ttf546gas-c1-futures
References
Akçapa, M. (2020). Rus Dış Politikasında Etkili Bir Aktör: Gazprom. Bursa: Dora Yayınları.
Ambrose, J. (2021). Germany Suspends Approval for Nord Stream 2 Gas Pipeline. The Guardian Web Sitesi: https://www.theguardian.com/business/2021/nov/16/germany-suspends-approval-for-nord-stream-2-gas-pipeline (26.11.2021).
BBCNews Türkçe. (2021). Kuzey Akım 2: Almanya Engeli Sonrası Avrupa’da Doğal Gaz Fiyatları Yüzde 17 Arttı. BBCNews Türkçe Web Sitesi: https://www.bbc.com/turkce/haberler-dunya-59315492 (25.11.2021).
BP. (2021). BP Statistical Review of World Energy 2021. London: BP.
CNNTürk. (2021). Putin Avrupa’nın Gaz Vanasını kıstı... Enerji Krizine Benzin Döktü. CNNTürk Dünya: https://www.cnnturk.com/dunya/putin-avrupanin-gaz-vanasini-kisti-enerji-krizine-benzin-doktu (24.11.2021).
Cohen, A. (2021). Europe’s Self-Inflicted Energy Crisis. Forbes: https://www.forbes.com/sites/arielcohen/2021/10/14/europes-self-inflicted-energy-crisis/?sh=62eee4cb2af3 (24.11.2021).
Dempsey, J. (2021). Judy Asks: Is Europe’s Energy Crisis Self-Inflicted?Carnegie Europe Web Sitesi: https://carnegieeurope.eu/strategiceurope/85668 ((24.11.2021).
Erkan, A. Ç., ve A.Ateş. (2019). “Will Russia Be A Threat To China? Sino-Russian Energy Relations Via Energy Weapon Model”.International Journal Of Eurasia Social Sciences , X(36), 431-445.
Euronews. (2021). Avrupa’da Elektrik ve Doğal Gaz Fiyatları Neden Artıyor? Uzmanlardan Yeni Kriz Uyarısı. Euronews Dünya: https://tr.euronews.com/2021/09/28/avrupa-da-enerji-fiyatlar-neden-art-yor-uzmanlardan-yeni-kriz-uyar-s (24.11.2021).
Eurostat. (2021). Energy Imports Dependency. Eurostat Data Browser: https://ec.europa.eu/eurostat/databrowser/view/NRG_IND_ID__custom_938402/bookmark/table?lang=en,en&bookmarkId=f1ab4519-82df-4a89-a329-1b8d0a5925f7 (12.11.2021).
Gazprom. (2005). History in Brief. Gazprom: https://www.gazprom.com/about/history/chronicle/2005/ (12.11.2021).
Gazprom. (2018). Gazprom Group’s Staff Structure, 2015-2018. Gazprom Report: https://sustainability.gazpromreport.ru/en/2018/3-people-around/annex/ (12.11.2021).
Gazprom (2020). Investors Stock. Gazprom: https://www.gazprom.com/investors/stock/ (12.11.2021).
Gazprom. (2021). About Gazprom. Gazprom: https://www.gazprom.com/about/ (13.11.2021).
Gazprom. (2021). Marketting Europe. Gazprom: https://www.gazprom.com/about/marketing/europe/ (12.11.2021).
Gazprom Export. (2021). Our Activity. Gazprom Export: http://www.gazpromexport.ru/en/about/activity/ (13.11.2021).
Godzimirski, J., and Z.Nowak. (2018). EU Gas Supply Security: The Power of the Importer. ,Energy Security in Europe: Divergent Perceptions and Policy Challenges (s. 221-250). Cham: Palgrave Macmillian.
Gürsoy, S. (2021). Analysis of the energy prices and geopolitical risk relationship. Journal of International Economy, Politics, Humanities, and Social Sciences, 4(2), 69-80.
Hatemi-J, A. (2012). Asymmetric Causality Tests With An Application. Empirical Economics, 43(1), 447–456.
Högselius, P. (2013). Red Gas: Russia And The Origin of European Energy Dependence. Newyork: Palgrave Macmillian.
International Energy Agency. (2021). Covıd-19 Exploring The Impacts Of The Covid-19 Pandemic On Global Energy Markets, Energy Resilience, And Climate Change. IEA World Energy Outlook: https://www.iea.org/topics/covid-19 (4.11.2021).
Lee, J. and M.C.Strazicich. (2003). “Minimum Lagrange Multiplier Unit Root Test with Two Structural Breaks”. Review of Economics and Statistics, 85(4), 1082–1089.
Lee, J. and M.C.Strazicich. (2004). “Minimum LM Unit Root Test with One Structural Break”. Appalachian State University Working Papers, 4(17), 1–15.
Morrow, S. (2021). Gazprom Halts Gas Supply to Hungary via Ukraine. Anadolu Agency Energy: https://www.aa.com.tr/en/energy/natural-gas/gazprom-halts-gas-supply-to-hungary-via-ukraine/33711 (15.11.2021).
Necsutu, M. (2021). Moldova’s New Deal with Gazprom ‘Not Transparent’, Experts Claim. Balkan Insight News: https://balkaninsight.com/2021/11/01/moldovas-new-deal-with-gazprom-not-transparent-experts-claim/ (24.11.2021).
Ng, A. (2021). U.S. Official Says Russia ‘Took Advantage’ of Europe’s Energy Crisis. CNBC: https://www.cnbc.com/2021/11/11/amos-hochstein-russia-took-advantage-of-europes-energy-crisis.html (25.11.2021).
Overland, I. (2017). The Hunter Becomes the Hunted: Gazprom Encountes EU Regulation. S. Andersen, A. Golthaou, and N. Sitter, Energy Union: Europe’s New Liberal Mercantilism (pp. 115-130). London: Palgrave Macmillian .
PJSC Gazprom. (2021). Gazprom Annual Report 2020. St. Petersburg: Gazprom Group.
Popovic, N. (2020). The Energy Relationship Between Russia and the European Union. E-International Relations Info: https://www.e-ir.info/pdf/81925 (13.11.2021).
Rosenberg, S. (2021). Moldova: Russia Threatens Gas Supply in Europe’s Poorest State. BBC News Europe: https://www.bbc.com/news/world-europe-59048894 (24.11.2021).
Sarı, H. (2021). Merkel’in Varisinden Rusya’ya Kuzey Akım 2 ‘Ultimatomu’. Dünya Gazetesi: https://www.dunya.com/dunya/merkelin-varisinden-rusyaya-kuzey-akim-2-ultimatomu-haberi-626164 (22.11.2021).
Stegen, K. S. (2011). Deconstructing The “Energy Weapon”: Russia’s Threat To Europe As Case Study. Energy Policy, XXXIX(10), 6505-6513.
TASS. (2021). Kiev Confirms Terminating Gas Transit to Hungary and Losing Imports From This Country. TASS Russian News Agency Web Sitesi: https://tass.com/economy/1344649 (24.11.2021).
The Moscow Times. (2021). Russia Senses Opportunity in European Gas Price Crisis. The Moscow Times Web: https://www.themoscowtimes.com/2021/09/15/russia-senses-opportunity-in-european-gas-price-crisis-a75054 (25.11.2021).
Tichy, L. (2019). EU-Russia Energy Relations: A Discorsive Approach. Cham: Springer.
Yeni Şafak. (2021). Avrupa’da Enerji Krizi: Fiyatlar Dokuz Ayda Yüzde 250 Arttı. Yeni Şafak Dünya: https://www.yenisafak.com/dunya/avrupada-enerji-krizi-fiyatlar-dokuz-ayda-yuzde-250-artti-3706626 (1.12.2021).