Ekonomika ISSN 1392-1258 eISSN 2424-6166
2023, vol. 102(2), pp. 90–107 DOI: https://doi.org/10.15388/Ekon.2023.102.2.5
Stock Market Response to Monetary Policy: Evidence from Iraq
Islam S.T. Babela*
College of Administration and Economics, University of Zakho, Kurdistan Region, Iraq
Email: Islam.babela@uoz.edu.krd
Shivan A.M. Doski
College of Administration and Economics, University of Duhok, Kurdistan Region, Iraq
Email: Shivan.doski@uod.ac
Abstract. The current study seeks to assess the influence of monetary policy carried out by the Central Bank of Iraq (CBI henceforth) on stock market performance (SMP henceforth) from 2008 to 2021. Three monetary policy variables have been considered: money supply, inflation, and interest rate. Meanwhile, the number of transactions has measured the Iraqi Stock Exchange Market (ISX henceforth) performance. This study has used the Autoregressive Distributed Lag (ARDL henceforth) model by utilising monthly data. The results show that in the long term, the money supply and interest rates both have a negative impact on ISX performance. On the other hand, the findings have reported that inflation significantly and positively affects ISX performance. However, there was no indication of a relationship among the underlying variables in the short term. For investors and the appropriate authorities, these findings may have important implications.
Keywords: Monetary policy; Iraqi Stock Exchange; Stock Market Performance; ARDL model
________
* Correspondent author.
Received: 13/02/2023. Revised: 02/06/2023. Accepted: 01/07/2023
Copyright © 2023 Islam S.T. Babela, Shivan A.M. Doski. Published by Vilnius University Press
This is an Open Access article distributed under the terms of the Creative Commons Attribution License, which permits unrestricted use, distribution, and reproduction in any medium, provided the original author and source are credited.
1. Introduction
Financial markets are considered to be one of the main pillars of the financial system. These markets have an essential role in financing companies, governments, and individuals and provide investment opportunities for investors and institutions alike. The presence of these markets could be a boon to the economy as an established stock market can serve as a substantial component of mobilising small-scale savings, channelling these resources towards productive investments, and maintaining a balance between lending and borrowing preferences (Omar et al., 2022). They also encourage the redistribution of cash among firms, enable the circulation of financial resources among various economic units, and supply liquidity for domestic growth and credit expansion (Asiedu et al., 2021). On the contrary, the occurrence of any volatility within the stock market’s system can also pose risks to the economy. This belief originates from the widely held view that the collapse of this market is one of the defining characteristics of an entire economic and financial crisis, see, for instance, (Belke & Beckmann, 2015), and this is why the stock market has become the focus of attention of academics, researchers, and concerned authorities. However, the stock market could be viewed as a complex, ever-evolving framework constantly subjected to unexpected and expected events, such as economic, political, and social factors that could lead to frequent, volatile, and dynamic market responses (Tang et al., 2019).
On the other hand, monetary policy is a crucial instrument used by central banks to attain economic stability and stimulate economic growth by reducing the volatility of macroeconomic variables. It plays a vital role in determining a country’s overall economic conditions. The extensive implications of this policy on the macroeconomic condition of the national economy have been widely acknowledged. Moreover, if this policy has a real influence on the economy, then changes in monetary circumstances should impact stock values and SMP (Suhaibu et al., 2017). However, depending on economic and financial circumstances, the impact of monetary policy on the SMP can differ from one country to another. The magnitude of this influence may vary depending on factors, including the degree of financial market development and financial system integration in the nation.
The link between SMP and monetary policy is significantly more complicated than what would be explained by standard theory. Because of this, a more thorough investigation of the impulse channel linking these two is required. Most studies, however, reveal that central banks’ announcements and monetary policy have the most notable impacts on the financial markets (Bennani, 2019). Given the critical role of monetary policy in shaping country’s overall economic conditions, it is crucial to look at how monetary policy affects SMP and examine the connection between the two, especially in developing nations like Iraq.
The study has concentrated on Iraq due to a few reasons. First, the ISX was established in 2004, which indicates that this market is a relatively young stock market compared to its peers worldwide. Second, the Iraqi economy is susceptible to oil price changes due to its primary reliance on oil exports. Third, there have been significant changes to Iraq’s monetary policy framework during the past 20 years, beginning with the adoption of inflation targeting and the introduction of a new currency. Hence, examining the reaction of the ISX performance may offer insightful information into how a young stock market responds to shifts in monetary policy. Based on that, the main purpose of this study is to investigate the short- and long-term effects of the CBI’s monetary policy tools on the performance of the ISX from 2008 to 2021. Therefore, it is hypothesised that monetary policy tools have a significant effect on the SMP.
Our study may contribute to the literature in two aspects. It firstly presents more evidence regarding the connection between monetary policy and SMP in a country like Iraq. Second, for interested parties, the paper’s findings may help clarify the efficacy of monetary policy tools used by the CBI and their effect on the ISX performance.
The next section briefly reviews the CBI’s instruments and Iraq’s monetary policy framework. The third one begins with a review of the literature and major theories that characterise the SMP. In addition, the primary channels through which monetary policy could affect the stock market are discussed in this section. The fourth section explains in detail the methodological aspect of the study. The fifth one is devoted to data analysis and reporting empirical results, while the discussion section follows immediately afterwards. The conclusion portion of this paper is presented in the final section.
2. Monetary Policy in Iraq
There have been major modifications to monetary policy in Iraq between the time after 2003 and the time before. The CBI used new instruments after 2003 compared to its prior practices. This difference can be linked to several factors (Kadhim & Al-Atabi, 2020). First, the CBI has become autonomous due to the new Law No. 56 of 2004. Second, Iraq gained access to foreign exchange resources drawn principally from oil export. This income was interrupted from 1991 to 2003 due to the blockade’s prevailing conditions. Third, the issuance of a new Iraqi dinar currency which is currently used throughout the country.
These changes significantly impacted the CBI’s new strategy in the years that followed 2003. These measures encompass a range of monetary and economic actions designed to create an environment where supply and demand govern the economy. Through these initiatives, the CBI seeks to promote a stable economic environment favourable to the development of all sectors (Bergsten, 2017).
Based on the above-mentioned context, the following section addresses the instruments used by the CBI to accomplish its objectives, as outlined below (Al-Shaibani, 2018), (Zayer, 2019), and (CBI, 2021):
2.1. Conventional tools
These instruments include reserve requirements, policy rates, and open market operations. It is important to mention that the policy rate serves as an alternative to the discount rate tool, and this is primarily due to the absence of a developed stock market in the country.
2.2. New monetary policy tools
In light of the Iraqi economy features, the CBI has attempted to employ new monetary policy tools suited to its economy’s requirements and in line with its overarching objectives. These instruments encompass the following:
2.2.1 New legislations of monetary policy: Under this strategy, the central bank’s supervisory instruments were modified to comply with the requirements of Banking Law No. (94) of 2004. These instruments, which formerly served to restrict the operations of banks, are now responsible for monitoring the activities of banks and fostering an environment conducive to the functions of the financial sector.
2.2.2 Standing facilities: the standing facilities are viewed as a method for controlling liquidity under the updated monetary policy, which intends to enhance liquidity management for banks and foster wider interbank transactions beyond the conventional reliance on dealings only with the CBI.
2.2.3 Foreign Currency Selling Window: On October 4, 2003, the CBI officially became the primary marketplace for foreign exchange. The CBI used daily auctions to buy and sell foreign currencies, mainly the U.S. dollar, in an effort to control the country’s money supply and liquidity. This action aimed to reduce inflationary pressures and promote price stability.
However, monetary policy objectives in many developing countries are limited to specific characteristics with a primary focus on achieving three main objectives: inflation control, exchange rate stability, and economic growth (IMF, 2015). In contrast, monetary policy in developed countries employs a unique set of instruments that are distinct from those used in developing nations, making their application in the latter extremely difficult. These instruments include zero interest rates, forward guidance, and quantitative easing (Ghadeer & Khudhair, 2022). Therefore, it can be said that the monetary policy in a developing country will need to be very different from that in a developed economy, primarily because the two types of economies have different economic conditions and requirements.
3. Literature Review
Both the Efficient Market Hypothesis (EHM) and Arbitrage Pricing Theory (APT) are considered to be well-known theories that are frequently employed to explain SMP (Norhafiza et al., 2014). The assumption behind the EMH, according to (Fama, 1991), is that asset prices should promptly reflect all available and pertinent information. The stocks in an efficient market are fairly priced. This is due to the fact that once the information is in hand, the responses are quickly made by market participants. Hence, no great return is generated even though the investment strategy is so active. On the other hand, APT shows that the price of an asset can be determined by considering relevant risks. This theory explains that investors are expected to accept a range of rates of return on various types of assets due to the diverse levels of risk involved with different investments. In the case of APT, the opportunity arises when the risk is priced differently across the securities, and arbitrageurs will use this opportunity until the market reaches equilibrium status (Norhafiza et al., 2014). Investors, however, believe that stock market fluctuations are influenced mainly by macroeconomic variables and monetary policy. This suggests that investors’ decisions can be affected by macroeconomic factors, and the decision status on investment will have a noticeable influence on the SMP (Emamian & Mazlan, 2021).
The relationship between monetary policy actions and SMP is quite complex (Chatziantoniou et al., 2013). The stock market is thought to be an alternate channel for monetary policy to transmit its action mechanism because of its multifaceted role in affecting various industries of an economy (Suhaibu et al., 2017). The stock market reacts strongly to shifts in monetary policy through several different routes, and policymakers can use these shifts as a leading signal of economic growth when making decisions. Therefore, the SMP is not only a reaction to and an influence on the economy but also a source of information for concerned authorities about private sector opinions on the future path of key macroeconomic indicators (Chatziantoniou et al., 2013). The broad consensus is that stock prices drop when monetary policy becomes more restrictive and that stock prices rise when monetary policy becomes more expansionary. Some academics also argue that changes in monetary policy affect market-determined interest rate estimates, the cost of capital, and projections of corporate profits (Rifat, 2015). In general, there is a number of transmission channels by which monetary policy may affect stock market behaviour (King & Watson, 1996), (Mishkin, 2001), (Iacoviello, 2005), (Osuagwu, 2009) and (Sousa, 2010) which are explained below.
The interest rate is regarded as one of the most influential central banks instruments through which monetary policy can communicate with economic activities and affect the SMP. It also represents the traditional Keynesian theory of how interest rates are transmitted. This channel predicts that a change in interest rates will impact enterprises’ cost of capital, which will impact the present value of their anticipated net cash flows. As a result, as interest rates rise, the value of anticipated future net cash flows decreases, resulting in a decline in stock values.
Due to the obvious role of monetary policy and its impact on the external finance premium, the concept of credit channel has been brought to light. This tool is another indirect transmission channel for monetary policy connected to interest rate changes. Changing interest rates is a tool by which the central bank may affect investment activities. Simultaneously, it is believed that the market value of companies will fluctuate based on their investment levels. This argument is based on the idea that the present value of a business’s future cash flows influences its value in the market. Accordingly, more corporate investment activities should, in theory, result in larger projected cash flows, raising the firm’s market value.
The “wealth effect” is another channel through which monetary policy may influence SMP. This transmission mechanism is premised on the notion that interest rates ultimately determine the value of stock prices so that when interest rates rise, the value of long-lived assets, namely stock prices, falls.
The exchange rate is regarded as an additional transmission mechanism by which monetary policy may impact stock prices. This channel suggests that in the case of having high-interest rates, the domestic currency will appreciate, which in turn increases imports and decreases exports. A situation like this will harm the country’s ability to compete, leading to a drop-in production and, in the long run, lower asset prices.
Last but not least, Tobin’s Q theory of investment is one of the approaches that explain the nature of the link that causes monetary policy to influence SMP. In the simplified market where just stocks and bonds exist, this theory predicts that investors will shift their money from stocks to bonds when interest rates rise. This will have the effect of bringing down the price of stocks.
On the other hand, a series of studies has indicated that inflation is a key element in the connection between the stock market and monetary policy. In this context, Fama & Schwert (1977) state that inflation has a significant effect on the stock market in addition to being a monetary phenomenon that reflects changes in the money supply per unit of output. The financial market literature illustrates that an inflationary period typically has detrimental effects on the SMP and lowers the value of stocks. As a result, there is an inverse link between inflation and stock values, as claimed by (Fama, 1981).
Despite the previous discussion, (Mishkin, 2007) outlines two fundamental conditions that must be met before monetary policy can affect SMP. First, in the case of reducing interest rates by the central bank, the investors will be more open to accepting a lower rate of return on their investments in equities as the overall return will decrease. Such a situation will cause a decline in the Gordon growth model’s denominator, which will result in an increase in stock prices. Second, lowering interest rates is anticipated to boost the economy, causing an increase in the dividend growth rate. The increase in this element leads the denominator in the Gordon growth model to reduce, bringing about a rise in stock prices.
From the above discussion, it can be seen that the impact of monetary policy on SMP is a complicated issue that has been well-researched by academics. Economic theory, as proposed by (Bjørnland & Leitemo, 2009), provides several reasons for the relationship between monetary policy and asset prices, especially stock prices. Despite the common features of the monetary policy instruments employed by central banks, empirical research has shown that monetary policy does not necessarily affect SMP. Most research examining this topic is restricted to specific regions; thus, they may not provide a comprehensive picture of how monetary policy affects the stock market. In light of this, we tend to fill this gap and offer more insights about this area in Iraq to identify whether this country is in the same line with the economic theory.
4. Methodology
This research is primarily a quantitative-based approach in nature. This approach has been employed to meet the study’s objectives and answer the research question, which suggests that the research is based on numerical data and statistical analysis.
4.1. Data and variables selection
The dynamic impact of monetary policy on the ISX is investigated in this study using time series data. The analysis specifically uses monthly data from January 2008 to December 2021 since this time frame corresponds to the window of time when data from ISX is accessible. The data was gathered from the official annual reports of the ISX (ISX, 2023) and the CBI (CBI, 2022).
In terms of the variables, most studies on this topic typically used the market index as a proxy of SMP. However, in this study, the number of transactions has been used to measure the SMP by following the work of (Oshadare et al., 2022). The number of transactions is a reliable predictor of SMP since it gauges market activity and liquidity. In other words, as it represents the volume of securities that investors buy and sell, this indicator is a crucial metric for assessing the health and performance of the market (Nia & Gharneh, 2021).
On the other hand, this study considers money supply, interest rate, and inflation rate as independent variables. For money supply, the study has focused on the broad definition of the money supply, which is defined as the sum of all forms of currency in circulation, including savings and term deposits (both fixed and time) held by commercial banks. Due to the underdeveloped financial system in Iraq, the CBI and its monetary policy are limited in the tools they can use to influence economic activity, including the ISX. Therefore, the money supply is an important variable to be included in this study because it will demonstrate the monetary policy’s ability to capture the stock market’s transmission mechanism. The data for the money supply is measured in billions of Iraqi Dinars.
Inflation has been represented by the inflation rate. Inflation has always been a real issue in Iraq, and one of the CBI’s primary objectives is to maintain price stability. It is well-known that inflation affects consumers’ purchasing power, which may significantly impact the stock market. As such, it is a crucial variable to consider when analysing the stock market’s response to changes in monetary policy. The variable was selected due to its comprehensive base measure for estimating average changes in commodity and service prices.
However, the average rate on 365, 182, and 91-day treasury bills has been assigned as a measurement of interest rate in this study. Since 2004, the CBI has employed an indirect monetary policy instrument aimed at stimulating the financial sector in the absence of a developed real sector. Moreover, this variable represents an alternative to stock investment. Due to a lack of knowledge or to avoid the risks of investing in stocks, many investors tend to invest in these treasury bills. It is, therefore, essential to study this tool’s effectiveness in influencing ISX performance.
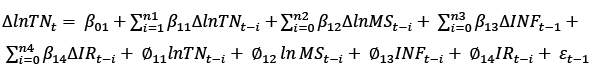
4.2. Model Specification
The model of the study is specified below:
 (1)
(1)
where
TN= Total number of market transactions
MS= Money supply
INF= Inflation rate
IR= Treasury bills rate
To represent TN as a function of all the variables, equation (l) has been expanded as shown below:
 (2)
(2)
where the variables TN, MS, INF, and IR have just been explained earlier, β0 is the drift component, the terms β1…β3 are the coefficients of the model, and μ represents the error term.
In the economics and finance literature, several methods have been proposed for estimating the co-integration between macroeconomic variables and SMP, including those proposed by Engle and Granger, and Johansen and Juselius. The main issue with these techniques is that the time series data has to meet the requirements for these methods since it is not always possible to ensure that all variables in the equation have an equal order of integration (Lawal et al., 2018). To address this issue, a model has been developed by (Pesaran et al., 2001) as an alternate co-integration technique known as ARDL bound approach.
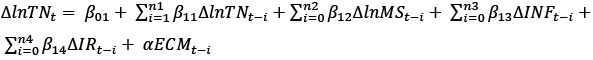
In empirical research, the ARDL model has several advantages over other co-integration techniques. Unlike other estimation techniques, which necessitate a sizable data set for validity, this model is acceptable when dealing with a small sample size. Different optimal lags for the variables are possible in this model, but this is not the case with conventional methods of co-integration (Lawal et al., 2018). Furthermore, this model can be used when the variables are integrated at I(0), I(1), or a mixture of integrated. It can also estimate both short-run and long-run parameters at the same time (Jeris & Nath, 2020). The following ARDL model has been adopted to represent the impacts of the short run and long run:
 (3)
(3)
where Δ expresses the first difference operator, ln is the natural logarithm of the variables, β01 denotes the constant term, β11…β14 denote the short-run coefficients, ∅11…. ∅14 indicate the long-run coefficients, n1…n4 express the lag length, and εt-1 denote the white noise error term.
Having the co-integration or long-run relationship between explanatory variables and response variable depends on F-statistics. As stated by Pesaran et al. (2001), the choice of whether to accept or reject the null hypothesis is as follows.
The null hypothesis tends to be rejected if F-statistics is higher than the upper bound, which, in turn, implies that the variables are co-integrated. Conversely, it is concluded that the variables are not co-integrated, and the null hypothesis is accepted if F-statistics is less than the lower bound. However, the decision is inconclusive if the value of F-statistics locates between the lower bound and upper bound.
On the other hand, the following equation describes the ARDL model’s error correction model (ECM):
 (4)
(4)
The ECM illustrates how the speed of adjustment returns to the long-term equilibrium following a short-term shock. The coefficient is statistically significant, confirming that the independent and dependent variables are co-integrated. Emamian & Mazlan (2021) state that if the ECT coefficient has a negative sign, it indicates convergence toward equilibrium, while in the case of having a positive sign, the result implies that the variable is deviating from equilibrium. They also suggest that the coefficient ranges from 0 to 1, where 1 means full adjustment and 0 means no adjustment. However, if the coefficient is more than 1, the adjustment is smaller than the period.
5. Empirical Results
5.1. Unit root test
It is believed that most economic variables do not tend to turn back to a fixed mean, showing either a significant increase or a negative trend over time. Consequently, they do not form a stationary series. A nonstationary time series is one that contains a unit root. This is why, in econometrics, a time series’s stationarity is checked using a unit root test (Shrestha & Bhatta, 2018). The unit root test is carried out so as to establish beyond a reasonable doubt that the variables are not stationary at I(2) (Javangwe & Takawira, 2022). The most popular technique that is widely used in the literature for unit root tests is the Augmented Dickey–Fuller (ADF) (Shrestha & Bhatta, 2018). The table below outlines the outcomes of the ADF test.
Table 1. ADF Unit Root Test
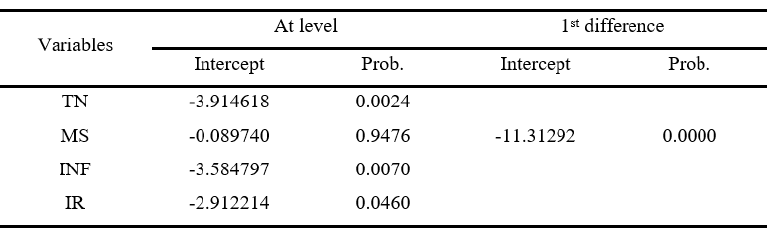
The results of the above table show that all the variables are significant at level except MS, which is significant at first difference.
5.2. Lag length selection
After identifying the order of data integration, the lag length is decided in the next step, which will be used in this study.
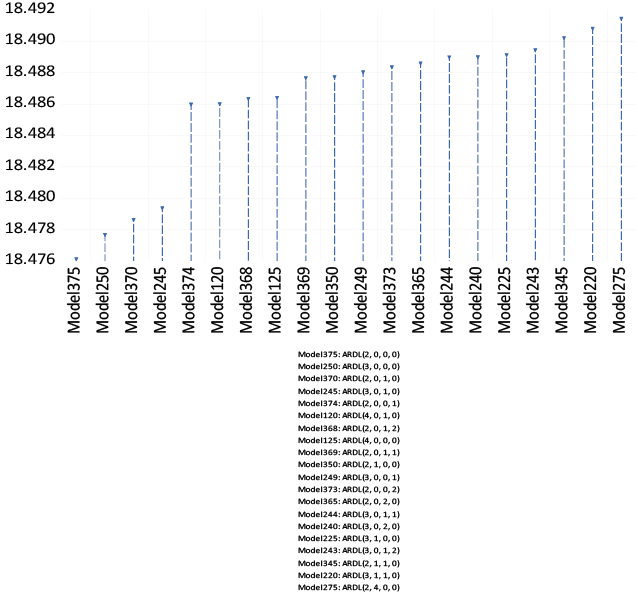
Figure 1. Lag length selection criteria
Figure (1) shows that 20 models have been estimated based on Akaike Information Criteria. According to the outcomes, the ideal model to be utilised in measuring the long-run model is ARDL (2, 0, 0, 0).
5.3. ARDL co-integration
5.3.1. Bound test
As part of the ARDL method of integration, lagged variables in the error correction regression are tested to determine the nature of the long-run relationship. The significance of all lagged variables is then tested using the F-statistic, and the resulting equation is the error correction method.
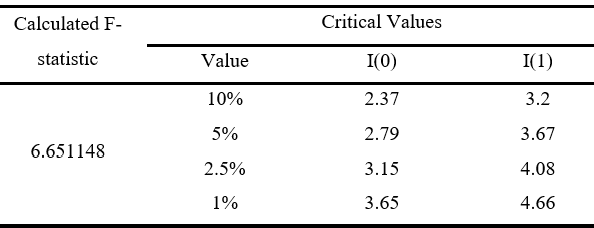
Table 2 shows that, at the level of 1% significance, the F-statistics value exceeds the critical value. These results imply a co-integrated link between the underlying variables. In other words, independent and dependent variables have a long-term equilibrium relationship.
Table 2. Co-integration Bound Test Analysis
5.3.2. The long-run estimation model
After confirming the existence of long run relationship based on F-statistics, long-run ARDL is estimated, which is displayed in the table below.
Table 3. Long-run Estimation
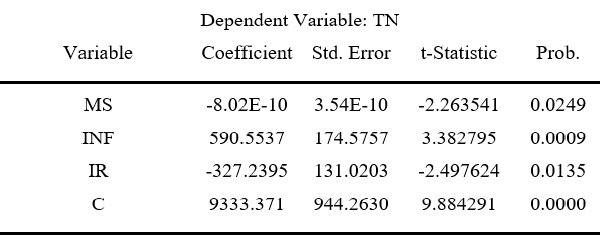
Table (3) highlights the long-run analysis of the ARDL model. The outcomes show a negative correlation between MS and TN, suggesting that higher MS values lead to lower TN values. This, in turn, means that the coefficient is statistically significant at the 5% level. Since INF has a positive coefficient, we can infer that TN also grows with INF. However, the results reveal that IR has a negative coefficient, indicating that as IR rises, TN falls. Finally, constant term C has a positive coefficient (9333.371). When there are no outside influences, this is what TN is equal to. For this coefficient, the t-statistic is 9.884291, and the corresponding p-value is 0.0000, implying that the coefficient is significantly different from zero at the 1% level of significance. In summary, the results of this long-term regression analysis reveal that MS, INF, and IR are all statistically significant predictors of TN, as well as they illustrate the statistical significance of the constant term C.
After the existence of the co-integration relationship has been confirmed, the study investigates the rate of adjustment to both (long-term equilibrium and short-run relationship), which is displayed in table (4).
Table 4. ARDL error correction model
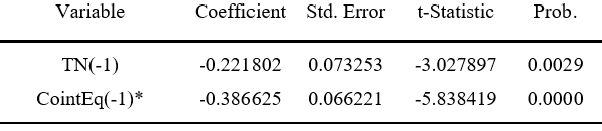
Following the results of the ARDL estimation analysis and the error correction model (short-run analysis) in table (4), it can be observed that the ECT is negative and significant at the level of 1%, which confirms the results of co-integration. The negative sign of the ECT coefficient explains that there will be a return toward long-run equilibrium. Based on our findings, in the case of disequilibrium, the coefficient -0.38 illustrates that approximately 39% of the deviation is corrected within one month. In other words, the system will pull itself back to long-run equilibrium at a speed of 39% if there was a moving out of equilibrium in the previous month.
5.4. Diagnostic tests
The following diagnostic tests have been performed to confirm the model’s goodness of fit as suggested by (Pesaran & Pesaran, 2010). The diagnostic tests reveal that the ARDL (2, 0, 0, 0) model possesses the necessary econometric characteristics.
5.4.1. Normality test
Jarque–Bera test is regarded as one of the most prevalent normality test procedures. This method rejects the null hypothesis and accepts the alternative if the probability value is less than 5%, indicating that the residuals are not normally distributed. However, if the probability value is greater than 5%, we incline to accept the null hypothesis, which shows that the residuals have a normal distribution. In our instance, the null hypothesis is accepted, and the residuals are normally distributed because the p-value (0.169) exceeds the 5% significance level.
Table 5. Normality Test

5.4.2. Serial correlation test
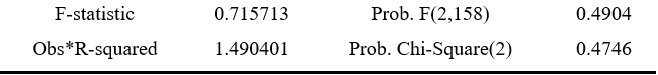
Based on the results below, table (6) clearly shows that the p-value (0.4904) is insignificant at the 5% level. Therefore, the null hypothesis cannot be rejected, implying that the residuals are not serially correlated.
Table 6. Breusch-Godfrey Outcomes
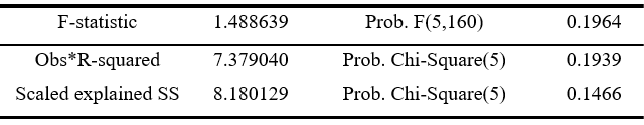
5.4.3. Heteroscedasticity test
The table below provides the Breusch–Pagan–Godfrey technique for the heteroscedasticity test. Based on the outcomes of the test, it can be seen that the p-value is greater than the level of significance of 5%, which indicates that the residuals are homoscedastic.
Table 7. Breusch-Pagan-Godfrey
5.4.4. Stability test
Verifying the stability of the long- and short-run bounds of the selected error correction model is a crucial step in using the ARDL model. The following illustrations show how the cumulative sum CUSUM and the cumulative sum of squares CUSUMsq have been used for this purpose, as recommended by (Pesaran & Shin, 1999):
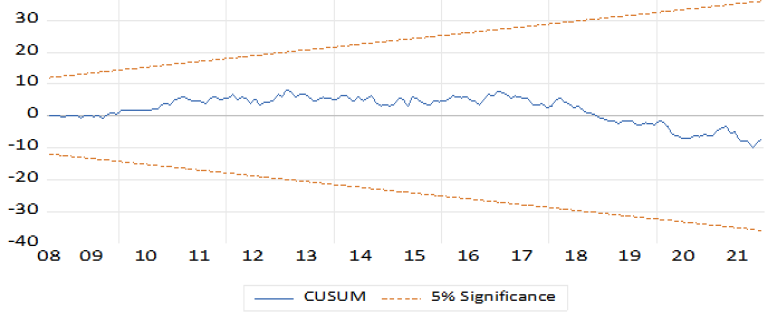
Figure 2. CUSUM Test
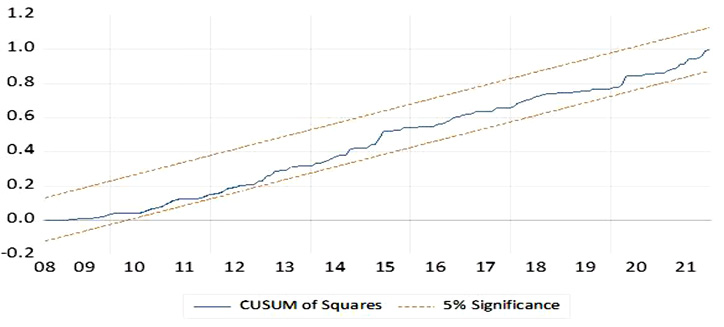
Figure 3. CUSUMsq Test
Figures (2) and (3), respectively, present the outcome of CUSUM and CUSUMsq. These figures clearly show that the plots are located between critical bounds of significance at the 5% level. Indicating the stability of the model as long as the null hypothesis has been accepted, which, in turn, means that all parameters are stable.
6. Discussion of Results
Table (3) demonstrates that the three independent variables taken in this study significantly affect the performance of the ISX over the long term. The findings indicate that MS has a statistically significant adverse effect on ISX performance at the 5% level. They are implying that a rise in the MS in the broad sense results in a drop in the volume of ISX transactions. The fact that the MS affects SMP demonstrates the need to be included in the model. The findings conflict with (John, 2019), who found that the MS had a significant positive impact on SMP, but they are in line with (Emamian & Mazlan, 2021) and (Lawal et al., 2018). From the analysis results, several possible causes can be identified for this negative relationship. First, this adverse relationship suggests that shocks in the MS will have a negative impact on interest rates, which will then have a negative impact on the SMP, as believed by (Chatziantoniou et al., 2013). MS and the stock market are therefore seen to have a negative relationship. Second, the most logical cause is that increases in MS in Iraq have not been directed to the ISX as the vast majority of the active companies working in Iraq are not listed in the ISX. According to the last statistics published by the Ministry of Trade in Iraq, there are 74284 companies which have been registered in Iraq. Out of this number, only 103 companies have been listed on the ISX based on the official report of the ISX website. Consequently, the demand for stock decreases, leading to a decline in its price and market value. This action could have a negative reflection on the performance of the ISX. Taken together, this negative correlation between MS and SMP remains the door to controversy open for more investigation about these two variables.
The IR also shows a similar pattern. The results indicate that at the level of 5%, this variable has a negative and statistically significant impact on the performance of the ISX. According to the long-term estimate, a rise of just one percentage point in IR would reduce the TN by 327 per cent. The findings are consistent with (Kamal et al., 2018) and (Shahzad et al., 2021), who reached the same empirical outcomes in the case of Egypt and the USA, respectively. On the one hand, these findings support the idea that investors in Iraq would like to invest their money into risk-free investments during periods of high-interest rates. In such cases, they believe that investing in shares will not offer a rate of return that could compensate them for leaving a risk-free investment like treasury bills. However, the low IR will make bonds less attractive, which could lead investors to adjust their portfolio by selling bonds and buying shares, thereby driving up stock prices and increasing the number of executed transactions in the ISX.
INF findings contradict the MS and IR by demonstrating a long-term positive and statistically significant correlation between this variable and ISX performance. This result suggests that a one per cent increase in INF would result in a 590 per cent increase in TN. The results are compatible with the hypothesis of Fisher (Tomar & Kesharwani, 2022), while they contradict the findings of Fama (1981). The results in Iraq may have the following explanations. First, increasing INF rates may lead to a rise in the total returns of firms as the costs will not increase by the same amount for a period of time. Specifically, the wages of employees remain at the same level when they have long-term contracts with these companies. Accordingly, the stock price goes up due to the increase in demand, which will positively reflect on the SMP. Second, demand-pull inflation drives output prices to rise more quickly than input prices, causing businesses to obtain high returns and increase their net income. This will have a favourable impact on SMP and stock price growth. Third, a higher stock price could result from an increase in the general price level, which encourages investors to utilise stocks as a long-term hedge against the risk of INF, while it may not be an effective tool in the short run. As a result, it is determined that there is a positive correlation between INF and SMP.
However, based on the findings in table (4), there is no statistically significant association between the underlying factors in the short run. This indicates that shifts in MS, INF, or IR are unlikely to have an immediate effect on ISX performance. These findings, in the short run, may raise two interpretations. First, beyond monetary policy, a wide range of other factors also affect stock market dynamics. The intricate network of factors influencing ISX movements includes economic and political conditions, investor attitudes, and company-specific factors. As a result, it can be difficult to isolate and quantify the direct effects of monetary policy on SMP. Second, the CBI’s use of these monetary policy tools to affect the volume of transactions on the ISX could be ineffective in the short term, which can also be linked to political instability and the absence of an effective government in Iraq.
7. Conclusions
The stock market is believed to play a significant role in the process of economic growth. This role varies from one economy to another based on the efficiency of this market. At the same time, monetary policy is considered one of the most critical policies in any country. Using this policy’s tools could considerably impact the stock market. Consequently, the paper evaluates the impact of the CBI’s monetary policy on the SMP. In an effort to identify the long-run and short-run effects of money supply, inflation, and interest rate on the performance of the ISX. Due to the nature of the study, monthly time series data from 2008 to 2021 have been analysed using ARDL estimation.
Empirical findings indicate that CBI’s monetary instruments significantly affect ISX performance over the long term. In particular, the study shows that money supply has a considerable and negative effect on ISX performance. These results suggest that as the money supply rises, fewer transactions are conducted in ISX. Similarly, the outcomes of the ARDL model have shown that the performance of the ISX responds negatively and significantly to the interest rate. Indicating that investors in Iraq prefer risk-free investments when they obtain this opportunity. On the contrary, we found that the inflation rate affects SMP positively and significantly, which means that there is a direct correlation between inflation and the number of transactions in the ISX. This would imply that investors consider the stock the best option to invest in when the inflation rate increases. However, the study outcomes confirm no short-term correlation between monetary policy tools and the performance of the ISX.
The outcomes may have significant implications for investors and concerned authorities, such as the CBI and the Iraqi Securities Commission. Based on the prior signs and outcomes and the statistical significance of the explanatory variables, the results show that these variables are significant for estimating the SMP in Iraq over the long term.
For investors, they can be more aware of and knowledgeable about the nature of the relationship between ISX performance and monetary policy tools. They may take advantage of these findings for their investment decisions and portfolio management. For the concerned authorities, keeping the interest rate at a low level is vital as it will contribute positively to the performance of the ISX. The CBI should reconsider the money supply as an effective monetary policy tool and make sure that this tool is directed sufficiently to the ISX. Further, the authorities should keep up a balance between the inflation rate, the ISX performance, and investors’ interest.
Finally, it is of great importance that future studies could concentrate on both fiscal and monetary policies to identify their impact on the ISX. Additionally, the study might be expanded to include one or more additional countries so that their similarities and differences can be examined.
References
Al-Shaibani, F. K. K. (2018). Monetary policy and its impact on inflation in Iraq after 2003. Journal of Madenat Al-elem University College, 10(2), 165-182.
Asiedu, E. L., Mireku - Gyimah, D., Kamasa, K., & Otoo, H. (2021). Interest rate, inflation and stock market performance in ghana: A sector based vector error correction model perspective. African Journal of Business and Economic Research, 16(1). https://doi.org/10.31920/1750-4562/2021/v16n1a8
Belke, A., & Beckmann, J. (2015). Monetary policy and stock prices - Cross-country evidence from co-integrated VAR models. Journal of Banking and Finance, 54. https://doi.org/10.1016/j.jbankfin.2014.12.004
Bennani, H. (2019). Does People’s Bank of China communication matter? Evidence from stock market reaction. In Emerging Markets Review, 40. https://doi.org/10.1016/j.ememar.2019.05.002
Bergsten, C. F. 2017. Dilemmas of the Dollar: Economics and Politics of United States International Monetary Policy: Economics and Politics of United States International Monetary Policy. Routledge
Bjørnland, H. C., & Leitemo, K. (2009). Identifying the interdependence between U.S. monetary policy and the stock market. Journal of Monetary Economics, 56(2). https://doi.org/10.1016/j.jmoneco.2008.12.001
CBI. (2021). Annual Economic Report 2021. Statistics and Research Directorate. Retrieved May 2023 from https://cbi.iq/static/uploads/up/file-168380453340123.pdf
CBI. (2022). Annual Statistical Bulletin. Statistics and Research Directorate. Retrieved October 2022 from https://cbi.iq/news/view/492
Chatziantoniou, I., Duffy, D., & Filis, G. (2013). Stock market response to monetary and fiscal policy shocks: Multi-country evidence. Economic Modelling, 30(1). https://doi.org/10.1016/j.econmod.2012.10.005
Emamian, A., & Mazlan, N. S. (2021). Monetary-Fiscal policies and stock market performance: Evidence from linear ARDL framework. GATR Journal of Business and Economics Review, 5(4). https://doi.org/10.35609/jber.2021.5.4(7)
Fama, E. F. (1981). Stock Returns, Real Activity, Inflation, and Money. American Economic Association Stock Returns The American Economic Review, 71(4).
Fama, E. F. (1991). Efficient Capital Markets: II. The Journal of Finance, 46(5). https://doi.org/10.2307/2328565
Fama, E. F., & Schwert, G. W. (1977). Asset returns and inflation. Journal of Financial Economics, 5(2). https://doi.org/10.1016/0304-405X(77)90014-9
Ghadeer, Y. H. & Khudhair, L. B. (2022). The Role of Monetary Policy Tools on Stability of Iraqi Economy: A Macroeconomic Analysis (2004-2018). Webology, 19(1), 2341-2356.
Iacoviello, M. (2005). House prices, borrowing constraints, and monetary policy in the business cycle. In American Economic Review, 95(3). https://doi.org/10.1257/0002828054201477
IMF. (2015). Evolving Monetary Policy Frameworks in Low-Income and Other Developing Countries. IMF Staff Report. Retrieved May 2023 from https://www.imf.org/external/np/pp/eng/2015/102315.pdf
ISX. (2023). Market Reports. Retrieved September 2022 from http://www.isx-iq.net/isxportal/portal/uploadedFilesList.html
Javangwe, K. Z., & Takawira, O. (2022). Exchange rate movement and stock market performance: An application of the ARDL model. Cogent Economics & Finance, 10(1), 1–20.
Jeris, S. S., & Nath, R. D. (2020). Covid-19, oil price and U.K. economic policy uncertainty: evidence from the ARDL approach. Quantitative Finance and Economics, 4(3), 503–514.
John, E. I. (2019). Effect of Macroeconomic Variables on Stock Market Performance in Nigeria. Journal of Economics, Management and Trade. https://doi.org/10.9734/jemt/2019/v22i630110
Kadhim, S. N., & Al-Atabi, H. A. J. (2020). The Effectiveness of Quantitative Instruments in Controlling Money Supply: An Applied Research in the Central Bank of Iraq. Journal of Accounting and Financial Studies, 15(50), 118-135.
Kamal, A., Lotfy, A., & Kamal, M. (2018). The impact of Treasury bill rate and interest rate on the stock market returns in Egypt. In International Journal of Development and Sustainability, 7(2).
King, R. G., & Watson, M. W. (1996). Money, prices, interest rates and the business cycle. Review of Economics and Statistics, 78(1). https://doi.org/10.2307/2109846
Lawal, A. I., Somoye, R. O., Babajide, A. A., & Nwanji, T. I. (2018). The effect of fiscal and monetary policies interaction on stock market performance: Evidence from Nigeria. Future Business Journal, 4(1), 16–33. https://doi.org/10.1016/j.fbj.2017.11.004
Mishkin, F. S. (2001). The Transmission Mechanism and the Role of Asset Prices in Monetary Policy (No. 8617).
Mishkin, F. S. (2007). The Economics of Money, Banking, and Financial Markets. Pearson Education.
Nia, F. H., & Gharneh, N. S. (2021). MACROECONOMIC VARIABLES AND VOLUME OF TRANSACTIONS ON TEHRAN STOCK EXCHANGE. Revista De Investigaciones Universidad Del Quindio, 33(2), 163–173. https://doi.org/10.33975/riuq.vol33n2.472
Norhafiza, N., Sabariah, N., & Rusmawati, I. (2014). The Impact of Commodity Prices, Interest Rate and Exchange Rate on Stock Market Performance: An Empirical Analysis From Malaysia. Malaysian Management Journal, 18.
Omar, A. B., Ali, A., Mouneer, S., Kouser, R., & Al-Faryan, M. a. S. (2022). Is stock market development sensitive to macroeconomic indicators? A fresh evidence using ARDL bounds testing approach. PLOS ONE, 17(10), e0275708. https://doi.org/10.1371/journal.pone.0275708
Oshadare, S. A., Idolor, J. E., & Adelowotan, M. O. (2022). Market Frictions and Stock Market Performance in Nigeria. Business Administration and Business Economics, 18(2), 7–23.
Osuagwu, E. (2009). THE EFFECT OF MONETARY POLICY ON STOCK MARKET PERFORMANCE IN NIGERIA. Nigerian Journal of Securities and Finance, 14(2).
Pesaran, B., & Pesaran, M. H. (2010). Time Series Econometrics using Microfit 5.0: A User’s Manual (first). Oxford University Press.
Pesaran, M. H., Shin, Y. (1999). An autoregressive distributed lag modelling approach to co-integration analysis. Econometrics and Economic Theory in the 20th Century: The Ragnar Frisch Centennial Symposium., March 3-5, 1995.
Pesaran, M. H., Shin, Y., & Smith, R. J. (2001). Bounds testing approaches to the analysis of level relationships. Journal of Applied Econometrics, 16(3). https://doi.org/10.1002/jae.616
Rifat, A. (2015). Impact of Monetary Policy on Stock Price: Evidence from Bangladesh. Journal of Investment and Management, 4(5). https://doi.org/10.11648/j.jim.20150405.29
Shahzad, S. J. H., Hurley, D., & Ferrer, R. (2021). U.S. stock prices and macroeconomic fundamentals: Fresh evidence using the quantile ARDL approach. International Journal of Finance and Economics, 26(3). https://doi.org/10.1002/ijfe.1976
Shrestha, M. B., & Bhatta, G. R. (2018). Selecting appropriate methodological framework for time series data analysis. Journal of Finance and Data Science, 4(2). https://doi.org/10.1016/j.jfds.2017.11.001
Sousa, R. M. (2010). Housing wealth, financial wealth, money demand and policy rule: Evidence from the euro area. North American Journal of Economics and Finance, 21(1). https://doi.org/10.1016/j.najef.2009.11.006
Suhaibu, I., Harvey, S. K., & Amidu, M. (2017). The impact of monetary policy on stock market performance: Evidence from twelve (12) African countries. Research in International Business and Finance, 42. https://doi.org/10.1016/j.ribaf.2017.07.075
Tang, J., Heinimann, H., & Khoja, L. (2019). Quantitative evaluation of consecutive resilience cycles in stock market performance: A systems-oriented approach. Physica A: Statistical Mechanics and Its Applications, 532. https://doi.org/10.1016/j.physa.2019.121794
Tomar, K. S., & Kesharwani, S. (2022). Asymmetric effect of monetary policy on Indian stock market sectors: Do monetary policy stimulus transpire the same effect on all sectors? In Cogent Economics and Finance, 10(1). https://doi.org/10.1080/23322039.2021.1999058
Zayer, A. H. (2019). The Role of Monetary Policy in Achieving Economic Stability and Growth in Iraq 2011–2016. The Journal of Private Equity, 22(2), 83–90. https://www.jstor.org/stable/26864409