Ekonomika ISSN 1392-1258 eISSN 2424-6166
2024, vol. 103(1), pp. 25–43 DOI: https://doi.org/10.15388/Ekon.2024.103.1.2
Cryptocurrency Portfolio Management:A Clustering-Based Association Approach
Turan Kocabıyık
Süleyman Demirel University, Faculty of Economics and Administrative Sciences, Turkey
Email: turankocabiyik@sdu.edu.tr
ORCID: https://orcid.org/0000-0003-3651-206X
Meltem Karaatlı
Süleyman Demirel University, Faculty of Economics and Administrative Sciences, Turkey
Email: meltemkaraatli@sdu.edu.tr
ORCID: https://orcid.org/0000-0002-7403-9587
Mehmet Özsoy*
Suleyman Demirel University, Faculty of Economics and Administrative Sciences, Turkey
Email: mehmetozsoy@sdu.edu.tr
ORCID: https://orcid.org/0000-0003-3204-7295
Muhammet Fatih Özer
Suleyman Demirel University, Institute of Social Sciences, Turkey
Email: m.f.ozer@aybu.edu.tr
ORCID: https://orcid.org/0000-0002-5769-0204
Abstract. The aim of this study is to identify crypto assets with similar characteristics and to explore the similar responses of these assets to market-priced events. This process is carried out in two stages. Cluster analysis and association analysis were applied in the research. First of all, cluster analysis was performed using the variables; the total number of active unique addresses, USD value of the current supply, fixed closing price of the asset, return on investment of the asset, total of the current supply, number of transactions, USD value of the sum of native units and 30 days volatility criteria. HK-Means algorithm and R Program were used for clustering. Then, the co-movement of crypto assets was analyzed using the FP-Growth algorithm and the WEKA program. 71 crypto assets with the highest market capitalization and meeting the research criteria were included in the research. The data used in the research covers the period of May 2021-May 2022. According to the main findings obtained from the research; within the framework of the criteria used in the research, 4 clusters were formed. Most important association rules found to be between; btc (bitcoin) & aave (nominex), eth (ethereum) & aave (nominex), dot (polkadot) & aave (nominex), neo & aave (nominex), uni (uniswap) & aave (nominex) , btg (bitcoin gold) & etc (ethereum classic), xrp (riple) & algo (algorand) & doge (dogecoin), xrp (riple) & doge (dogecoin), cro (cronos) & xrp (riple) & algo ( algorand) & trx (tron) & doge (dogecoin).
Key Words: Cluster, Association Rule, Hierarchical K-means, FP-Growth, Cryptocurrency, Portfolio Management
________
* Correspondent author.
Received: 13/03/2023. Revised: 05/06/2023. Accepted: 20/12/2023
Copyright © 2024 Turan Kocabıyık, Meltem Karaatlı, Mehmet Özsoy, Muhammet Fatih Özer. Published by Vilnius University Press
This is an Open Access article distributed under the terms of the Creative Commons Attribution License, which permits unrestricted use, distribution, and reproduction in any medium, provided the original author and source are credited.
Introduction
Bitcoin is introduced in 2008 by Satoshi Nakamoto as a peer-to-peer blockchain network (Nakamoto, 2008). Bitcoin was a mean to decentralize the money transaction by securing the network with its investors (Albuquerque & Callado, 2015) and now it is the dominant currency in the digital currency market with a %38.2 market share. At the moment of this paper’s writing, there are 20.088 cryptocurrencies, and 514 exchanges with more than 800 billion dollars in total market capitalization (coinmetrics.io, 2022). Cryptocurrencies attracted worldwide attention since Bitcoin is introduced and people had and still have a different point of view about cryptocurrencies and their future. Some see them as a mean of day-to-day transactions, while others see them as a new financial asset. No matter how people see cryptocurrencies it is simply a way of transaction that does not use any intermediary or financial institutions to ensure the transactions are done properly with a minimum cost (Jalal et al., 2021).
The increasing interest in cryptocurrencies attracted many researchers and the studies focused on discovering more about the cryptocurrency market. The potential of cryptocurrencies being a hedge or safe haven is also been discussed in many studies (Bouri, Shahzad, et al., 2020; Dyhrberg, 2016; Hasan et al., 2022; Urquhart & Zhang, 2019) and the safe haven properties of the cryptocurrency market during COVID-19 is also discussed in the literature (Conlon & McGee, 2020; Melki & Nefzi, 2022; Mokni et al., 2022). The prices of cryptocurrencies in the market sometimes move collectively and sometimes respectively. For instance, the price of Bitcoin has a great impact on other coins due to its market dominance (Ciaian et al., 2018). Although the potential that the cryptocurrency market possesses, investors are still hesitant about adding crypto assets to their portfolios due to the lack of knowledge or they stay away because they find it risky. As in all decision-making processes, the more information we have in the field of investment, the easier it is to make a decision.
This paper aims to cluster the top cryptocurrencies to increase the knowledge of this market and help investors to make decisions more comfortably. However, it might not be enough to know which cryptocurrencies are clustering together, movements of these cryptocurrencies are also important for sequential investments. The results of the association analysis would help investors to identify former and later cryptocurrencies so that they can make bid/ask decisions depending on the movement of the former cryptocurrency. Publicly traded cryptocurrencies’ data are collected from coinmetrics.io for the time frame of May 21, 2021, to May 21, 2022. Out of the top 100 cryptocurrencies, 71 of them are analyzed. Stablecoins are excluded from the research because of their nature of being just an exchange mean. Furthermore, 7 cryptocurrencies are also excluded from the research due to the missing data on those currencies. After sorting and organizing the data, cluster analysis is conducted by using the hierarchical K-Means algorithm in R programming software. After collecting the cluster information, the association analysis is done by using WEKA software. First, the cryptocurrencies’ association is analyzed by disregarding the clusters in order to include Bitcoin (because Bitcoin is clustered alone) in the analysis, and then associations within clusters are investigated. In the following sections of this paper, a brief literature review will be provided along with the data used in the analysis. Furthermore, the methodology will be explained, and the findings will be presented. The last section will conclude the research.
Literature Review
The attraction over the decade that the cryptocurrency market got was not only for investors but also for researchers too. Among various subjects, cluster analysis was also conducted in order to understand the market more profoundly. The price of assets is one of the first things that comes to mind to assess financial markets. Price clustering analysis was first implemented in Bitcoin by Urquhart (2017) and the result of the study showed that there was a significant relationship between volume and price. The research on the relationship between price clusters and sentiments found that sentiment has a positive effect on price clustering in Bitcoin (Baig et al., 2019). The price clustering studies of Bitcoin were also extended by using different time frames for open, high, and low prices of Bitcoin (Li et al., 2020). Quiroga-Garcia et al. (2022) have used volume clustering for Bitcoin and other top cryptocurrencies in addition to price clustering and the results showed that price clustering happens at the same time with higher trading volumes. After some time, Bitcoin was introduced, the market grew exponentially, and other digital currencies were introduced. As mentioned above there are various cryptocurrencies and this led the researchers to investigate the relatedness of different cryptocurrencies, especially the leading currencies as trading volume-wise. While Bitcoin and Ethereum were two leading currencies, they were insufficient to draw conclusions from to have a general idea about the cryptocurrency market (Song et al., 2019; Zięba et al., 2019). Song et al. (2019) conducted a minimum spanning tree to cluster cryptocurrencies by using both filtered and unfiltered data and in comparison to the result the minor cryptocurrencies were found to be clustered more homogenously by filtering the influence of Bitcoin and Ethereum from the data. Cryptocurrencies are also clustered by using hierarchical clustering methods and COVID-19 effects on the crypto market were also examined in the literature (Avşar & Serin, 2020; Sadeqi, 2022; Yılmaz et al., 2020). Sensoy et al. (2021) clustered the returns and volatility of 12 top cryptocurrencies to analyze the spillover among them. According to the minimum spanning tree (MST) used in the study, Bitcoin, Litecoin, and Ethereum were found to be the most relevant cryptocurrencies.
Because the cryptocurrency market is perceived as an opportunity, some researchers focused on the similar dynamics and reactions of the cryptocurrency market and conventional financial assets (Corbet et al., 2018; Drożdż et al., 2018, 2020; James, 2021). Previous studies also examined the interdependence of cryptocurrencies with themselves (Ciaian et al., 2018). Stosic et al. (2018) utilized random matrix theory and MST to analyze the cross-correlation of the price volatility of different cryptocurrencies. Shi et al. (2020) found the price volatility of Bitcoin is positively correlated with Litecoin but on the other hand, they found Ethereum is related to other cryptocurrencies rather than Bitcoin. Hernández C. et al. (2021) stated in their study that price returns are more dominant than volume returns when the association rules are investigated, and the cryptocurrency market movement can be determined by the currencies with the highest market capitalization. Previous studies in the literature also showed that the correlation between paired cryptocurrencies is strong when one of the pair is the fork of the other (Burnie, 2018), and there is a spillover dynamic among the leading cryptocurrencies (Katsiampa et al., 2019). The relationship between cryptocurrencies also can be observed when the jumps in the market are examined because the possibility of a jump occurrence in one cryptocurrency is increased with a jump existence in another cryptocurrency (Bouri, Roubaud, et al., 2020).
Researchers are not only focused on the correlations but also focused on the fraud and misuse of the blockchain system. The fraud attempts and cyber-attack incidents are examined (Almukaynizi et al., 2018; Lv et al., 2020; Tan et al., 2021), Apriori algorithm-one of the association rule algorithms- is proposed to detect the misuse (Chen et al., 2019). When the paired currencies are examined, market size may not always be relevant to determine the strength of the pair’s correlation (Ji et al., 2019).
Clustering cryptocurrencies and association analysis are studied separately in the literature. In this study, a method similar to that of the studies that conducted cluster analysis in the literature was used. However, to the best of our knowledge, no study has been found in the literature that used cluster analysis and association analysis together. This study is expected to contribute to the literature in this aspect. This study may also help investors with portfolio management decisions.
Aim of the Research
Crypto assets have been seen as an investment tool by some investors since the day they were offered. Together with the risk they hold, they have taken their places in the portfolios. With this study, crypto assets with the highest market capitalization will be tried to be better known.
Having more information about investment tools will facilitate the decision-making processes of investors. This research has two main purposes. Firstly; with the help of various independent variables, crypto assets with similar characteristics will be determined. Based on the assumption that crypto assets with similar characteristics may show similar behaviors, as a result of the cluster analysis, association analysis will also be done for the assets in the same cluster. Thus, the opportunity will be viable from benefitting from the possible profit formation by considering that the rise that occurs in one of the crypto assets whose association is detected can also occur in the other. The same is true for downward movements. It is thought that the decrease that occurs in one of the crypto assets, whose association is detected statistically at the time of a possible decrease, will also occur in the other asset.
At this stage, it is possible to earn profits by selling the assets in the portfolio, by short selling or by taking a short position in the derivative market. In addition, if the portfolio is desired to diversify, the selection of crypto assets to be included in the portfolio from assets that do not move together will ensure that the total risk of the portfolio is minimized. The purpose of the research is to provide this information to decision makers.
Methodology
After retrieving and sorting, the cryptocurrency data was tested to see whether it is suitable for clustering. Hopkins Statistics was chosen for evaluating the clusterability of the data used in this study. There are several algorithms to cluster data according to its features and the hierarchical K-means algorithm is a hybrid method that covers some of the disadvantages of K-means algorithm. This algorithm was chosen as the clustering algorithm of the study. Furthermore, the Elbow Method was used in order to determine the optimal number of clusters. In accordance with the clusters obtained from the clustering algorithm, association analysis is conducted to observe which cryptocurrencies lead others and which ones follow. Among several algorithms when conducting association analysis, FP-growth is selected due to its wide usage. All the analysis results were collected using R and WEKA software.
Clustering
Cluster analysis is a method that has attracted many researchers’ attention and contributions in recent years with the help of the excess data in many different fields (Xu & Wunsch, 2005). The aim of clustering is to identify groups for a set of objects as a result of an unsupervised process (Gan et al., 2020).
There are many clustering algorithms such as K-means, hierarchical, EM clustering, BIRCH, DBSCAN, etc. These algorithms have been used in many diversified areas like artificial intelligence, information technology, biology, data mining, and marketing. Among clustering algorithms, K-means and hierarchical clustering algorithms are mostly used in these areas. Hierarchical clustering is considered an alternative to partitioning clustering when clustering in accordance with the similarity of features. One of the advantages of the hierarchical clustering method is that it does not require a predetermined number of clusters.
In this study, the hierarchical K-means algorithm, which has an important place among clustering algorithms, was used. However, before clustering the data Hopkins statistics was used to show the clustering ability of the dataset.
Hopkins Statistic
Hopkins statistics provide a realistic assessment of clustering tendency for real data sets (Lawson & Jurs, 1990). In order to calculate the Hopkins Statistics value, the mean nearest neighbor distance in the random dataset needs to be calculated and this value is divided by the sum of the mean nearest neighbor distances in the random and real dataset. If the Hopkins value is around 0.5 then the clustering tendency is weak, if it is close to 1 then the clustering tendency is strong, and the value between 0.1 and 0.3 means the data is clusterable (Banerjee & Dave, 2004). In addition, if the value of Hopkins statistic is close to zero, then the data set has a significant clustering tendency (Drab & Daszykowski, 2014).
Hierarchical K-means Clustering Algorithm
Hierarchical K-means is one of the most important clustering tasks in data mining and many other disciplines (Deng et al., 2011). Hierarchical K-means attracted a lot of attention and were widely used in various studies recently thanks to the clustering accuracy of hierarchical algorithms and fast convergence of K-means (Z. Shi et al., 2014). The algorithm works well for separated clusters. Separation means that the distance of any cluster center from any other point in that cluster should be less than the distance of that cluster center from any other cluster center (Reddy Edla et al., 2016). The hierarchical algorithm can be summarized step by step as (Govender & Sivakumar, 2020);
Step 1: Each observation in the dataset is taken as clusters.
Step 2: Distances of clusters to each other are calculated.
Step 3: Among the initial clusters, two clusters that have minimum distance values are merged as a single cluster. The distance matrix is calculated after the merge.
Step 4: Second and third steps are repeated until there is only one cluster.
There are three steps of hierarchical K-means clustering. The first one is to compute hierarchical clustering and cut the tree into k clusters. The second one is to compute the center of each cluster. The final step is to compute K-means by using the set of cluster centers as the initial cluster centers. In addition, it is important to determine the number of clusters when using the hierarchical K-means algorithm.
Elbow Method
The Elbow method is used for determining the optimal number of clusters. The method uses the variance of the clusters to select the best option. According to this strategy, one should choose a number of clusters so that including another cluster doesn’t significantly improve the data modeling (Bholowalia & Kumar, 2014). Furthermore, because it is not complicated to interpret, it is considered one of the most convenient methods (Liu & Deng, 2021). Visualization is also one of the advantages of the method.
Association Analysis
One of the most significant and thoroughly studied data mining approaches is association rule mining. It displays the data set’s patterns, relationships, and correlations. Let I=I1, I2,... for a set of data. Im might be a collection of m distinct characteristics, T could be a transaction containing a collection of objects such that T = I, and D could be a database having a variety of transaction records Ts. An implication in the form of XY, where X, Y I are sets of things known as item sets, and XY =, is an association rule. According to the rule, X implies Y because X is known as the antecedent and Y as the consequent. Support and confidence levels are two fundamental and important metrics for association rules. The proportion of records that include X and Y to all the records in the database is referred to as the support of an association rule. If an item has a 0.1% support, then only 0.1 percent of all transactions include the purchase of that item.
The ratio of the quantity of transactions containing X and Y to the entire quantity of records containing X is known as the confidence of an association rule. Assuming the confidence of the association rule XY is 80%, it means that 80% of the transactions that include X also contain Y collectively (Kotsiantis & Kanellopoulos, 2006). Confidence is a measure of the force of the association rules.
The lift can be explained as the relevance between X and Y representing the support value of X and Y if the subsets X and Y are statistically independent. Also, the conviction can be explained as a method used for the rule between X and Y and applied as an alternative method to the confidence criterion (Karaatli et al., 2021).
FP-growth, one of the important algorithms in association analysis, was used in this study. FP growth algorithm has been utilized to determine the most repeated itemset in a data set. Also, the FP-growth algorithm is a development of the Apriori algorithm. It builds a very dense data structure (FP-tree) to compress the original transaction database (Siahaan et al., 2018). Also, a frequent pattern has been used to decrease the number of scans of all databases to get the repeated itemset utilizing only two scans of the database (Zhang et al., 2008).
Data
All data of cryptocurrencies have been retrieved from https://www.coinmetrics.io/ website that ranked in the top 100 cryptocurrencies as of 05.21.2022 according to the market value of each coin from high to low. However, the number of cryptocurrencies that have been utilized in this study is 71 out of 100. Since some cryptocurrencies do not have enough data. Also, stablecoins are not included in this study. The cryptocurrencies included in the study are given below in Table 1.
Table 1. Codes and names of the cryptocurrencies included in the study
|
Code |
Name |
Code |
Name |
|
Code |
Name |
Code |
Name |
|
btc |
Bitcoin |
algo |
Algorand |
|
eth |
Ethereum |
alpha |
Alpha Venture |
|
inch |
1inch Network |
ant |
Aragon |
|
aave |
Aave |
bal |
Balancer |
|
ada |
Cardano |
bat |
Basic Attention Token |
|
bch |
Bitcoin Cash |
cvc |
Civic |
|
Bsv |
Bitcoin SV |
dash |
Dash |
|
btg |
Bitcoin Gold |
dcr |
Decred |
|
comp |
Compound |
dgb |
DigiByte |
|
cro |
Cronos |
doge |
Dogecoin |
|
crv |
Curve DAO Token |
dot |
Polkadot |
|
drgn |
Dragonchain |
ftt |
FTX Token |
|
elf |
Aelf |
fun |
FunToken |
|
etc |
Ethereum Classic |
gas |
Gas |
|
gno |
Gnosis |
maid |
MaidSafeCoin |
|
gnt |
GreenTrust |
mana |
Decentraland |
|
ht |
Huobi Token |
mkr |
Maker |
|
knc |
Kyber Network Crystal v2 |
neo |
Neo |
|
lend |
Aave (old) |
nxm |
Nxm |
|
link |
Chainlink |
omg |
Omg Network |
|
loom |
Loom Network |
paxg |
Pax Gold |
|
lpt |
Livepeer |
pay |
Tenx |
|
Ltc |
Litecoin |
perp |
Perpetual Protocol |
|
poly |
Polymath |
sushi |
SushiSwap |
|
powr |
Powerledger |
swrv |
Swerve |
|
ppt |
Populous |
trx |
Tron |
|
qash |
Qash |
uma |
Uma |
|
qnt |
Quant |
uni |
Uniswap |
|
ren |
Ren |
vtc |
Vertcoin |
|
rep |
Augur |
wnxm |
Wrapped NXM |
|
snt |
Status |
wtc |
Waltonchain |
|
snx |
Synthetix |
xaut |
Tether Gold |
|
srm |
Serum |
xlm |
Stellar |
|
xrp |
XRP |
xvg |
Verge |
|
yfi |
Yearn.finance |
zec |
Zcash |
|
zrx |
0x |
Source: coinmetrics.io, 2022 access date: 01.04.2022
url: https://coinmetrics.io
Daily data on cryptocurrencies have been used. The method used when issuing cryptocurrencies is the average method. The time period of the available data for 71 cryptocurrencies is 21.05.2021 and 21.05.2022 and the data is arranged according to determined variables. There are 8 independent variables used in this study. These variables are taken from the coinmetrics.io website. The definitions and abbreviations of each variable are given in Table 2.
Table 2. Clustering Variables used in the study
|
Number |
Variables |
Definition |
|
1 |
AdrActCnt |
The sum count of unique addresses that were active in the network that day |
|
2 |
CapMrktCurUSD |
The sum USD value of the current supply. Also referred to as network value or market capitalization. |
|
3 |
PriceUSD |
The fixed closing price of the asset as of 00:00 UTC the following day (i.e., midnight UTC of the current day) denominated in USD. |
|
4 |
ROI30d |
The return on investment for the asset assuming a purchase 30 days prior. |
|
5 |
SplyCur |
The sum of all native units ever created and currently visible on the ledger (i.e., issued) as of that day. For account-based protocols, only accounts with positive balances are counted. |
|
6 |
TxCnt |
The sum count of transactions that day. |
|
7 |
TxTfrValAdjUSD |
The USD value of the sum of native units transferred that interval removing noise and certain artifacts. |
|
8 |
VtyDayRet30d |
The 30 days volatility, measured as the deviation of log returns |
Source: coinmetrics.io, 2022 access date: 01.04.2022
url: https://coinmetrics.io/community-network-data/
Results
The data collected from the cryptocurrency database is first arranged and sorted for R and the Hopkins value is calculated with the purpose of finding the clustering tendency of the data. The Hopkins value is calculated as 0.1119498 which leads to the conclusion that the data has a strong clustering tendency. This value shows that using appropriate methods of clustering would lead a meaningful and reliable results. After allocating the clusterability of the data, the next step was to determine the optimal number of clusters. The Elbow method was used for this purpose for both calculating the optimal number of clusters and visualizing the results for decision-making. According to the Elbow method, the optimal number is calculated as 4 clusters which can be seen in Figure 1. This number makes sense because when the cryptocurrency market is examined, there are cryptocurrencies that dominate the market and so many cryptocurrencies follow these dominant ones. Hence, clustering the cryptocurrencies that have similar features and determining the association rules between them make the bid/ask decisions more profound.
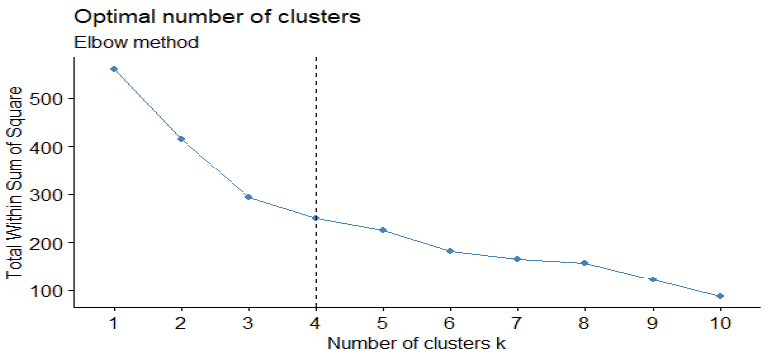
Figure 1. Optimal number of clusters according to the Elbow Method
The clusters are determined by the hierarchical K-means clustering algorithm and are shown in Figure 2 as a dendrogram. As expected, Bitcoin has clustered alone most probably due to its market dominance. Similarly, Ethereum is clustered with just one cryptocurrency which is ADA. This cluster also makes sense in terms of market share.
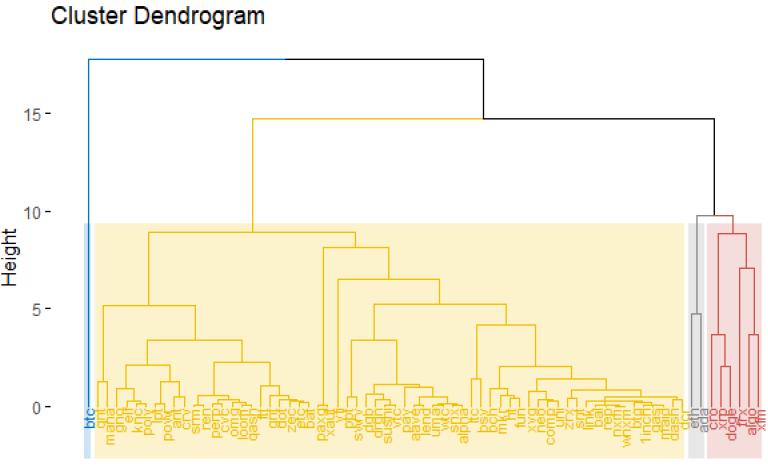
Figure 2. Hierarchical K-means clustering algorithm result
It was observed that most of the cryptocurrencies, 62 of them to be precise, are clustered in the second cluster. Figure 3 also shows the clusters as a scatter plot.
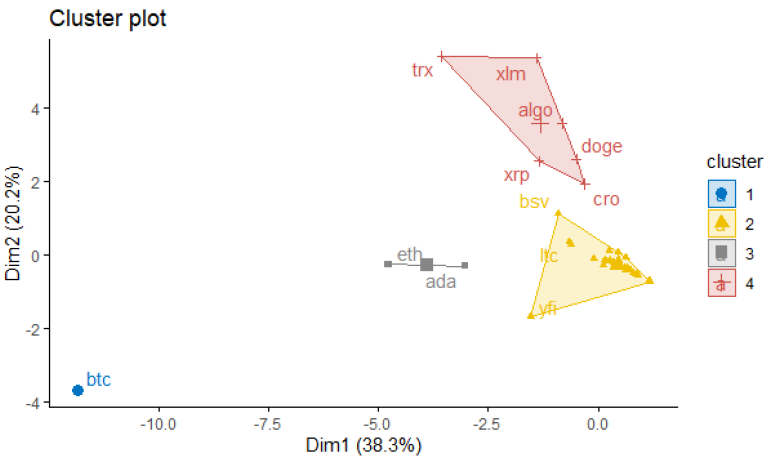
Figure 3. The Clustering Results Generated According to The X and Y Lines
Association analysis in the study was performed in WEKA software. In the analysis, the support value was chosen as 0.4 and the confidence value was chosen as 0.95. Among the 4 clusters determined by the hierarchical K-means method, because the 1st cluster contains just BTC the association analysis did not perform on that cluster. Instead, all cryptocurrencies were included in the first association rule mining process with the purpose of including BTC in the analysis. The results of the first association analysis are given in Table 3 and BTC and ETH were examined as the leading cryptocurrencies in the market. It is seen in the 9th rule that btc moves together with lend 149 times aave accompanies them, and their confidence level can be seen as 149/149=1. Also in the 10th rule which also has a confidence level of 1, btc moves together with aave 149 times and in all 149 times lend accompanies them. ETH acts together with aave and lend 150 times in 11th and 12th rule and same situation exists for eth as btc in 9th and 10th rules. It can be observed that while btc and ftt act together 157 times, eth accompanies them 150 times with a confidence level of 0.96. Although btc and eth are the leading currencies, some other cryptocurrencies were observed to have more association rules than leading currencies. It is seen that lend and aave acted together 181 times and wnxm and nxm cryptocurrencies acted together 169 times. The number of rules for these currencies is higher than those of the leading currencies, which can be explained by the fact that these currencies are essentially derivatives of each other. This results strongly supports the success of the association analysis.
Table 3. Association rules of the cluster in which all cryptocurrencies are located.
|
Number |
Association Rules |
Conf. |
Lift |
Lev. |
Conv. |
|
1 |
[lend=1]: 181 ==> [aave=1]: 181 |
1 |
2.02 |
0.25 |
91.49 |
|
2 |
[aave=1]: 181 ==> [lend=1]: 181 |
1 |
2.02 |
0.25 |
91.49 |
|
3 |
[wnxm=1]: 169 ==> [nxm=1]: 169 |
1 |
2.17 |
0.25 |
90.96 |
|
4 |
[nxm=1]: 169 ==> [wnxm=1]: 169 |
1 |
2.17 |
0.25 |
90.96 |
|
5 |
[gnt=1, lend=1]: 147 ==> [aave=1]: 147 |
1 |
2.02 |
0.2 |
74.3 |
|
6 |
[gnt=1, aave=1]: 147 ==> [lend=1]: 147 |
1 |
2.02 |
0.2 |
74.3 |
|
7 |
[zrx=1, lend=1]: 151 ==> [aave=1]: 151 |
1 |
2.02 |
0.21 |
76.33 |
|
8 |
[zrx=1, aave=1]: 151 ==> [lend=1]: 151 |
1 |
2.02 |
0.21 |
76.33 |
|
9 |
[btc=1, lend=1]: 149 ==> [aave=1]: 149 |
1 |
2.02 |
0.21 |
75.31 |
|
10 |
[btc=1, aave=1]: 149 ==> [lend=1]: 149 |
1 |
2.02 |
0.21 |
75.31 |
|
11 |
[eth=1, lend=1]: 150 ==> [aave=1]: 150 |
1 |
2.02 |
0.21 |
75.82 |
|
12 |
[eth=1, aave=1]: 150 ==> [lend=1]: 150 |
1 |
2.02 |
0.21 |
75.82 |
|
13 |
[dot=1, lend=1]: 151 ==> [aave=1]: 151 |
1 |
2.02 |
0.21 |
76.33 |
|
14 |
[dot=1, aave=1]: 151 ==> [lend=1]: 151 |
1 |
2.02 |
0.21 |
76.33 |
|
15 |
[link=1, lend=1]: 150 ==> [aave=1]: 150 |
1 |
2.02 |
0.21 |
75.82 |
|
16 |
[link=1, aave=1]: 150 ==> [lend=1]: 150 |
1 |
2.02 |
0.21 |
75.82 |
|
17 |
[neo=1, lend=1]: 152 ==> [aave=1]: 152 |
1 |
2.02 |
0.21 |
76.83 |
|
18 |
[neo=1, aave=1]: 152 ==> [lend=1]: 152 |
1 |
2.02 |
0.21 |
76.83 |
|
19 |
[inch=1, lend=1]: 150 ==> [aave=1]: 150 |
1 |
2.02 |
0.21 |
75.82 |
|
20 |
[inch=1, aave=1]: 150 ==> [lend=1]: 150 |
1 |
2.02 |
0.21 |
75.82 |
|
21 |
[snx=1, lend=1]: 151 ==> [aave=1]: 151 |
1 |
2.02 |
0.21 |
76.33 |
|
22 |
[snx=1, aave=1]: 151 ==> [lend=1]: 151 |
1 |
2.02 |
0.21 |
76.33 |
|
23 |
[ltc=1, lend=1]: 147 ==> [aave=1]: 147 |
1 |
2.02 |
0.2 |
74.3 |
|
24 |
[ltc=1, aave=1]: 147 ==> [lend=1]: 147 |
1 |
2.02 |
0.2 |
74.3 |
|
25 |
[bal=1, lend=1]: 148 ==> [aave=1]: 148 |
1 |
2.02 |
0.2 |
74.81 |
|
26 |
[bal=1, aave=1]: 148 ==> [lend=1]: 148 |
1 |
2.02 |
0.2 |
74.81 |
|
27 |
[yfi=1, lend=1]: 147 ==> [aave=1]: 147 |
1 |
2.02 |
0.2 |
74.3 |
|
28 |
[yfi=1, aave=1]: 147 ==> [lend=1]: 147 |
1 |
2.02 |
0.2 |
74.3 |
|
29 |
[lend=1, uni=1]: 151 ==> [aave=1]: 151 |
1 |
2.02 |
0.21 |
76.33 |
|
30 |
[aave=1, uni=1]: 151 ==> [lend=1]: 151 |
1 |
2.02 |
0.21 |
76.33 |
|
31 |
[lend=1, comp=1]: 149 ==> [aave=1]: 149 |
1 |
2.02 |
0.21 |
75.31 |
|
32 |
[aave=1, comp=1]: 149 ==> [lend=1]: 149 |
1 |
2.02 |
0.21 |
75.31 |
|
33 |
[ftt=1, btc=1]: 157 ==> [eth=1]: 150 |
0.96 |
1.84 |
0.19 |
9.44 |
|
34 |
[btg=1, etc=1]: 155 ==> [bch=1]: 147 |
0.95 |
1.88 |
0.19 |
8.52 |
Cluster 2 contains only eth and ada. The support value was taken as 0.4 same as in the previous analysis, however, no rule could be found according to the WEKA analysis results. Table 4 shows the association rules of the 3rd cluster, which includes 62 crypto assets. In the analysis, the support value was taken as 0.4, and the confidence value as 0.95. According to the results of the association analysis of the cluster with 62 cryptocurrencies aave and lend were acted together 181 times similar to 1st cluster’s association results due to being derivatives of each other. Likewise, wnxm and nxm acted together 169 times.
Table 4. Association rules of 62 cryptocurrencies in cluster 3
|
Number |
Association Rules |
Conf. |
Lift |
Lev. |
Conv. |
|
1 |
[lend=1]: 181 ==> [aave=1]: 181 |
1 |
2.02 |
0.25 |
91.49 |
|
2 |
[aave=1]: 181 ==> [lend=1]: 181 |
1 |
2.02 |
0.25 |
91.49 |
|
3 |
[wnxm=1]: 169 ==> [nxm=1]: 169 |
1 |
2.02 |
0.25 |
90.96 |
|
4 |
[nxm=1]: 169 ==> [wnxm=1]: 169 |
1 |
2.02 |
0.25 |
90.96 |
|
5 |
[gnt=1, lend=1]: 147 ==> [aave=1]: 147 |
1 |
2.02 |
0.2 |
74.3 |
|
6 |
[gnt=1, aave=1]: 147 ==> [lend=1]: 147 |
1 |
2.02 |
0.2 |
74.3 |
|
7 |
[zrx=1, lend=1]: 151 ==> [aave=1]: 151 |
1 |
2.02 |
0.21 |
76.33 |
|
8 |
[zrx=1, aave=1]: 151 ==> [lend=1]: 151 |
1 |
2.02 |
0.21 |
76.33 |
|
9 |
[dot=1, lend=1]: 151 ==> [aave=1]: 151 |
1 |
2.02 |
0.21 |
76.33 |
|
10 |
[dot=1, aave=1]: 151 ==> [lend=1]: 151 |
1 |
2.02 |
0.21 |
76.33 |
|
11 |
[link=1, lend=1]: 150 ==> [aave=1]: 150 |
1 |
2.02 |
0.21 |
75.82 |
|
12 |
[link=1, aave=1]: 150 ==> [lend=1]: 150 |
1 |
2.02 |
0.21 |
75.82 |
|
13 |
[neo=1, lend=1]: 152 ==> [aave=1]: 152 |
1 |
2.02 |
0.21 |
76.83 |
|
14 |
[neo=1, aave=1]: 152 ==> [lend=1]: 152 |
1 |
2.02 |
0.21 |
76.83 |
|
15 |
[inch=1, lend=1]: 150 ==> [aave=1]: 150 |
1 |
2.02 |
0.21 |
75.82 |
|
16 |
[inch=1, aave=1]: 150 ==> [lend=1]: 150 |
1 |
2.02 |
0.21 |
75.82 |
|
17 |
[snx=1, lend=1]: 151 ==> [aave=1]: 151 |
1 |
2.02 |
0.21 |
76.33 |
|
18 |
[snx=1, aave=1]: 151 ==> [lend=1]: 151 |
1 |
2.02 |
0.21 |
76.33 |
|
19 |
[ltc=1, lend=1]: 147 ==> [aave=1]: 147 |
1 |
2.02 |
0.2 |
74.3 |
|
20 |
[ltc=1, aave=1]: 147 ==> [lend=1]: 147 |
1 |
2.02 |
0.2 |
74.3 |
|
21 |
[bal=1, lend=1]: 148 ==> [aave=1]: 148 |
1 |
2.02 |
0.2 |
74.81 |
|
22 |
[bal=1, aave=1]: 148 ==> [lend=1]: 148 |
1 |
2.02 |
0.2 |
74.81 |
|
23 |
[yfi=1, lend=1]: 147 ==> [aave=1]: 147 |
1 |
2.02 |
0.2 |
74.3 |
|
24 |
[yfi=1, aave=1]: 147 ==> [lend=1]: 147 |
1 |
2.02 |
0.2 |
74.3 |
|
25 |
[lend=1, uni=1]: 151 ==> [aave=1]: 151 |
1 |
2.02 |
0.21 |
76.33 |
|
26 |
[aave=1, uni=1]: 151 ==> [lend=1]: 151 |
1 |
2.02 |
0.21 |
76.33 |
|
27 |
[lend=1, comp=1]: 149 ==> [aave=1]: 149 |
1 |
2.02 |
0.21 |
75.31 |
|
28 |
[aave=1, comp=1]: 149 ==> [lend=1]: 149 |
1 |
2.02 |
0.21 |
75.31 |
|
29 |
[btg=1, etc=1]: 155 ==> [bch=1]: 147 |
0.95 |
1.88 |
0.19 |
8.52 |
In addition to lend (aave) and nxm (wnxm) in the first 4 rule, gnt acted together with lend in 5th rule and with aave in 6th rule with a confidence level of 1. Same situation is observed in 7th and 8th rules for zrx and 9th and 10th rules for dot. This can be interpreted as lend and aave are leading crypto assets in the 3rd cluster and almost all of other crypto assets are accompanies the two.
For the last cluster, support and confidence values are taken as 0.1 and 0.90 respectively in which these values were taken as 0.4 and 0.90 again respectively. The reason for changing the values was that there was no rule to be found when the values are at the same level as the other two cluster’s association analysis. The association analysis results of cluster 4 are given in Table 5.
Table 5. Association rules of 6 cryptocurrencies in cluster 4
|
Num- |
Association Rules |
Conf. |
Lift |
Lev. |
Conv. |
|
Num- |
Association Rules |
Conf. |
Lift |
Lev. |
Conv. |
|
1 |
[cro=1, xlm=1, xrp=1, doge=1]: 95 ==> [trx=1]: 90 |
0.95 |
1.77 |
0.11 |
7.35 |
|
2 |
[trx=1, algo=1, xlm=1, doge=1]: 89 ==> [cro=1]: 84 |
0.94 |
1.77 |
0.1 |
6.93 |
|
3 |
[xlm=1, xrp=1, doge=1]: 103 ==> [trx=1]: 97 |
0.94 |
1.76 |
0.11 |
6.83 |
|
4 |
[trx=1, algo=1, xlm=1, xrp=1, doge=1]: 82 |
0.94 |
1.76 |
0.09 |
6.39 |
|
5 |
[cro=1, algo=1, xlm=1, xrp=1, doge=1]: 82 ==> [trx=1]: 77 |
0.94 |
1.75 |
0.09 |
6.35 |
|
6 |
[cro=1, xrp=1, doge=1]: 126 ==> [trx=1]: 118 |
0.94 |
1.75 |
0.14 |
6.5 |
|
7 |
[cro=1, algo=1, xrp=1, doge=1]: 109 ==> [trx=1]: 102 |
0.94 |
1.75 |
0.12 |
6.33 |
|
8 |
[trx=1, xlm=1, doge=1]: 106 ==> [cro=1]: 99 |
0.93 |
1.75 |
0.12 |
6.19 |
|
9 |
[algo=1, xrp=1, doge=1]: 120 ==> [trx=1]: 112 |
0.93 |
1.74 |
0.13 |
6.19 |
|
10 |
[cro=1, algo=1, xlm=1, doge=1]: 90 ==> [trx=1]: 84 |
0.93 |
1.74 |
0.1 |
5.97 |
|
11 |
[algo=1, xlm=1, xrp=1, doge=1]: 88 ==> [trx=1]: 82 |
0.93 |
1.74 |
0.1 |
5.84 |
|
12 |
[algo=1, xlm=1, xrp=1, doge=1]: 88 ==> [cro=1]: 82 |
0.93 |
1.75 |
0.1 |
5.87 |
|
13 |
[xrp=1, doge=1]: 140 ==> [trx=1]: 130 |
0.93 |
1.73 |
0.15 |
5.91 |
|
14 |
[algo=1, xlm=1, doge=1]: 97 ==> [cro=1]: 90 |
0.93 |
1.74 |
0.1 |
5.66 |
|
15 |
[trx=1, xlm=1, xrp=1, doge=1]: 97 ==> [cro=1]: 90 |
0.93 |
1.74 |
0.1 |
5.66 |
|
16 |
[trx=1, algo=1, doge=1]: 121 ==> [xrp=1]: 112 |
0.93 |
1.9 |
0.15 |
6.22 |
|
17 |
[cro=1, xlm=1, doge=1]: 107 ==> [trx=1]: 99 |
0.93 |
1.73 |
0.11 |
5.52 |
|
18 |
[cro=1, algo=1, doge=1]: 120 ==> [trx=1]: 111 |
0.93 |
1.73 |
0.13 |
5.57 |
|
19 |
[trx=1, algo=1, xlm=1, xrp=1]: 92 ==> [cro=1]: 85 |
0.92 |
1.73 |
0.1 |
5.37 |
|
20 |
[xlm=1, xrp=1, doge=1]: 103 ==> [cro=1]: 95 |
0.92 |
1.73 |
0.11 |
5.35 |
|
21 |
[trx=1, algo=1, xlm=1, doge=1]: 89 ==> [xrp=1]: 82 |
0.92 |
1.89 |
0.11 |
5.71 |
|
22 |
[trx=1, cro=1, algo=1, doge=1]: 111 ==> [xrp=1]: 102 |
0.92 |
1.89 |
0.13 |
5.7 |
|
23 |
[algo=1, xlm=1, doge=1]: 97 ==> [trx=1]: 89 |
0.92 |
1.71 |
0.1 |
5.01 |
|
24 |
[cro=1, xlm=1, xrp=1]: 109 ==> [trx=1]: 100 |
0.92 |
1.71 |
0.11 |
5.06 |
|
25 |
[trx=1, algo=1, doge=1]: 121 ==> [cro=1]: 111 |
0.92 |
1.72 |
0.13 |
5.14 |
|
26 |
[trx=1, cro=1, algo=1, xlm=1, doge=1]: 84 ==> [xrp=1]: 77 |
0.92 |
1.88 |
0.1 |
5.39 |
|
27 |
[trx=1, xlm=1, doge=1]: 106 ==> [xrp=1]: 97 |
0.92 |
1.88 |
0.12 |
5.44 |
|
28 |
[algo=1, xlm=1, xrp=1]: 103 ==> [cro=1]: 94 |
0.91 |
1.72 |
0.11 |
4.81 |
|
29 |
[cro=1, algo=1, xlm=1, doge=1]: 90 ==> [xrp=1]: 82 |
0.91 |
1.87 |
0.1 |
5.14 |
|
30 |
[trx=1, algo=1, xrp=1, doge=1]: 112 ==> [cro=1]: |
0.91 |
1.71 |
0.12 |
4.76 |
|
31 |
[trx=1, doge=1]: 144 ==> [cro=1]: 131 |
0.91 |
1.71 |
0.15 |
4.81 |
|
32 |
[cro=1, doge=1]: 144 ==> [trx=1]: 131 |
0.91 |
1.7 |
0.15 |
4.78 |
|
33 |
[trx=1, cro=1, xlm=1, doge=1]: 99 ==> [xrp=1]: 90 |
0.91 |
1.87 |
0.11 |
5.09 |
|
34 |
[cro=1, algo=1, doge=1]: 120 ==> [xrp=1]: 109 |
0.91 |
1.87 |
0.14 |
5.14 |
|
35 |
[algo=1, xrp=1, doge=1]: 120 ==> [cro=1]: 109 |
0.91 |
1.7 |
0.12 |
4.67 |
|
36 |
[trx=1, xrp=1, doge=1]: 130 ==> [cro=1]: 118 |
0.91 |
1.7 |
0.13 |
4.67 |
|
37 |
[algo=1, xlm=1, doge=1]: 97 ==> [xrp=1]: 88 |
0.91 |
1.87 |
0.11 |
4.98 |
|
38 |
[cro=1, xrp=1]: 150 ==> [trx=1]: 136 |
0.91 |
1.69 |
0.15 |
4.64 |
|
39 |
[trx=1, cro=1, algo=1, xlm=1, xrp=1]: 85 ==> [doge=1]: 77 |
0.91 |
1.94 |
0.1 |
5.03 |
|
40 |
[cro=1, algo=1, xlm=1, xrp=1]: 94 ==> [trx=1]: 85 |
0.9 |
1.69 |
0.09 |
4.37 |
|
41 |
[algo=1, doge=1]: 134 ==> [trx=1]: 121 |
0.9 |
1.69 |
0.13 |
4.45 |
|
42 |
[trx=1, doge=1]: 144 ==> [xrp=1]: 130 |
0.9 |
1.86 |
0.16 |
4.93 |
|
43 |
[trx=1, xlm=1, xrp=1]: 111 ==> [cro=1]: 100 |
0.9 |
1.69 |
0.11 |
4.32 |
|
44 |
[trx=1, cro=1, doge=1]: 131 ==> [xrp=1]: 118 |
0.9 |
1.85 |
0.15 |
4.81 |
|
45 |
[xrp=1, doge=1]: 140 ==> [cro=1]: 126 |
0.9 |
1.69 |
0.14 |
4.36 |
|
46 |
[trx=1, cro=1, xlm=1, xrp=1]: 100 ==> [doge=1]: 90 |
0.9 |
1.93 |
0.12 |
4.84 |
When the first rule is examined, cro, xlm, xrp, doge increased together 95 times during the research period, while trx accompanied these variables 90 times. According to the second equation, trx, algo, xlm, doge acted together 89 times, while cro accompanied these crypto assets 84 times. In addition, when looking at the highest frequency, cro and xrp variables acted together 150 times in the 38th rule, while trx accompanied them 136 times.
Conclusion
This research is carried out in order to help crypto asset investors in their portfolio management processes. The more information decision makers have, the easier it will be for them to make decisions. It will also increase their level of success. Today, developments in technology and communication tools create a huge amount of data. Which of these big data to use causes confusion. This study aims to use big data on crypto-assets to obtain tips that can be used by portfolio managers. While designing the research, two stages were determined. First, crypto assets that are important in terms of market capitalization are clustered according to the criteria determined. The aim here is to recognize assets with similar characteristics. Then, the co-movements within the groups obtained as a result of the clustering analysis and between all crypto assets included in the research were analyzed. This is done for two main reasons. First, considering that the upward or downward movement in one of the crypto assets whose association rule is detected will cause the others to behave in the same way, it is possible to take advantage of the earning potential by taking a long position in case of an increase and a short position in case of a decrease. In addition, when the findings are evaluated in terms of portfolio diversification, crypto assets with no co-movement detected can be used for diversification purposes. This will reduce the total risk of the portfolio.
When the findings obtained within the scope of the research are analyzed specifically, this research, which tries to explore the co-movement of crypto assets were examined with data for the period of May 2021 and May 2022. Within the framework of the criteria used in the research, 4 clusters were formed. The first cluster consists only of bitcoin. The separation of bitcoin from others can be considered normal considering its market dominance and other characteristics. The second cluster included ethereum and cardano. Both are blockchain platforms. Another cluster included cronos, riple, dogecoin, tron, algorand and stellar. Three of these assets are blockchains. Two of them are payment systems and one is meme coin. All other cryptos are clustered together. When the research findings are examined, the following syntheses can be made regarding the association analysis. Very significant co-movements of Lend (aave old) & aave and wnxm (wrapped nominex) & nxm (nominex) crypto assets have been detected. This is normal as these are derivatives of each other. These findings are actually an indication that the association analysis works correctly. The most important association rules are between; btc (bitcoin) & aave (nominex), eth (ethereum) & aave (nominex), dot (polkadot) & aave (nominex), neo & aave (nominex), uni (uniswap) & aave (nominex), btg (bitcoin gold) & etc (ethereum classic), xrp (riple) & algo (algorand) & doge (dogecoin), xrp (riple) & doge (dogecoin), cro (cronos) & xrp (riple) & algo ( algorand) & trx (tron) & doge (dogecoin). In the light of the information presented, when the crypto assets mentioned here are used for portfolio diversification, the expected level of portfolio risk cannot be achieved as a result of diversification. Because there is a co-movement between these crypto assets. For example, decision makers who want to diversify portfolio should not include lend & aave, wnxm & nxm, btc & lend & aave, eth & lend & aave in the same portfolio.
In addition, according to the association analysis with cluster 4, doge and xrp were found to move together in 29 of the 46 association rules obtained. Again, while xlm and doge acted together 22 times in a total of 46 association rules, algo and doge acted together 23 times. Considering that these cryptocurrencies exhibit price movements in a similar direction, it would be beneficial for investors not to be used in portfolio diversification. Considering that an increase in one of these variables will also occur in the other variable with which it associates, it is thought that it can guide us in portfolio management. In light of this information, it is thought that the study will be beneficial for both individual and corporate portfolio managers.
References
Albuquerque, B. S. de, & Callado, M. de C. (2015). Understanding bitcoins: Facts and questions. Revista Brasileira de Economia, Vol. 69, p. 3–16. https://doi.org/10.5935/0034-7140.20150001
Almukaynizi, M., Paliath, V., Shah, M., Shah, M., & Shakarian, P. (2018). Finding cryptocurrency attack indicators using temporal logic and darkweb data. 2018 IEEE International Conference on Intelligence and Security Informatics (ISI), p. 91–93. https://doi.org/10.1109/ISI.2018.8587361
Avşar, İ. İ., & Serin, Z. V. (2020). Seçili Kripto Paralarda Kümeleme Analizi. Journal of Turkish Social Sciences Research, Vol. 5, Issue 1, p. 41–52.
Baig, A., Blau, B. M., & Sabah, N. (2019). Price clustering and sentiment in bitcoin. Finance Research Letters, Vol. 29, p. 111–116. https://doi.org/10.1016/j.frl.2019.03.013
Banerjee, A., & Dave, R. N. (2004). Validating clusters using the Hopkins statistic. 2004 IEEE International Conference on Fuzzy Systems (IEEE Cat. No. 04CH37542), Vol. 1, p. 149–153.
Bholowalia, P., & Kumar, A. (2014). EBK-Means: A clustering technique based on Elbow Method and K-Means in WSN. International Journal of Computer Applications, Vol. 105, Issue 9. https://doi.org/10.5120/18405-9674
Bouri, E., Roubaud, D., & Shahzad, S. J. H. (2020). Do bitcoin and other cryptocurrencies jump together? The Quarterly Review of Economics and Finance, Vol. 76, p. 396–409. https://doi.org/10.1016/j.qref.2019.09.003
Bouri, E., Shahzad, S. J. H., Roubaud, D., Kristoufek, L., & Lucey, B. (2020). Bitcoin, gold, and commodities as safe havens for stocks: New insight through wavelet analysis. The Quarterly Review of Economics and Finance, Vol. 77, p. 156–164. https://doi.org/10.1016/j.qref.2020.03.004
Burnie, A. (2018). Exploring the interconnectedness of cryptocurrencies using correlation networks. Cryptocurrency Research Conference 2018. https://doi.org/10.48550/arXiv.1806.06632
Chen, W., Xu, Y., Zheng, Z., Zhou, Y., Yang, J. E., & Bian, J. (2019). Detecting ‘Pump & Dump Schemes’ on cryptocurrency market using an improved Apriori algorithm. 2019 IEEE International Conference on Service-Oriented System Engineering (SOSE), p. 293–2935. https://doi.org/10.1109/SOSE.2019.00050
Ciaian, P., Rajcaniova, M., & Kancs, d’Artis. (2018). Virtual relationships: Short- and long-run evidence from bitcoin and altcoin markets. Journal of International Financial Markets, Institutions and Money, Vol. 52, p. 173–195. https://doi.org/10.1016/j.intfin.2017.11.001
coinmetrics.io, 2022. (2022). Coinmetrics.io. https://coinmetrics.io/
Conlon, T., & McGee, R. (2020). Safe haven or risky hazard? Bitcoin during the Covid-19 bear market. Finance Research Letters, Vol. 35, p. 101607. https://doi.org/10.1016/j.frl.2020.101607
Corbet, S., Meegan, A., Larkin, C., Lucey, B., & Yarovaya, L. (2018). Exploring the dynamic relationships between cryptocurrencies and other financial assets. Economics Letters, Vol. 165, p. 28–34. https://doi.org/10.1016/j.econlet.2018.01.004
Deng, H., Miao, D., Lei, J., & Wang, F. L. (2011). Artificial intelligence and computational intelligence: Second International Conference, AICIS 2011, Taiyuan, China, September 24-25, 2011, Proceedings. Springer Science & Business Media.
Drab, K., & Daszykowski, M. (2014). Clustering in analytical chemistry. Journal of AOAC International, Vol. 97, Issue 1, p. 29–38. https://doi.org/10.5740/jaoacint.SGEDrab
Drożdż, S., Gȩbarowski, R., Minati, L., Oświȩcimka, P., & Wa̧torek, M. (2018). Bitcoin market route to maturity? Evidence from return fluctuations, temporal correlations and multiscaling effects. Chaos: An Interdisciplinary Journal of Nonlinear Science, Vol. 28, Issue 7. https://doi.org/10.1063/1.5036517
Drożdż, S., Minati, L., Oświȩcimka, P., Stanuszek, M., & Wa̧torek, M. (2020). Competition of noise and collectivity in global cryptocurrency trading: Route to a self-contained market. Chaos: An Interdisciplinary Journal of Nonlinear Science, Vol. 30, Issue 2. https://doi.org/10.1063/1.5139634
Dyhrberg, A. H. (2016). Bitcoin, gold and the dollar – A GARCH volatility analysis. Finance Research Letters, Vol. 16, p. 85–92. https://doi.org/10.1016/j.frl.2015.10.008
Gan, G., Ma, C., & Wu, J. (2020). Data Clustering: Theory, Algorithms, and Applications, Second Edition. SIAM.
Govender, P., & Sivakumar, V. (2020). Application of k-means and hierarchical clustering techniques for analysis of air pollution: A review (1980–2019). Atmospheric Pollution Research, Vol. 11, Issue 1, p. 40–56. https://doi.org/10.1016/j.apr.2019.09.009
Hasan, Md. B., Hassan, M. K., Karim, Z. A., & Rashid, Md. M. (2022). Exploring the hedge and safe haven properties of cryptocurrency in policy uncertainty. Finance Research Letters, Vol. 46. https://doi.org/10.1016/j.frl.2021.102272
Hernández C., J. B., García-Medina, A., & Porro V., M. A. (2021). Study of the behavior of cryptocurrencies in turbulent times using association rules. Mathematics, Vol. 9, Issue 14. https://doi.org/10.3390/math9141620
Jalal, R. N.-U.-D., Alon, I., & Paltrinieri, A. (2021). A bibliometric review of cryptocurrencies as a financial asset. Technology Analysis & Strategic Management, p. 1–16. https://doi.org/10.1080/09537325.2021.1939001
James, N. (2021). Dynamics, behaviours, and anomaly persistence in cryptocurrencies and equities surrounding COVID-19. Physica A: Statistical Mechanics and Its Applications, Vol. 570. https://doi.org/10.1016/j.physa.2021.125831
Ji, Q., Bouri, E., Lau, C. K. M., & Roubaud, D. (2019). Dynamic connectedness and integration in cryptocurrency markets. International Review of Financial Analysis, Vol. 63, p. 257–272. https://doi.org/10.1016/j.irfa.2018.12.002
Karaatlı, M., Kocabıyık, T., Çal Yalçıner, D., & Çolak, M. (2021). Data mining: Investigation of co-movements of Bist-30 stocks by association rule. The Journal of Financial Researches and Studies, Vol. 13, Issue 25, p. 548–571.
Katsiampa, P., Corbet, S., & Lucey, B. (2019). Volatility spillover effects in leading cryptocurrencies: A BEKK-MGARCH analysis. Finance Research Letters, Vol. 29, p. 68–74. https://doi.org/10.1016/j.frl.2019.03.009
Kotsiantis, S., & Kanellopoulos, D. (2006). Association rules mining: A recent overview. GESTS International Transactions on Computer Science and Engineering, Vol. 32, Issue 1.
Lawson, R. G., & Jurs, P. C. (1990). New index for clustering tendency and its application to chemical problems. Journal of Chemical Information and Computer Sciences, Vol. 30, Issue 1, p. 36–41.
Li, X., Li, S., & Xu, C. (2020). Price clustering in Bitcoin market—An extension. Finance Research Letters, Vol. 32. https://doi.org/10.1016/j.frl.2018.12.020
Liu, F., & Deng, Y. (2021). Determine the number of unknown targets in open world based on Elbow Method. IEEE Transactions on Fuzzy Systems, Vol. 29, Issue 5, p. 986–995. https://doi.org/10.1109/TFUZZ.2020.2966182
Lv, X., Zhong, Y., & Tan, Q. (2020). A study of Bitcoin de-anonymization: Graph and multidimensional data analysis. 2020 IEEE Fifth International Conference on Data Science in Cyberspace (DSC), p. 339–345. https://doi.org/10.1109/DSC50466.2020.00059
Melki, A., & Nefzi, N. (2022). Tracking safe haven properties of cryptocurrencies during the COVID-19 pandemic: A smooth transition approach. Finance Research Letters, Vol. 46. https://doi.org/10.1016/j.frl.2021.102243
Mokni, K., Youssef, M., & Ajmi, A. N. (2022). COVID-19 pandemic and economic policy uncertainty: The first test on the hedging and safe haven properties of cryptocurrencies. Research in International Business and Finance, Vol. 60. https://doi.org/10.1016/j.ribaf.2021.101573
Nakamoto, S. (2008). Bitcoin: A peer-to-peer electronic cash system. Decentralized Business Review, 21260.
Quiroga-Garcia, R., Pariente-Martinez, N., & Arenas-Parra, M. (2022). Evidence for round number effects in cryptocurrencies prices. Finance Research Letters, Vol. 47. https://doi.org/10.1016/j.frl.2022.102811
Reddy Edla, D., Gondlekar, V., & Gauns, V. (2016). HK-means: A heuristic approach to initialize and estimate the number of clusters in biological data. Acta Physica Polonica A, Vol. 130, Issue 1, p. 78–82.
Sadeqi, H. (2022). A second-order hierarchical clustering of cryptocurrencies. Iranian Journal of Management Studies, Vol. 15, Issue 3, p. 569–593.
Sensoy, A., Silva, T. C., Corbet, S., & Tabak, B. M. (2021). High-frequency return and volatility spillovers among cryptocurrencies. Applied Economics, Vol. 53, Issue 37, p. 4310–4328.
Shi, Y., Tiwari, A. K., Gozgor, G., & Lu, Z. (2020). Correlations among cryptocurrencies: Evidence from multivariate factor stochastic volatility model. Research in International Business and Finance, Vol. 53. https://doi.org/10.1016/j.ribaf.2020.101231
Shi, Z., Wu, Z., Leake, D., & Sattler, U. (2014). Intelligent Information Processing VII - 8th IFIP TC 12 International Conference, IIP 2014. In {IFIP} Advances in Information and Communication Technology (Vol. 432). ({IFIP} Advances in Information and Communication Technology). Springer Nature. https://doi.org/10.1007/978-3-662-44980-6
Siahaan, A. P. U., Ikhwan, A., & Aryza, S. (2018). A novelty of data mining for promoting education based on FP-growth algorithm, Vol. 9, Issue 7, p. 1660-1669. https://doi.org/10.31227/osf.io/jpsfa
Song, J. Y., Chang, W., & Song, J. W. (2019). Cluster analysis on the structure of the cryptocurrency market via Bitcoin–Ethereum filtering. Physica A: Statistical Mechanics and Its Applications, Vol. 527.
Stosic, D., Stosic, D., Ludermir, T. B., & Stosic, T. (2018). Collective behavior of cryptocurrency price changes. Physica A: Statistical Mechanics and Its Applications, Vol. 507, p. 499–509.
Tan, R., Tan, Q., Zhang, P., & Li, Z. (2021). Graph neural network for ethereum fraud detection. 2021 IEEE International Conference on Big Knowledge (ICBK), p. 78–85.
Urquhart, A. (2017). Price clustering in Bitcoin. Economics Letters, Vol. 159, p. 145–148. https://doi.org/10.1016/j.econlet.2017.07.035
Urquhart, A., & Zhang, H. (2019). Is Bitcoin a hedge or safe haven for currencies? An intraday analysis. International Review of Financial Analysis, Vol. 63, p. 49–57.
Xu, R., & Wunsch, D. (2005). Survey of clustering algorithms. IEEE Transactions on Neural Networks, Vol. 16, Issue 3, p. 645–678. https://doi.org/10.1109/TNN.2005.845141
Yılmaz, M., Dağ, O., & Kocabıyık, T. (2020). Cluster of cryptocurrencies in the light of current developments. Turkish Studies-Economics, Finance, Politics, Vol. 15, Issue 3, p. 1753–1773.
Zhang, W., Liao, H., & Zhao, N. (2008). Research on the FP growth algorithm about association rule mining. 2008 International Seminar on Business and Information Management, Vol. 1, p. 315–318.
Zięba, D., Kokoszczyński, R., & Śledziewska, K. (2019). Shock transmission in the cryptocurrency market. Is Bitcoin the most influential? International Review of Financial Analysis, Vol. 64, p. 102–125.