Ekonomika ISSN 1392-1258 eISSN 2424-6166
2026, vol. 105(1), pp. 123–139 DOI: https://doi.org/10.15388/Ekon.2026.105.1.8
Dekkiche Djamal
Oran Graduate School of Economics, Oran, Algeria
E-mail: djamal.dekkiche@ese-oran.dz
ORCID ID: https://orcid.org/0009-0009-9092-5974
Laila Oulad Brahim
Ghardaia University of Economics, Ghardaia, Algeria
E-mail: ouladbrahim.laila@univ-ghardaia.dz
ORCID ID: https://orcid.org/0009-0008-6259-4840
Lazhari Zouaouid
University of Ghardaia, Algeria
E-mail: zouaouid.lazhari@univ-ghardaia.edu.dz
ORCID ID: https://orcid.org/0000-0001-5264-2716
Abstract. This paper examines the asymmetric effects of oil price variations on MENA inflation from 1990 to 2021. Short- and long-term impacts were estimated by using Panel-NARDL models. To account for asymmetric effects, the price of oil was separated into positive and negative changes (oil+ and oil-), along with money mass, imports, and GDP. The study found that long-term and short-term oil price variations (oil+ and oil-) affect inflation differently. Favorable oil prices affect inflation more than negative ones in the short term. Oil prices have a bigger negative influence than a positive impact over time. The study also indicated that imports boost inflation faster than the monetary mass in the short and long term. This shows that imports transmit inflation to MENA countries more than monetary mass, requiring urgent government intervention to reduce imports or bills and not import products or locally manufactured and produced materials, especially raw materials.
The study suggested activating nonhydrocarbon exports and expanding other productive sectors like agriculture and industry to diversify the economy (especially in oil-exporting countries like Algeria, Saudi Arabia, and Libya), maintaining money supply stability through the central bank’s monitoring of money supply, and encouraging local products along with import substitution policies.
Keywords: imports, money supply, inflation transmission channel, GDP.
_________
Received: 22/01/2025. Accepted: 30/01/2026
Copyright © 2026 Dekkiche Djamal, Laila Oulad Brahim, Lazhari Zouaouid. Published by Vilnius University Press
This is an Open Access article distributed under the terms of the Creative Commons Attribution License, which permits unrestricted use, distribution, and reproduction in any medium, provided the original author and source are credited.
Oil fuels quite a few nations and powers the global economy. Many developing countries control this resource and rely on oil exports; therefore, price hikes help them fill their budget. Falling worldwide prices make them sensitive to economic shocks. Oil prices strongly impact inflation.
Research about oil price effects on inflation in Middle Eastern and North African (MENA) countries has gained more attention in recent economic literature because multiple studies investigate how oil price changes differently affect inflation across countries with varying oil dependence levels. Research by (Ben Senouci & Sahad, 2024) analyzed the impact of oil price changes on Algerian inflation through the NARDL model which revealed that natural gas price fluctuations create asymmetric inflation effects in both short-term and long-term periods while oil price changes only affect inflation asymmetrically in the long term through higher prices that result in decreased inflation rates.
In 2021, Sihem and Mourad (2021) examined how oil price fluctuations affect Algerian inflation and economic growth by using the same model. Positive oil price changes increase inflation more than negative ones. Hannachi and Iktissadia (2023) discovered that short-and long-term positive oil price swings increase Algerian inflation more than negative price swings.
In another study (Elhassan et al., 2021), the NARDL model explored how oil price volatility influences Saudi economic development. Positive oil price shocks influenced more than negative ones. (Darwez et al., 2023) explored how oil price shocks impact energy costs and agricultural commodity prices in Saudi Arabia.
Recent research suggests that oil price and MENA inflation analysis should use non-linear models like NARDL. The economic implications of this advanced model, supporting the need to examine oil effects on MENA inflation, are numerous.
MENA produces much oil, especially Saudi Arabia, which ranks second behind the US. The MENA region exported 38.4% of global oil.
In the 1970s, rising oil and inflation harmed the global economy. Oil prices declined and inflation fell in the 1980s, forcing us to study the relationship between oil prices and inflation in Saudi Arabia, Algeria, and Libya.
Many studies address the asymmetrical impact of oil price fluctuations on inflation, but they are based on specific countries or even on a group of oil-exporting countries. However, there are very few studies that address this subject in the Middle East and North Africa region, and if any, they rely on different standard approaches than what we are about to use, which is the panel NARDL model; therefore, 1 presents the most important previous studies that dealt with the subject:
Numerous studies have thoroughly explored the connection between changes in oil prices and inflation, focusing more on the idea that this relationship may not be symmetrical. Many studies have utilized linear autoregressive staggered delay (NARDL) models to investigate the effects of asymmetry on transmission.
South Africa, which imports oil and is vulnerable to foreign shocks, is asymmetrically affected by oil prices on inflation (Khobai et al., 2025). The results of NARDL, ECM, Granger causality, and variance decomposition models show that rising oil prices lower medium-term inflation, whereas falling oil prices raise it. Oil prices greatly affect inflation volatility and have a unidirectional causal relationship. The paper recommends diversifying oil import sources to improve energy security and reduce price and supply shocks.
Using the NARDL technique, (Komijani & Haji Heidari, 2024) examines the asymmetric effects of oil price shocks, uncertainty, and economic sanctions on Iranian economic growth and inflation between 1979 and 2019. Results show that positive oil price shocks lower inflation and negative shocks raise it. Economic sanctions, trade liberalisation, and government spending enhance inflation, while price uncertainty and GDP lower it. The Wald test shows that oil price shocks affect growth and inflation asymmetrically in the short and long term.
Ikue (2024) uses nonlinear ARDL (NARDL) to study the asymmetric impacts of retail energy prices on inflation in Nigeria from 2010 to 2024. The findings show that rising fuel prices, especially food prices, cause inflation, whereas price cuts have little effect. Reassessing fuel subsidies to avoid price shocks, creating an Energy Price Stabilisation Fund to support food prices, regulating exchange rates to reduce import volatility, and improving inflation monitoring systems to aid government interventions are recommended by the study.
Nasir et al. (2020) explored how oil shocks influenced inflation expectations in countries that import or export oil, by focusing on Scandinavia (Norway, Sweden, and Denmark). Their findings indicate that the effects of oil shocks differed between Norway, an oil exporter, and Sweden and Denmark, where the impact was more uniform.
Similarly, (Li & Guo, 2022) investigated how oil prices and shocks affect inflation differently in BRICS countries through a panel NARDL model. Their findings suggest that notable imbalances between oil prices and inflation exist primarily in China over the term, where inflation tends to increase when oil prices decrease. Moreover, distinct asymmetries are evident for supply shocks in South Africa over the term as well as in Russia and China over the short term.
Their research on India (Abu-Bakar & Masih, 2018) discovered one impact of oil price changes on local inflation through NARDL modelling. Their findings indicate that local prices increase as global oil prices rise. There is a connection between local prices and decreasing global oil prices.
Shaobo Long & Jun Liang (2018) explored how fluctuating world crude oil prices influence China’s Producer Price Index (PPI) and Consumer Price Index (CPI) linearly and unevenly. The research findings revealed that the effects of oil price changes on China’s PPI and CPI are not uniform, showing an impact over an extended period.
Arintoko et al. (2024) tried to search for asymmetric effects of global energy, food prices, and exchange rates and offered cash on the Consumer Prices Index (CPI) by using data from 2001 to 2023 and the NARDL slope application. Throughout this study, the researcher concluded that low global energy prices reduce the consumer price index in the long run. Increased global food prices cause inflation in the short term. The exchange rate strongly affects the consumer price index (Husaini & Lean, 2021).
A study by Ayisi (2021) and (Bawa et al., 2020) examined the impact of oil price fluctuations on inflation and welfare outcomes in Ghana by using the NARDL model.
In their studies, Alimia et al. (2020) and Kun Sek (2019) employed NARDL methodologies to demonstrate the presence of enduring linear connections and uneven impacts of oil prices on inflation in Nigeria and a group of countries that either export or import oil.
Based on the research presented, most studies focus on analysing how changes in oil prices impact inflation within a country by using the NARDL model. Some studies explore this relationship at the level of oil exporters and non-oil countries. However, research on this topic persists in the Middle East and North Africa despite its significant global economic and geographical importance.
The main contribution of this study is to analyze how oil prices affect MENA inflation, as earlier studies primarily focused on one nation. These studies are useful; however, MENA has varied land oil addiction, economic architectures, and monetary policy frameworks. This study evaluates the influence of oil value in many regional countries by using a non-lecture dynamic panel model (Panel-NARDL) to capture the asymmetrical effects of oil value swings. Research on how import costs and other oil price fluctuations affect inflation was implemented, and it was discovered that oil price fluctuations affect food prices in some regional countries. This study examines these intervals in pursuit to better understand the intricate relationship between oil prices and inflation in MENA countries and provides political advice to stabilise the region.
The research examines the effects of oil price fluctuations on inflation rates in MENA countries by using specific economic indicators. The chosen indicators measure essential economic factors directly affecting regional economies, thereby allowing researchers to assess oil price effects on inflation.
Oil price analysis relies on inflation as a significant economic price level indicator. Oil price variations affect economies through inflation (Choi et al., 2018). Oil prices influence MENA economies, which depend on oil earnings, making them the strongest indicator of energy price variations. (Hamilton et al., 2011) found that oil prices affect macroeconomic indicators in oil-exporting nations.
GDP is the leading indicator of economic performance and inflation; hence, the analysis evaluates oil price fluctuations on economic expansion. GDP changes affect inflation by affecting the market supply and demand, as stated by (Narayan & Gupta, 2015). Oil prices immediately impact imported commodities and energy expenses, raising import prices. Chen et al. (2017) observed that oil prices affect developing economies’ import costs and inflation. The third indicator is money supply changes and the monetary policy’s inflation impact. As per (Ghosh et al., 2016), studying oil price shock inflation using the money supply is the background of research.
The PANEL-NARDL model was used to examine the asymmetric relationships between these variables since it detects both short-term and long-term effects of oil price changes on inflation while accounting for national oil reliance and economic systems. (Shahbaz et al., 2015) examined economic variable asymmetry across nations using the model.
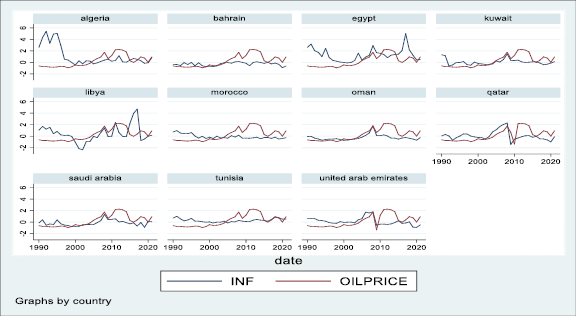
Annual data from 1990 to 2021 will be used for each of the inflation rates INF (dependent variable) and each of GDP, imports M, money masses M2 and oil prices, and (Perspective Monde, 2021), (World Bank, 2021) on (Gasoline - Price - Chart - Historical Data - News, 2021) and so on. Descriptive Analysis of Model Variables
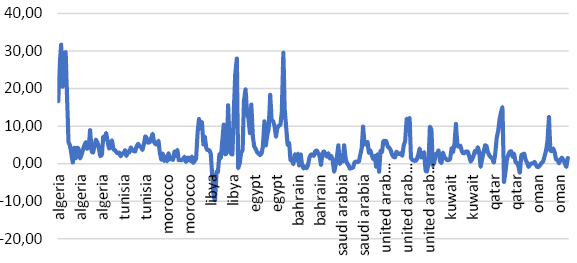
The kurtosis coefficient and Jarque-Bera probability estimate the normal distribution and statistically characterize variable trends in descriptive analysis. In Table 1, inflation, oil price, GDP, money mass, and imports of MENA countries are listed. There are a few things to be noted: district recorded: MENA inflation averages 0.23. Egypt experienced 1.32 units of inflation, compared to Algeria 1.07 (Figure 1). The highest MENA inflation rate is in Oman.
|
VAR |
ALG |
TUN |
MOR |
LIBY |
EGYP |
BAHR |
SAUD |
EAU |
KUW |
QATR |
OMAN |
FULL |
|
|
MEAN |
INF |
1.07 |
0.28 |
-0.07 |
0.44 |
1.32 |
-0.28 |
-0.15 |
0.11 |
0.06 |
0.06 |
-0.24 |
0.23 |
|
OIL |
0.22 |
0.22 |
0.22 |
0.22 |
0.22 |
0.22 |
0.22 |
0.22 |
0.22 |
0.22 |
0.22 |
0.21 |
|
|
GDP |
0.39 |
-0.15 |
0.11 |
-0.082 |
0.74 |
-0.24 |
2.39 |
1.00 |
0.15 |
0.10 |
-0.11 |
0.39 |
|
|
M2 |
-0.15 |
-0.24 |
1.07 |
0.25 |
0.85 |
0.27 |
-0.45 |
-0.37 |
0.88 |
-0.04 |
-1.13 |
0.095 |
|
|
M |
0.16 |
-0.05 |
0.16 |
-0.15 |
0.32 |
-0.17 |
1.22 |
2.07 |
0.005 |
-0.057 |
-0.62 |
0.31 |
|
|
STD. DEV |
INF |
1.71 |
0.29 |
0.38 |
1.48 |
1.10 |
0.29 |
0.48 |
0.64 |
0.49 |
0.79 |
0.48 |
0.99 |
|
OIL |
1.01 |
1.01 |
1.01 |
1.01 |
1.01 |
1.01 |
1.01 |
1.01 |
1.01 |
1.01 |
1.01 |
1.00 |
|
|
GDP |
0.41 |
0.08 |
0.22 |
0.12 |
0.76 |
0.08 |
1.76 |
0.94 |
0.36 |
0.49 |
0.17 |
0.76 |
|
|
M2 |
0.77 |
0.37 |
1.15 |
1.36 |
0.32 |
0.32 |
0.37 |
1.02 |
1.06 |
0.84 |
0.29 |
1.02 |
|
|
M |
0.33 |
0.13 |
0.32 |
0.11 |
0.45 |
0.07 |
1.04 |
2.08 |
0.20 |
0.23 |
0.18 |
0.99 |
|
|
MIN |
INF |
-0.45 |
-0.15 |
-0.48 |
-2.35 |
-0.098 |
-0.93 |
-0.91 |
-0.91 |
0.63 |
-1.43 |
-0.70 |
-2.35 |
|
OIL |
-0.94 |
-0.94 |
-0.94 |
-0.94 |
-0.94 |
-0.94 |
-0.94 |
-0.94 |
-0.94 |
-0.94 |
-0.94 |
-0.94 |
|
|
GDP |
-0.08 |
-0.28 |
-0.16 |
-0.23 |
-0.11 |
-0.34 |
0.42 |
-0.37 |
-0.29 |
-0.36 |
-0.29 |
-0.36 |
|
|
M2 |
-2.54 |
-0.77 |
0.68 |
-1.58 |
0.27 |
-0.20 |
-0.82 |
-2.54 |
-0.36 |
-2.54 |
-1.49 |
-2.54 |
|
|
M |
-0.18 |
-0.23 |
-0.20 |
-0.26 |
-0.18 |
-0.26 |
0.10 |
-0.33 |
-0.25 |
-0.33 |
-0.27 |
-0.33 |
|
|
MAX |
INF |
5.39 |
1.00 |
0.97 |
4.71 |
4.99 |
0.13 |
1.32 |
1.76 |
1.45 |
2.29 |
1.79 |
1.32 |
|
OIL |
2.24 |
2.24 |
2.24 |
2.24 |
2.24 |
2.24 |
2.24 |
2.24 |
2.24 |
2.24 |
2.24 |
2.24 |
|
|
GDP |
1.07 |
-0.04 |
0.52 |
0.22 |
2.35 |
-0.10 |
5.25 |
2.48 |
0.80 |
1.02 |
0.17 |
5.25 |
|
|
M2 |
1.35 |
0.60 |
2.96 |
4.38 |
1.42 |
0.93 |
0.47 |
1.99 |
5.23 |
2.06 |
-0.38 |
5.23 |
|
|
M |
0.76 |
0.13 |
0.75 |
0.17 |
1.01 |
-0.05 |
2.92 |
5.63 |
0.33 |
0.27 |
0.30 |
5.63 |
|
|
OBS |
32 |
32 |
32 |
32 |
32 |
32 |
32 |
32 |
32 |
32 |
32 |
N=352 |
|
|
32 |
32 |
32 |
32 |
32 |
32 |
||||||||
|
n=11 |
T=32 |
Source: Authors’ computation by using Stata 15 software
The average oil price among the countries of concern was 0.21 units. Libya recorded the lowest inflation rate in 2002, at -9.80%, while Algeria recorded the highest, at 31.67%, in 1992, following the security crisis and Algeria’s resort to the IMF to borrow against the high public debt rate and the scarcity of consumables.
Source: (World Bank, 2022)
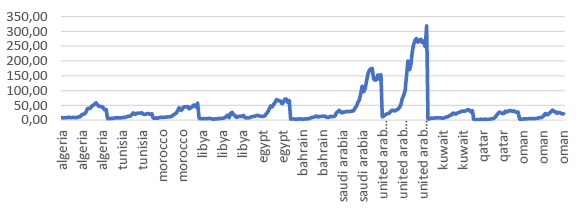
The study test averaged 0.39 units, with Saudi Arabia having the highest GDP, followed by the UAE and Egypt, then, followed by Tunisia and Libya. As of 2021, Saudi Arabia had the greatest GDP in MENA at $833.54 billion.
The world’s highest oil price was $109.45 a barrel in 2012. This surge occurred due to regional factors like Iran limiting production and restricting Hormuz rights. The 1998 low oil price was $12.28 per barrel due to the Asian financial crisis, overproduction by OPEC and non-OPEC countries, mild winter demand, and increased Iraqi oil supplies. Poor OPEC cooperation delayed treatment and eliminated the problem. Production cuts in 1999 balanced the market and hardened the prices.
Source: (World Bank, 2022)
The results of the correlation matrix shown in Table 2 indicate that the variables are unrelated; therefore, there is no problem with multicollinearity between the variables, and these results help us conduct the remaining tests, which are usually free of any correlation problems.
|
|
|
LNINF |
LNGDP |
LNM |
LNM2 |
LNOILPRICE |
|
LNINF |
|
1.0000 |
|
|
|
|
|
LNGDP |
Value |
0.0432 |
1.0000 |
|||
|
P-Value |
0.0432 |
|
|
|
|
|
|
LNM |
Value |
-0.0296 |
0.9099* |
1.0000 |
||
|
P-Value |
0.6018 |
0.0000 |
|
|
|
|
|
LNM2 |
Value |
0.0269 |
0.1824* |
0.2572* |
1.0000 |
|
|
P-Value |
0.6459 |
0.0009 |
0.0000 |
|
|
|
|
LNOILPRICE |
Value |
0.0291 |
0.5480* |
0.6204* |
0.2512* |
1.0000 |
|
P-Value |
0.6081 |
0.0000 |
0.0000 |
0.0000 |
|
Source: Authors’ computation by using Stata 15 software
The correlation matrix showed that inflation (lninf) had weak and non-significant associations with all other economic indicators because all correlation coefficients were below 0.04 and p-values surpassed 0.05. However, GDP (lngdp) and imports (lnm) had robust correlations (0.91), as did money supply and oil price (0.62), indicating clear economic interactions between these variables. Other pairs, including GDP, oil price, and money supply, also have medium to weak but significant connections. The economic association between economic activity, imports, and oil prices is significant, but these variables do not directly affect inflation in this sample.
We recommend the Panel ARDL model for short- and long-term relationships, especially for variables with mixed integration orders (I (0) and I (1)). Unlike previous models, it can contain stationary and non-stationary variables without pre-differencing. Its Error Correction Mechanism (ECM) assesses the velocity of adjustment towards long-term equilibrium, explaining how economic factors correct short-term inequalities. It excels in cointegration analysis on small and large datasets. Mean Group (MG), Pooled Mean Group (PMG), and Dynamic Fixed Effects (DFE) estimation approaches can capture short-run dynamics across cross-sections. For panel data analysis, panel ARDL is best for dynamic relationships, mixed integration orders, short-run corrections, and long-run equilibrium.
Oil-price-based inflation reactions are possible with ARDL panel data. It is doubtful that negative oil price swings would affect inflation. Therefore, the amended model, after adding the logarithm to account for this imbalance, is rewritten as given below:
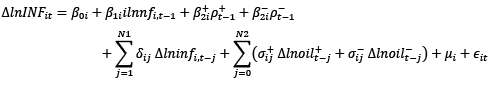
Where:
|
Parameters |
Definition |
|
infit |
Inflation rate per country i over a period of time t |
|
pt |
represents oil prices during period t |
|
μi |
group-specific effect |
|
i |
The group of sample countries |
|
t |
represents the period of study |
|
|
Represents positive and negative oil price fluctuations, respectively |
The error correction coefficient is expressed as follows:
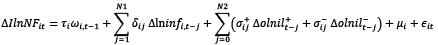
ωi,t–1 is the long-term error correction coefficient.
Source: (Interest Rates - IMF Data, n.d.), (World Bank, 2022)
Assessing cross-sectional dependence (CSD) is crucial to choosing a suitable unit root test for panel data. First-generation tests (LLC, IPS, Fisher-ADF) presume independence, but second-generation tests (CADF, CIPS) incorporate dependence. CSD tests, such as Pesaran’s and Frees’, inform this selection, guaranteeing a dependable study.
|
xtreg inf pib m m2 tcr oilprice, fe |
|||||
|
Fixed effects (within) regression |
Number of obs = 329 |
||||
|
Group variable: i |
Number of groups = 11 |
||||
|
within = 0.1804 |
min = 26 |
||||
|
between = 0.2832 |
avg =29.9 |
||||
|
overall = 0.0080 |
max = 31 |
||||
|
F(5,313) = 13.78 |
Prob > F = 0.0000 |
||||
|
corr(u_i, Xb) = -0.8520 |
|
|
|||
|
INF |
Coeff |
Std.Error |
t |
P-Value |
|
|
Pib |
0.0048 |
0 .0050 |
0.96 |
0.339 |
|
|
m |
-0.0211 |
0 .0122 |
-1.73 |
0.085 |
|
|
m2 |
0.0165 |
0 .0143 |
1.15 |
0.250 |
|
|
tcr |
-0.2259 |
0.0278 |
-8.11 |
0.000 |
|
|
oilprice |
0.01757 |
0.0100 |
1.75 |
0.081 |
|
|
constant |
4.59805 |
0.9570 |
4.80 |
0.000 |
|
|
F test that all u_i=0: F(10, 313) = 18.18 |
Prob > F = 0.000 |
||||
|
xtcsd, pesaran abs |
|||||
|
Pesaran’s test of cross-sectional independence = 10.572 |
Pr = 0.0000 |
||||
|
Average absolute value of the off-diagonal elements = 0.314 |
|||||
|
xtcsd, pesaran |
|||||
|
Pesaran’s test of cross-sectional independence = 10.572 |
Pr = 0.0000 |
||||
|
xtcsd, frees |
|||||
|
Frees’ test of cross-sectional independence = 0.948 |
|||||
|
alpha = 0.10 |
0.1035 |
||||
|
alpha = 0.05 |
0.1350 |
||||
|
alpha = 0.01 |
0.1947 |
|
|||
Source: Authors’ computation by using Stata 15 software
Unit root tests use CSD findings; see Table 3. First-generation tests (LLC, IPS, Fisher-ADF) are unsuitable if the p-value is < 0.05, indicating cross-sectional dependence. CADF and CIPS are second-generation tests. If p>0.05, first-generation testing can be employed to rule out cross-sectional dependence.
Pesaran’s CSD test (statistic = 10.572, p-value = 0.0000) reveals cross-sectional dependence, making first-generation unit root testing inappropriate. For stationarity assessment, Table 5 proposes second-generation CADF and CIPS tests like Pesaran’s CIPS (xtcips). Non-stationarity requires differencing and retesting.
The Frees’ test statistic (0.948) is above the criterion (0.1947 at α = 0.01), showing considerable cross-sectional dependence. Second-generation unit root tests like CADF and CIPS are better for stationarity.
In this section, panel unit root tests will be used to analyze the variable’s time-related properties. LNINF, LNGDP, LNM2, and LNOILPRICE are non-stationary because their Z [T-Bar] statistics and P values exceed significant limits, according to the CADF test (Table 4). LNM remains stationary with T-Bar readings below 5% and 10%. LNM is stationary; however, most variables need to be stationary.
The first difference, CADF test reveals that DLninf, D.LNM, and DLNM2 are stationary with high z [T-Bar] statistics and low P values. DLNGDP is stationary at 10% but not at high thresholds, while DLOILPRICE is stationary with a p-value of <0.05.
CIPS* values under critical values indicate LNINF and LNM stability. LNGDP, LNM2, and LNOLPRICE are not stationary, with LNOLPRICE having positive CIPS* results.
The first difference: DLninf, d.lngdp. The CIPS* Statistical indicates that D.LnOILPRICE is stationary. All variables in (1) except for LNM, stationary wood (0), have stationary imports.
|
LEVEL FORM |
||||||
|
|
CIPS |
CADF |
||||
|
CIPS |
P-value |
IMPL |
Z[t-bar] |
P-value |
IMPL |
|
|
LNINF |
-4.578 |
-2.84 |
Stationary |
0.074 |
0.530 |
Non-stationary |
|
LNOIL |
1.700 |
-2.84 |
Non-stationary |
15.454 |
0.080 |
Non-stationary |
|
LNM2 |
-2.353 |
-2.84 |
Non-stationary |
1.621 |
0.948 |
Non-stationary |
|
LNM |
-3.368 |
-2.84 |
Stationary |
-2.129 |
0.017 |
Stationary |
|
LNGDP |
-2.528 |
-2.84 |
Non-stationary |
1.774 |
0.962 |
Non-stationary |
|
DIFFERENCE FORM |
||||||
|
LNINF |
-6.273 |
-2.84 |
Stationary |
-2.683 |
0.004*** |
Stationary |
|
LNOIL |
3.700 |
-2.84 |
Stationary |
15.454 |
0.032 |
Stationary |
|
LNM2 |
-5.055 |
-2.86 |
Stationary |
-2.937 |
0.002*** |
Stationary |
|
LNM |
-5.629 |
-2.84 |
Stationary |
-5.761 |
0.000*** |
Stationary |
|
LNGDP |
-4.870 |
-2.84 |
Stationary |
-1.443 |
0.075 |
Stationary |
Source: Authors’ computation by using Stata 15 software
We identified no second-degree stationary time series following unit root tests (Table 4). Thus, MG, PMG, and DFE will estimate the panel-ARDL model for dynamic panel data. Long-term, short-term, and long-term balancing adjustment speed characteristics are used. Before that, Table 5 displays the panel-ARDL model’s ideal slowness periods:
|
|
lnINF |
lnOILPRICE |
lnM2 |
lnGDP |
lnM |
|
ALGERIA |
2 |
2 |
0 |
2 |
1 |
|
TUNISIA |
1 |
0 |
0 |
0 |
0 |
|
MOROCCO |
2 |
0 |
2 |
0 |
1 |
|
LIBYA |
2 |
2 |
2 |
2 |
2 |
|
EGYPT |
2 |
0 |
0 |
1 |
0 |
|
BAHRAIN |
2 |
0 |
1 |
0 |
0 |
|
SAUDI AR |
2 |
0 |
0 |
1 |
2 |
|
UAE |
2 |
2 |
2 |
1 |
0 |
|
KUWAIT |
2 |
0 |
0 |
1 |
0 |
|
QATAR |
2 |
0 |
1 |
0 |
0 |
|
OMAN |
2 |
0 |
2 |
0 |
1 |
|
MIN LAGs |
1 |
0 |
0 |
0 |
0 |
Source: Authors’ computation by using Stata 15 software
According to the results of Table 5, the lowest values of the slowdown period for the variables inflation rate, oil price, money mass, GDP, and imports are 0.0.0.0.0.1, respectively; therefore, the dependent variable represented in the inflation rate is the one that is slowed down by one period Lag(1) only, while the rest of the variables are at the level
The panel cointegration test (Westerlund, 2007) assesses long-term relationships between variables by using four statistics: Gτ, Gα, Pτ, and Pα. The Gτ and Gα statistics examine cointegration within individual cross-sectional units, while the Pτ and Pα statistics analyze it over the entire panel by aggregating data. p-values are interpreted according to significance testing guidelines. Table 6 shows a p-value of 0.0310, rejecting the null hypothesis (H₀) of no cointegration and indicating cointegration among the variables.
|
Westerlund test for cointegration |
||
|
Ho: No cointegration |
Number of panels = 11 |
|
|
Ha: Some panels are cointegrated. |
Avg. number of periods = 26.727 |
|
|
Cointegrating vector: Panel-specific |
||
|
Panel means: Included. |
||
|
Time trend: Not included |
||
|
AR parameter: Panel-specific |
|
|
|
|
Statistic |
p-value |
|
Variance ratio |
-1.8670 |
0.0310 |
Source: Authors’ computation by using Stata 15 software
|
|
MG |
PMG |
DFE |
|||||
|
COEFF |
Std-error |
p-value |
COEFF |
Std-error |
p-value |
COEFF |
Std-error |
|
|
Long Run |
||||||||
|
lnM2 |
0.8282247 |
4.049151 |
0.838 |
-0.7619842 |
0.2881342 |
0.008 |
-0.209599 |
0.6718731 |
|
lnM |
4.830932 |
3.983912 |
0.225 |
-0.2658056 |
0.2871131 |
0.355 |
-0.0722937 |
0.6788457 |
|
lnGDP |
-7.729918 |
6.387435 |
0.226 |
1.99644 |
0.2290058 |
0.000 |
-0.5296679 |
0.5833719 |
|
lnOIL+ |
1.686425 |
2.065026 |
0.414 |
-0.668547 |
0.2611446 |
0.010 |
0.7255179 |
0.3567177 |
|
lnOIL- |
1.417948 |
1.427471 |
0.321 |
0.2866988 |
0.2355896 |
0.224 |
0.8018595 |
0.4306822 |
|
Short Run |
||||||||
|
ECT |
-0.7843528 |
0.0929127 |
0.000 |
-0.5219105 |
0.1645531 |
0.002 |
-0.4563921 |
0.0548557 |
|
D.lnM2 |
-0.4685632 |
0.7515918 |
0.533 |
-0.1124366 |
0.4270446 |
0.792 |
-0.0312391 |
0.5127755 |
|
D.lnM |
-0.929718 |
0.8799733 |
0.291 |
0.4793439 |
0.4096073 |
0.242 |
0.0655722 |
0.3613845 |
|
D.lnGDP |
0.1900159 |
1.815532 |
0.917 |
-0.5977205 |
1.008914 |
0.554 |
0.0617092 |
0.4246472 |
|
D.lnOIL+ |
0.5546061 |
1.055259 |
0.599 |
0.3020808 |
0.5598402 |
0.589 |
0.0757334 |
0.3989755 |
|
D.lnOIL- |
0.6351823 |
1.05739 |
0.548 |
0.0586099 |
0.3853986 |
0.879 |
-0.0518454 |
0.3762656 |
|
C |
12.2109 |
14.42455 |
0.397 |
-0.7689731 |
0.3251532 |
0.018 |
1.876251 |
1.450545 |
|
OBS |
269 |
269 |
269 |
|||||
|
HAUSMAN test |
||||||||
|
PMG |
MG |
Prob>chi2 |
0.0001 |
MG is efficient |
||||
|
PMG |
DFE |
Prob>chi2 |
0.0000 |
DFE is efficient |
||||
|
MG |
DFE |
Prob>chi2 |
0.0000 |
DFE is efficient |
|
|||
|
Wald test for asymmetric effect |
||||||||
|
F (1, 278) |
6.99 |
|||||||
|
Prob > F |
0.0087 |
|
||||||
Source: Authors’ computation by using Stata 15 software
Let us compare Table 7’s panel-Ardl nonlinear dynamic panel model estimation results.
Positive and negative oil price changes (oil+ and oil-) affect inflation differently over time (Figure 3). PMG estimators show that positive oil price changes affect inflation more than negative changes in the short term (0.30>0.058) (Choi et al., 2018), but, in the long run, lowering of oil prices has a greater negative impact on inflation. These findings support the statements by (Moussa et al., 2024). Positive and negative oil price changes affect inflation over time, with positive changes having a greater impact. These findings are consistent with research on oil price volatility and Saharan African inflation.
The supply money coefficient, lnM2, boosted MG inflation over time. This shows that the money mass increases inflation, which is consistent with the quantitative theory of money, which stipulates that MV=PY (Kugler & Reynard, 2022) and (Madurapperuma, 2023).
The short-term lnGDP coefficient showed a negative PMG signal, showing that rising GDP lowers prices and lowers inflation.
The PMG method showed that high oil+ prices lead to low long-term inflation, especially for countries that export hydrocarbons (Algeria, Libya, Saudi Arabia, Kuwait), because they increase state revenues, especially from hard currency, which leads to price support and lower prices. High foreign prices would raise inflation (PMG, DFE findings) (Salisu et al., 2017) (Kelikume, 2017) (Lacheheb & Sirag, 2019).
In the long run, the three approaches (MG, PMG, DFE) boost inflation by 0.28 units as oil prices fall, especially for oil-exporting countries like Algeria and Saudi Arabia, which depend on their treasuries for oil prices.
The short-term results of Table 7 show that the error correction coefficient is negative and significant at 0.05, indicating that a mechanism exists to correct the error from the short-term to the long-term by 0.52 (52%) units, which is higher than the percentage reached in (Kun Sek, 2019) for oil exporting and importing countries, which was estimated at 19.19%.
The supply money coefficient is negative for all three methods because increasing the supply of money by one unit decreases inflation by 0.11 units (PMG), and increasing imports by one unit increases inflation by 0.47 units.
PMG supports the idea that rising GDP reduces inflation in the short term. Logically, a one-unit GDP rise reduced inflation by 0.59 units.
The short-term results showed that an increase in oil prices, plus employing the three approaches (MG, PMG, DFE), increased inflation. While a fall in oil prices and the use of both MG and PMG increased inflation (López-Villavicencio & Pourroy, 2019), a one-unit decrease in oil prices increased inflation by 0.058 units, which is consistent with (Salisu et al., 2017).
The asymmetric impact of oil price volatility on inflation was examined in MENA nations. The results indicated that inflation responses to fluctuations in oil prices vary by country and size, exhibiting asymmetrical characteristics. Elevated oil prices exerted a more significant impact than diminished prices. The disparity is driven by variations in national economies, dependence on oil exports, and monetary and fiscal policy.
Although the study focuses on oil-producing and consuming countries within a typical geographical and cultural scope, it is important to place these results within the broader context by comparing them to similar trends in the European Union countries, where it is noted that the impact of oil prices on inflation is often more similar and less volatile, due to their dependence on unified monetary policies within the euro area, and their low direct dependence on oil revenues. The research conducted by (Jiménez-Rodríguez et al., 2005) demonstrates that OECD countries, including European countries, experience minimal oil price effects because they have implemented energy diversification plans and effective fiscal policies. The research conducted by (Cunado & Perez de Gracia, 2005) demonstrates that European inflation rates show minimal variation and short-term effects.
The comparison helps to better understand the structural and institutional factors that explain the differences in the inflation behavior between the two groups, and the importance of economic reforms and structural diversification in mitigating the effects of oil price shocks on MENA economies.
This study examined how oil prices affect MENA inflation. It analysed 1990–2021 time series data by using the panel NARDL model and standard tests.
The panel NARDL (PMG-not-linear) model and MENA inflation ratio were explored. Short- and long-term oil value fluctuations (oil+ and oil) were assessed for inflation. The study indicated that oil+ and oil price declines are shorter and influenced differently. Favorable oil prices affect short-term inflation. Long-term effects are more potent than good oil+ changes, according to Watts et al. (2024). Positive oil value variations may have affected inflation over time.
The study concluded that imports cause greater inflation than the money mass. This shows that MENA transmits more inflation to land than the money mass (short-term results show that imports transmit more inflation).
According to their economic structure, MENA nations have different inflation sources. Algeria’s exchange rate causes inflation, as did Saudi Arabia’s government spending and oil prices (Sek, 2022) and Egypt’s money supply (Helmy & Helmy, 2025)
The research indicates that increased oil prices heighten short-term inflation in the MENA region. Reduced expenses result in significant long-term harm. Imports elevate inflation more significantly than currency. Research indicates that enhancing local production, imports, exports, agriculture, and renewable energy investments is essential for economic diversification. It ensures financial stability and regulates funds to diminish luxury imports and promote domestic industry. Research urged oil-exporting nations to establish permanent zones and diversify their economies, utilizing oil surpluses. Regional collaboration among MENA nations was also encouraged to diminish reliance on foreign markets and enhance economic integration.
The effect of the oil price on MENA inflation must be linked to European economic situations. The MENA countries’ significant reliance on oil exports causes oil price changes to affect the European economy. MENA oil price movements raise European energy prices, especially in energy-intensive countries like Germany and the UK. Norway, a major oil producer with unique economic systems and energy regulations, and Saudi Arabia and Algeria, as MENA countries, might be compared in their oil price shock responses. The analysis shows how different economies handle oil price shocks and how their monetary and fiscal policies react. This research helps explain global oil market relationships and their effects on EU economies.
Non-linear threshold models such as NARDL can be used to capture the asymmetrical effects of oil prices on inflation in the MENA nations. Sector research can prevent the instability of the oil price from affecting many companies. The role of monetary policy politics can help identify effective political reactions. A comparative regional survey beyond MENA suggests whether the deviations were regional or global. Exchange rate instability, economic instability, and incorporation of geopolitical problems will strengthen the study. Short-term dynamics with high rates of data can be better understood, and machine learning and AI-operated models can improve predictions. Through these methods, the policy attitude will improve by improving the understanding of oil prices.
This research received no specific grant from funding agencies in the public, commercial, or not-for-profit sectors.
The authors declare that they have no known competing financial interests or personal relationships that could have appeared to influence the work reported in this paper.
The data used is from a publicly available dataset.
Abu-Bakar, M., & Masih, M. (2018). Is the oil price pass-through to domestic inflation symmetric or asymmetric? New evidence from India based on NARDL. https://mpra.ub.uni-muenchen.de/87569/
Alimi, A. S., Olaniranb, O. D., & Ayubac, T. (2020). An Asymmetric Evaluation of Oil Price- Inflation Nexus: Evidence from Nigeria. Energy Economics Letters, 7(1), 1–11. https://doi.org/10.18488/JOURNAL.82.2020.71.1.11
Arintoko, A., Kadarwati, N., & Badriah, L. S. (2024). The Asymmetric Effects of Global Energy and Food Prices, Exchange Rate Dynamics, and Monetary Policy Conduct on Inflation in Indonesia. Ekonomika, 103(2), 66–89. https://doi.org/10.15388/Ekon.2024.103.2.4
Ayisi, R. K. (2021). The asymmetry effect of oil price changes on inflation, and the welfare implication for Ghana. African Journal of Economic and Management Studies, 12(1), 55–70. https://doi.org/10.1108/AJEMS-01-2020-0009
Bawa, S., Abdullahi, I. S., Tukur, D., Barda, S. I., & Adams, Y. J. (2020). Asymmetric impact of oil price on inflation in Nigeria. CBN Journal of Applied Statistics, 11(2), 85–113. https://doi.org/10.33429/Cjas.11220.4/8
Ben Senouci, M., & Sahad, A. (2024). An econometric study of the response of money supply, imports, and the general price level to oil price shocks in Algeria during the period 1975–2021. Journal of Economic Studies, 18(1), 339–352. https://asjp.cerist.dz/en/article/243303
Choi, S., Furceri, D., Loungani, P., Mishra, S., & Poplawski-Ribeiro, M. (2018). Oil prices and inflation dynamics: Evidence from advanced and developing economies. Journal of International Money and Finance, 82, 71–96. https://doi.org/10.1016/J.JIMONFIN.2017.12.004
Cunado, J., & Perez de Gracia, F. (2005). Oil prices, economic activity and inflation: evidence for some Asian countries. The Quarterly Review of Economics and Finance, 45(1), 65–83. https://doi.org/10.1016/J.QREF.2004.02.003
Darwez, F., Alharbi, F., Ifa, A., Bayomei, S., Mostfa, E., Lutfi, A., Haya, M. A., & Alrawad, M. (2023). Assessing the Impact of Oil Price Volatility on Food Prices in Saudi Arabia: Insights From Nonlinear Autoregressive Distributed Lags (NARDL) Analysis. ECONOMICS - Innovative and Economics Research Journal, 11(2), 5–23. https://doi.org/10.2478/EOIK-2023-0056
Domínguez, M. A., & Lobato, I. N. (2020). Specification testing with estimated variables. Econometric Reviews, 39(5), 476–494. https://doi.org/10.1080/07474938.2019.1687116
Elhassan, T., Elhassan, & Tomader. (2021). Impact of Oil Price Fluctuations on Economic Growth in Saudi Arabia: Evidence from a Nonlinear ARDL Approach. International Journal of Energy Economics and Policy, 11(5), 579–585. https://econpapers.repec.org/RePEc:eco:journ2:2021-05-66
Gasoline - Price - Chart - Historical Data - News. (2021). https://tradingeconomics.com/commodity/gasoline
Ghosh, A. R., Ostry, J. D., & Chamon, M. (2016). Two targets, two instruments: Monetary and exchange rate policies in emerging market economies. Journal of International Money and Finance, 60, 172–196. https://doi.org/10.1016/J.JIMONFIN.2015.03.005
Hamilton, J., Hamilton, & James. (2011). Nonlinearities and the macroeconomic effects of oil prices. Macroeconomic Dynamics, 15(S3), 364–378. https://doi.org/10.1017/S1365100511000307
Hannachi, H., & Iktissadia, R. (2023). Asymmetric impact of oil price and exchange rate on inflation in Algeria: Evidence from non-linear ARDL approach. Roa Iktissadia Review, 13(1), 143–155. https://asjp.cerist.dz/en/article/226146
Hausman, J. A. (1978). Specification tests in econometrics. Applied Econometrics, 38(2), 112–[PDF] Specification tests in econometrics | Semantic Scholar
Helmy, H. E., & Helmy, H. E. (2025). Modelling the Non-linear Relationship between the International Prices of Oil and Wheat and the Exchange Rate in Egypt. Ekonomika, 103(4), 39–60. https://doi.org/10.15388/Ekon.2024.103.4.3
Husaini, D. H., & Lean, H. H. (2021). Asymmetric impact of oil price and exchange rate on disaggregation price inflation. Resources Policy, 73, 102175. https://doi.org/10.1016/J.RESOURPOL.2021.102175
Ikue, N. J. (2024). Asymmetric impacts of retail energy prices on inflation in Nigeria. Bussecon Review of Social Sciences (2687-2285), 6(2), 25–35. https://doi.org/10.36096/BRSS.V6I2.687
Im, K. S., Pesaran, M. H., & Shin, Y. (2003). Testing for unit roots in heterogeneous panels. Journal of Econometrics, 115(1), 53–74. https://doi.org/10.1016/S0304-4076(03)00092-7
Interest Rates - IMF Data. (n.d.). 2022. Retrieved June 4, 2024, from https://data.imf.org/regular.aspx?key=61545855
Jiménez-Rodríguez, R., Sanchez, M., Jiménez-Rodríguez, R., & Sanchez, M. (2005). Oil price shocks and real GDP growth: empirical evidence for some OECD countries. Applied Economics, 37(2), 201–228. https://doi.org/10.1080/0003684042000281561
Kelikume, I. (2017). Do exchange rate and oil price shocks have an asymmetric effect on inflation?: Some evidence from Nigeria. The Journal of Developing Areas, 51(4), 271–283. https://doi.org/10.1353/JDA.2017.0101
Khobai, H., Xinishe, P., & Lenoke, M. (2025). Asymmetric effect of Oil Prices on Inflation in South Africa: An Econometric Approach. International Journal of Energy Economics and Policy, 15(1), 598–606. https://doi.org/10.32479/IJEEP.17105
Komijani, A., & Haji Heidari, َa. (2024). Asymmetric Effects of Oil Price Shocks, Oil Price Uncertainty and Economic Sanctions on Economic Growth and Inflation in Iran. The Journal of Economic Studies and Policies, 10(2), 189–218. https://doi.org/10.22096/ESP.2024.539363.1573
Kugler, P., & Reynard, S. (2022). Money and inflation in Switzerland. Swiss Journal of Economics and Statistics, 158(1), 1–13. https://doi.org/10.1186/S41937-021-00081-1/FIGURES/9
Kun Sek, S. (2019). Effect of Oil Price Pass-Through on Domestic Price Inflation: Evidence from Nonlinear ARDL Models. Panoeconomicus, 66, 69–91. https://doi.org/10.2298/PAN160511021S
Lacheheb, M., & Sirag, A. (2019). Oil price and inflation in Algeria: A nonlinear ARDL approach. The Quarterly Review of Economics and Finance, 73, 217–222. https://doi.org/10.1016/J.QREF.2018.12.003
Li, Y., & Guo, J. (2022). The asymmetric impacts of oil price and shocks on inflation in BRICS: a multiple threshold nonlinear ARDL model. Applied Economics, 54(12), 1377–1395. https://doi.org/10.1080/00036846.2021.1976386
Long, S., & Liang, J. (2018). Asymmetric and nonlinear pass-through of global crude oil price to China’s PPI and CPI inflation. Economic Research-Ekonomska Istraživanja, 31(1), 240–251. https://doi.org/10.1080/1331677X.2018.1429292
López-Villavicencio, A., & Pourroy, M. (2019). Inflation target and (a)symmetries in the oil price pass-through to inflation. Energy Economics, 80, 860–875. https://doi.org/10.1016/J.ENECO.2019.01.025
Madurapperuma, W. (2023). Money supply, inflation and economic growth of Sri Lanka: co-integration and causality analysis. Journal of Money and Business, 3(2), 227–236. https://doi.org/10.1108/JMB-08-2022-0039
Moussa, R. K., Ousseini, B., & Taha, C. K. (2024). Asymmetric effects of oil prices on inflation in Côte d’Ivoire. Resources Policy, 90, 104842. https://doi.org/10.1016/J.RESOURPOL.2024.104842
Narayan, P. K., & Gupta, R. (2015). Has oil price predicted stock returns for over a century? Energy Economics, 48, 18–23. https://doi.org/10.1016/J.ENECO.2014.11.018
Nasir, M. A., Huynh, T. L. D., & Yarovaya, L. (2020). Inflation targeting & implications of oil shocks for inflation expectations in oil-importing and exporting economies: Evidence from three Nordic Kingdoms. International Review of Financial Analysis, 72, 101558. https://doi.org/10.1016/j.irfa.2020.101558
Nusair, S. A. (2019). Oil price and inflation dynamics in the Gulf Cooperation Council countries. Energy, 181, 997–1011. https://doi.org/10.1016/J.ENERGY.2019.05.208
Pedroni, P. (2004). Panel cointegration: asymptotic and finite sample properties of pooled time series tests with an application to the ppp hypothesis. Econometric Theory, 20(3), 597–625. https://doi.org/10.1017/S0266466604203073
Perspective Monde. (2021). https://perspective.usherbrooke.ca/
Salisu, A. A., Isah, K. O., Oyewole, O. J., & Akanni, L. O. (2017). Modelling oil price-inflation nexus: The role of asymmetries. Energy, 125, 97–106. https://doi.org/10.1016/J.ENERGY.2017.02.128
Sek, S. K. (2017). Impact of oil price changes on domestic price inflation at disaggregated levels: Evidence from linear and nonlinear ARDL modelling. Energy, 130, 204–217. https://doi.org/10.1016/J.ENERGY.2017.03.152
Sek, S. K. (2022). A new look at the asymmetric effect of oil price changes on inflation: Evidence from Malaysia, 34(5), 1524–1547. https://doi.org/10.1177/0958305X221077336
Shahbaz, M., Tiwari, A. K., & Tahir, M. I. (2015). Analyzing time–frequency relationship between oil price and exchange rate in Pakistan through wavelets. Journal of Applied Statistics, 42(4), 690–704. https://doi.org/10.1080/02664763.2014.980784
Shaobo Long & Jun Liang. (2018). Asymmetric and nonlinear pass-through of global crude oil price to China’s PPI and CPI inflation. Economic Research-Ekonomska Istraživanja, 31(1), 240–251. https://hrcak.srce.hr/file/295465
Sihem, T., & Mourad, D. (2021). The Relationship between oil price shocks, inflation rate and economic growth. Roa Iktissadia Review, 11(2), 37–49. https://asjp.cerist.dz/en/article/175467
Westerlund, J. (2007). Testing for Error Correction in Panel Data*. Oxford Bulletin of Economics and Statistics, 69(6), 709–748. https://doi.org/10.1111/j.1468-0084.2007.00477.x
World Bank. (2022). World Development Indicators: Middle East and North Africa economic data. https://databank.worldbank.org
