
Ekonomika ISSN 1392-1258 eISSN 2424-6166
2025, vol. 104(4), pp. 132–149 DOI: https://doi.org/10.15388/Ekon.2025.104.4.8
Algirdas Bartkus
Department of Quantitative Methods and Modelling, Faculty of Economics and Business Administration,Vilnius University,
E-mail: algirdas.bartkus@evaf.vu.lt
Orcid: https://orcid.org/0000-0002-6115-3823
Abstract. A tight budgetary situation in Lithuania forces the Government to seek savings, plan financial resources carefully, and monitor their use closely. As a result, municipalities – which are responsible for implementing several delegated functions – are often viewed unfavourably by the central government when their spending appears excessive, and thus further widening the gap between the income and the expenditure. This article highlights one area where higher expenditure can be economically and strategically justified: education.
The article examines the obstacles that prevent the economy from securing a well-qualified labour force, the measures that could strengthen the workforce quality, and the risks that arise when the economisation of education is applied uncritically. Failure to meet secondary school completion requirements remains a major barrier to full labour-market integration, limiting individuals’ long-term economic prospects and reducing the overall productivity of the workforce. Identifying factors within the education system that help reduce the number of early school leavers is therefore essential for improving labour-market outcomes and supporting sustainable economic development.
Consequently, increased education spending directed toward targeted interventions – particularly those that help students complete secondary education – should not be interpreted as inefficiency. Instead, such investment represents a strategic measure that enhances human capital formation and contributes to stronger long-term economic performance.
Keywords: educational finance, government expenditures and education, State and Local Government.
__________
Received: 02/02/2025. Accepted: 21/09/2025
Copyright © 2025 Algirdas Bartkus. Published by Vilnius University Press
This is an Open Access article distributed under the terms of the Creative Commons Attribution License, which permits unrestricted use, distribution, and reproduction in any medium, provided the original author and source are credited.
Many studies emphasise that the quality of the workforce and its skills increasingly determine a country’s economic competitiveness, attractiveness, and performance (Stijepic, 2021). Other research highlights that prioritising education expenditure is important for supporting economic growth in both developed and developing nations (Bayır & Zengin, 2024). Therefore, for a small, open economy that is not rich in natural resources, such as Lithuania, education becomes a central pillar of economic development. By promoting equality, strengthening democratic participation, improving health outcomes, and increasing the labour force efficiency, education plays a crucial role in economic growth and in improving people’s lives. Compared to resource-rich nations that may become overconfident and neglect education due to easy revenue from natural resources, countries without such resources have less room for error and are less likely to undervalue education (Gylfason, 2001).
The education sector – which is vital for successful economic development – competes with other areas of public life for funding. To achieve the best possible results with limited resources, extremely high efficiency requirements are imposed on their spending. The education system frequently faces dilemmas regarding the relative importance of pupils’ knowledge versus the cost of providing that knowledge. In practice, central government and municipalities often aim to produce school graduates at the lowest possible cost, whereas a rational decision-maker would seek a balance between the two requirements: the level of knowledge and the associated costs.
Today, extremely high efficiency standards apply to the educational system: pupils must acquire knowledge, but their preparation must also be inexpensive. As a result, class sizes are increasing, teachers’ workloads are rising, teaching materials are becoming more demanding, and courses are being intensified. Decisions to increase the number of pupils per teacher are frequently driven by the need to meet stricter efficiency criteria – such as higher output per unit of production cost. Although such solutions inherently involve disadvantages, they help reduce expenditure per pupil and allow the remaining funds to be redirected elsewhere.
However, these cost-cutting measures have negative consequences. Some weaker pupils fail to graduate from secondary school, while others graduate with lower grades than they could potentially have achieved. Increasing the class size may improve the overall efficiency, but it can also lead to undesirable marginal outcomes: too few pupils with exceptionally high achievements, too many with very poor results, and a higher number of pupils who do not graduate. Larger classes limit the time and attention a teacher can devote to each particular student. This orientation toward mass production – in the sense of maximising the number of prepared students per teacher – can therefore reduce the number of outstanding performers and increase the number of pupils who leave school with low grades or without a diploma.
If some of these efficiency-driven solutions are inevitable, the question arises: how can their negative consequences be offset? What measures can mitigate the adverse effects of efficiency pressures in the educational system? By using panel data for all Lithuanian municipalities for the period of 2015–2021, this article examines which tools can help counteract these negative outcomes and improve the labour market performance.
In summary, the poor quality of the workforce often stems from inadequate preparation in educational institutions. The absence of qualifications becomes a barrier to career advancement, and those who fail to complete secondary school face very limited employment opportunities. Reducing the number of such individuals can significantly improve the workforce quality along with the overall economic performance. This article proposes a way to achieve this.
The primary hypothesis suggests that undesirable processes in secondary education can be reversed. Specifically, by decreasing teachers’ workloads, reducing class sizes, increasing contact hours, and strengthening extracurricular activities, it may be possible to reduce the number of students who fail to complete secondary education. Therefore, allocating additional municipal funds for these purposes should not be viewed as overspending but, rather, as an investment that improves educational outcomes and the labour market performance simultaneously.
According to the theoretical model, there are three primary categories of factors that influence educational results. The first group relates to education spending. Numerous studies have attempted to evaluate how financial resources affect schooling outcomes. When certain schools within a country receive more funding while others receive less, comparisons can be drawn that often link higher financing to better academic results. Therefore, it is unsurprising that some studies indicate that public education spending has a significant impact on student performance. For example, research has shown a decline in student achievement in those U.S. states which experienced substantial reductions in education spending (Wall, 2023). However, other studies report the opposite, suggesting that, in some countries, educational services have become more efficient even with lower expenditures (Elshani & Pula, 2022).
Researchers have also extensively examined the relationship between per-pupil spending and student achievement. While delivering high-quality instruction requires adequate school funding, scholars continue to analyse how financial resources translate into measurable improvements in the learning outcomes. Strong causal evidence shows that increases in school spending can substantially improve long-term educational and economic results, including higher graduation rates, more years of completed schooling, and increased adult earnings (Jackson et al., 2015). Evidence from school finance reforms similarly indicates that additional resources – and particularly in lower-income districts – lead to higher academic achievement and improved long-term outcomes (Jackson et al., 2014).
At the same time, not all studies find a consistent or universal relationship between spending and performance. In some countries, all educational institutions receive similar levels of funding, yet variations in outcomes arise due to factors unrelated to municipal or community financial capacity. In such contexts, funding alone exerts limited influence on the learning results, and education spending cannot fully explain cross-national differences in academic performance. Some authors also argue that there is no conclusive evidence linking higher education spending to improved academic outcomes. Despite substantial increases in expenditure, long-term indicators such as high school graduation rates and test scores have not shown significant improvement in certain settings (Lips et al., 2008).
The second group of factors concerns teachers’ workloads and the amount of time they can devote to each student. The number of pupils per teacher determines how much individual attention a student can receive. As teachers’ workloads increase, the time available for each student decreases. Larger class sizes reduce opportunities for interaction and limit the individual attention which teachers can provide. Teachers in smaller classes tend to pose more demanding questions and engage more frequently with students, which contributes to better academic outcomes. Increasing the class size can negatively affect achievement by discouraging students from asking questions, limiting their opportunities for self-expression, and reducing teachers’ awareness of student absences. Research also indicates that the teaching quality matters more than the class size when it comes to improving student performance. Larger class sizes may increase opportunities for cheating, reduce student engagement, and hinder the teacher–student interaction, all of which can negatively affect academic achievement (Wang & Calvano, 2022).
The class size influences learning outcomes by shaping the teacher-student contact and student engagement. Smaller classrooms typically foster higher levels of participation, engagement, and attention. They may also allow for greater support from teachers and peers, strengthening relationships and enhancing involvement. In contrast, larger classes can reduce student engagement and visibility. Research shows that factors such as the class size and teacher support affect student satisfaction (Wang & Calvano, 2022). It has also been noted that the class size influences student behaviour and educational outcomes, which, in turn, shape learning results. Smaller classes often lead to better outcomes by encouraging more interaction between teachers and students, whereas larger classes may reduce interaction and attentiveness. Students report that larger classes result in less engagement and lower satisfaction with teacher interactions (Wang & Calvano, 2022).
Contradictory findings can also be presented. According to Jepsen, classroom fixed effects account for roughly 25 to 40 percent of the variation in student achievement. This suggests that both teachers and peers play an important role in shaping academic outcomes, while the coefficients for the class size are generally small and statistically insignificant. His findings indicate that, although the class size and individual teacher characteristics may not be strong predictors of achievement, the collective classroom environment contributes significantly to students’ academic progress over time (Jepsen, 2004).
Other research has examined the opposite effect, specifically, the impact of smaller class sizes on academic performance. Reduced class sizes yielded mixed effects: while they improve reading and math proficiency, they also lead to an increase in teachers who lack formal training and experience, which diminishes the gains – particularly in schools serving minority and economically disadvantaged students. These effects were identified by analysing year-to-year variations in the class size (Jepsen & Rivkin, 2009). Teacher training can also influence student performance. Studies show that content-focused professional development is positively associated with productivity in mathematics, and that more experienced teachers tend to be more effective in teaching math (Harris & Sass, 2010; Jacob & Lefgren, 2004).
Another factor influencing student achievement is the availability and quality of instructional materials. Research shows that access to appropriate science instructional materials can significantly improve students’ academic performance, particularly in foundational subjects (Abidoye & Abidoye, 2023).
The third group of factors concerns the impact of extracurricular activities on learning outcomes. Clubs and extracurricular activities may support those students who struggle in formal academic subjects while providing opportunities to develop strengths in other areas; these activities also support the development of skills not directly taught in the classroom. These activities can influence final academic results and provide additional motivation to learn. Empirical studies support these claims. In secondary school, participation in extracurricular activities and athletics is associated with better educational outcomes, including higher expectations of earning a bachelor’s degree and higher test scores in science and math. Club involvement is linked to a 1 percent increase in math test performance, while athletic participation is associated with a 2 percent increase in math and science scores. Participation in both types of activities is positively associated with higher expectations of completing a bachelor’s degree, with studies reporting increases of approximately five percentage points (Lipscomb, 2006; Holland & Andre, 1987).
Additional benefits of extracurricular activities have also been documented. Non-formal education can enhance learning outcomes by complementing formal instruction and connecting non-formal activities to cognitive, attitudinal, and emotional aspects of learning. A study involving teachers suggests that non-formal activities can improve learning outcomes, and that integrating in-school and out-of-school learning is essential for maximising educational gains (Tabacaru, 2018). Research also indicates that the psychomotor abilities of middle-school students in non-formal settings – such as children’s clubs and cultural centres – differ favourably from those developed in formal education, particularly in flexibility, originality, creativity, promptness, spontaneity, and rapid thinking (Gloria et al., 2014). Many scholars agree that school clubs exert a significant influence on learning outcomes, and that personal experience plays an important explanatory role. A study of college student club committee members found that learning through club activities can be an effective strategy for improving learning outcomes. At the tertiary level, learning through student club activities has been shown to be positively associated with learning outcomes (Chen et al., 2023). Numerous studies also highlight broader benefits of extracurricular participation, including improved behaviour, higher grades, increased school completion rates, and social skills that contribute to successful adulthood. Students who participate in extracurricular activities are three times more likely to earn a higher grade point average, regardless of their background or prior achievement. Participation also enhances confidence, strengthens positive adult relationships within the school environment, and increases self-assurance (Massoni, 2011; Christison, 2013).
In order to determine the effectiveness of education costs, in the first stage, a model should be created, which would be able to distinguish the factors that determine the fact that, in some municipalities, education costs are higher while being lower in others. Only by identifying the factors that determine different levels of funding will it be possible to assess the impact of higher or lower costs on educational outcomes.
Educational expenditures consist of funds required to facilitate teaching and learning processes, whereas their magnitude is linked to the demands of students receiving educational services, teachers delivering them, and the necessary infrastructure for their provision. Individuals receiving educational services are classified into two categories: the number of secondary, primary, and pre-school education students, and the number of kindergarteners. The count of individuals delivering educational services and teachers is not categorised by the sorts of educational institutions. An attempt was made to utilise this option during the model selection process; however, it proved ineffective, as employing the total number of teachers yields more precise estimates of coefficients. The model includes infrastructure and its magnitude through the variable of physical area which is allocated for educational activities. These variables should yield accurate estimates of the probable requirement for educational funding in communities with a substantial population of students, educators, and a considerable infrastructure budget.
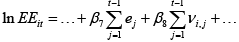
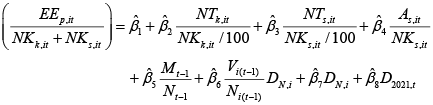
This article presents a model that replicates the educational funding procedures in Lithuania. The Lithuanian central government distributes the funds for municipalities according to the number of students, while slightly adjusting them to the number of teachers and specific schooling infrastructure demands. The Ministry, year by year, does not adjust the total amount of funds; it assigns them anew, and municipalities can adjust them slightly, taking into account other factors that are of importance for them. That means that, in a proper model, the total level of educational spending has to be modelled, and not their changes or growth rates. And here, two problems arise. The first problem is that these expenditures are nonstationary; thus, they cannot be modelled directly unless they are cointegrated with some of the factors in the model. The second problem is that, when using panel data, there is a need to model the regular indexing of educational spending. Both problems can be solved simultaneously. Incorporating a linear trend to model indexation would be the simplest, yet least effective, approach. The educational expenditure (EE) equation would look like this:
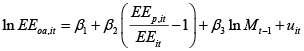
Using a linear trend is problematic because it assumes the same growth year after year, which, certainly, is not true. Almost every year, these expenditures are indexed, without any formal rules, so the source of non-stationarity in educational expenditures is the Government’s decision to raise their level. And, after some experimentation, the best criterion for expenditure indexation was the nominal GDP. All budget revenues grow at a similar pace to the nominal GDP, the higher level of which provides opportunities to increase education expenditures. The nominal GDP, which is a non-stationary variable, i.e., itself a stochastic trend, allows for the continuous growth of education spending to be modelled by using a stochastic trend rather than a deterministic one. This article employs a stochastic indexation approach, by using the nominal GDP and value added in a specific municipality as stochastic trends. Denoting e as GDP innovations and ν as value-added innovations, the indexation part of the equation would look like this:
This formulation implies that expenditures are indexed according to the capacities of a state and to the financial capacities of municipalities. Nonstationarity of variables will not cause any problem if the stochastic trends in a model eliminate each other; thus, standard models remain valid despite the variables having unit roots. The reason why these trends may eliminate each other is very simple: the central government adjusts spending on education at a rate which is similar to the nominal GDP growth rate, and municipalities adjust their portion similarly to the growth rate of their value added. The Pedroni tests for the pairs of expenditures on education and nominal GDP and expenditures on education and municipal value added deliver standardised statistics -6.003 and -6.004, allowing us to reject the null of no cointegration. This implies that a linear combination of these variables is stationary and can be modelled by using techniques that are in match with the cointegrating nature of these variables.
The necessity for central government to annually adjust educational costs, irrespective of the economic conditions of a specific municipality, is represented by incorporating the aggregated national income indicator into the model. Additionally, the possibility for individual municipalities, in particular years, to have marginally elevated or downgraded costs compared to other identical municipalities is modelled by integrating the specific municipality’s economic activity and an indicator that reflects its financial status. This option surpasses the use of a temporal trend, since it enables the degree of indexation to be contingent upon the economic conditions of a specific year, facilitating an acceleration during economic improvement and a deceleration during economic decline. The effects of the nation’s economic development on municipal educational expenditures are analysed through the previous year’s nominal gross domestic product, while the capacity of municipalities to further finance education is assessed via the lag of the value-added variable generated in the individual municipality the previous year. The model omits the values of these variables for the current period, while, instead, incorporating delays. Specific lags, with one period delay, are included because the actual changes in the expenditures reflect the last actual changes in income. As the government adjusts future expenditures according to the last observed changes in income, so the lags are included to mimic the current administrative practice.
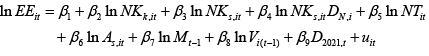
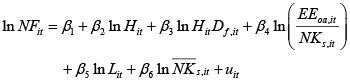
In the final model, expenditures by individual municipalities on education are determined by the number of pupils in general education institutions (NKs), the number of children in pre-school education institutions (NKk), the number of teachers and educators employed in all educational institutions (NT), the area of educational facilities (As), the previous year’s aggregated national income, measured by the nominal gross domestic product (M), and the added value generated in individual municipalities during the previous year (V). The model incorporates the dummy variable for the municipality of Neringa (DN), facilitating the modelling of very high educational expenditure in this municipality, despite its extraordinarily low student and teacher population, along with the dummy variable for the year 2021 (D2021). The latter is necessary to model the rise in educational expenditure, which is incompatible with the modest economic growth in 2020. The model equation in a logarithmic linear form looks like this:
 (1)
(1)
The logarithmic transformation was used because taking the logarithms of variables allowed the linearisation of nonlinear relationships. This panel data model has the same intercept for all municipalities. The estimates of the coefficients of Equation (1) are listed in Table 1.
|
Coefficient |
Estimate |
Std. error |
t value |
p value |
|
β1 |
-2.1611 |
0.4382 |
-4.9323 |
1.182e-06 |
|
β2 |
0.2232 |
0.0231 |
9.6718 |
<2.2e-16 |
|
β3 |
0.1865 |
0.0389 |
4.7919 |
2.312e-06 |
|
β4 |
0.0969 |
0.0099 |
9.7502 |
<2.2e-16 |
|
β5 |
0.3154 |
0.0450 |
7.0103 |
9.813e-12 |
|
β6 |
0.1563 |
0.0244 |
6.4121 |
3.946e-10 |
|
β7 |
1.0453 |
0.0414 |
25.2788 |
<2.2e-16 |
|
β8 |
0.0628 |
0.0120 |
5.2435 |
2.526e-07 |
|
β9 |
0.0744 |
0.0122 |
6.1026 |
2.415e-09 |
Since the model is a panel data model, the autocorrelation was checked separately for each of the 60 municipalities in Lithuania. The errors are not autocorrelated in any of the municipalities, which indicates that the dynamics are well modelled. The Jarque-Bera normality test for the residuals of the model (p value equal to 0.1121) shows that the linear combination of the variables in the model is normally distributed. The Maddala-Wu unit-root test for the residuals (p value less than 2.2e-16) and the linear combination of nonstationary variables results in a stationary error term, which, in turn, justifies the usage of these nonstationary variables in this panel model. The same diagnostic tests were performed with all subsequent models, but, in order to save time and space, their results are not presented.
The coefficients of the equation indicate that, when comparing municipalities identical in all other characteristics, a one-percent increase in the number of pre-school pupils can be associated with a 0.22 percent rise in education costs, while a one percent increase in general education students can be associated with a 0.19 percent rise in education costs. The rise in student enrolment in the municipality of Neringa significantly affects the educational expenses there. In this municipality, a one percent rise in the number of general education pupils can be associated with a 0.28 percent increase in educational expenditure. The number of educators in Lithuanian schools is strongly tied to the number of pupils, although certain distractions from the general trend in different municipalities can, of course, arise. A one percent increase in the number of educators across all educational institutions can be associated with a 0.32 percent rise in educational expenditures. The infrastructure and inventory utilised for training purposes, along with the necessity for funding for their maintenance and service, are represented by the physical area variable. The estimation results indicate that an increase of one percent in the school area can be associated with a 0.16 percent rise in educational expenditures. These factors are the essential variables that directly determine the transfers from the central government for educational purposes, which can be directly linked to the requirement to educate a specific number of pupils, to employ the corresponding number of teachers, and to sustain the essential infrastructure. The nominal gross domestic product is one of the best indicators of the country’s overall economic situation and is the best representative of the possibility and necessity to annually index costs for all municipalities. Its estimated effect has a value of 1.05, which means that a one percent increase in nominal GDP is associated with slightly over a one percent increase in educational spending overall in the country. This finding is in line with the fact that spending for educational purposes in Lithuania grew up a little faster than for other purposes in recent years: a one percent increase in the nominal income in the country results in an average expenditure growth of 1.05 percent on education. The indicator of municipality added value, which illustrates the disparities among individual municipalities and their respective capacities for enhanced education funding, indicates that municipalities creating greater added value tend to exhibit marginally elevated educational expenditures – specifically, a one percent increase in added value can be associated with a 0.06 percent rise in educational spending. The final factor, the 2021 dummy, reflects the decision to provide significant funding for educational needs in 2021, despite the COVID-19 pandemic’s negative economic impact on the results in the year 2020.
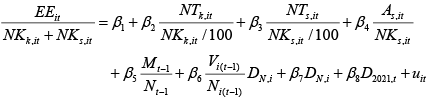
A limitation of the model is that the two variables, the number of students and teachers, are mutually interconnected. The demand for instructors will increase in areas with a higher pupil population and decrease where there are fewer kids. The partial duplication of these variables does not substantially influence the estimation results but may affect the assessment of individual influences on costs. To address this limitation, a non-logarithmic model of ratios was created and estimated, wherein the dependent variable was the educational expenditure per student EE/(NKk + NKs). The chosen independent variables are the number of educators per one hundred pupils in preschool institutions NTk/(NKk/100), the number of teachers per one hundred students in general education institutions NTs/(NKs/100), the physical area per one pupil As/NKs, and the total nominal domestic product per capita, expressed in thousands of euros M/N . Solely to the municipality of Neringa, the variable of added value per resident V/N is included. The model is further refined by using a dummy variable, D2021, to represent the decision to sustain elevated education funding in 2021. The ultimate expression of the equation with ratios is as follows:
 (2)
(2)
Due to the heteroskedasticity of the errors, the standard errors of model (2) were recalculated, similarly to model (1), by using the methods that account for the presence of heteroskedasticity in the error term. The results of the estimation of model (2) are displayed in Table 2.
|
Coefficient |
Estimate |
Std. error |
t value |
p value |
|
β1 |
-1903.69 |
198.74 |
-9.58 |
9.3664e-20 |
|
β2 |
47.80 |
7.57 |
6.31 |
7.1942e-10 |
|
β3 |
60.71 |
12.90 |
4.71 |
3.4657e-06 |
|
β4 |
35.53 |
5.32 |
6.68 |
7.7492e-11 |
|
β5 |
212.28 |
7.69 |
27.62 |
8.8846e-96 |
|
β6 |
891.69 |
76.02 |
11.73 |
1.3055e-27 |
|
β7 |
-2042.96 |
547.55 |
-3.73 |
2.1737e-04 |
|
β8 |
310.74 |
50.63 |
6.14 |
1.9768e-09 |
The coefficient estimates in this equation indicate the relationship between the expenditure per pupil and other factors associated with their level. An increment of one preschool teacher per one hundred kids can be associated with an increase of 47.80 euros in costs per pupil over the academic year, while an additional teacher per one hundred students in primary and secondary education is linked to a rise of 60.71 euros in costs per pupil, also throughout the school year. In a comparison of two municipalities similar in all other aspects, each additional square meter of area per pupil correlates with an increased spending of 35.53 euros per kid annually. An increment of one thousand euros in the nominal gross domestic product per capita results in an augmentation of 212.28 euros in educational expenditures per student.
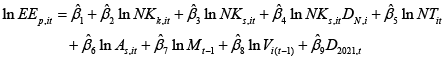
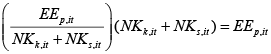
By using the estimates of the coefficients of model (1), it is possible to define the level of educational expenditure EEp as if they were defined only by the levels of variables included in the model:
 (3)
(3)
This equation gives the level of spending on education as if they were defined only by the objective factors and distributed according to them proportionally among the municipalities. The total projected educational expenses in a non-logarithmic format are derived by taking the antilogarithm of the estimated value of the dependent variable calculated from Equation (3):
 (4)
(4)
By dividing the anticipated amount of educational expenditure by the total student population, we shall ascertain the predicted expenditure per student:
 (5)
(5)
The model with ratios (2) may likewise serve the evaluative purpose:
 (6)
(6)
The estimations derived from Equations (5) and (6) are mutually exclusive alternatives. By utilising the same rationale, the estimation from the relative indicators model (6) may be employed to extrapolate the whole projected expenditure on education. Multiplying the most probable spending per pupil derived from Equation (6) by the total pupil count yields an alternate estimate for the overall educational expenditure calculated by using the logarithmic model (Equation (4)).
 (7)
(7)
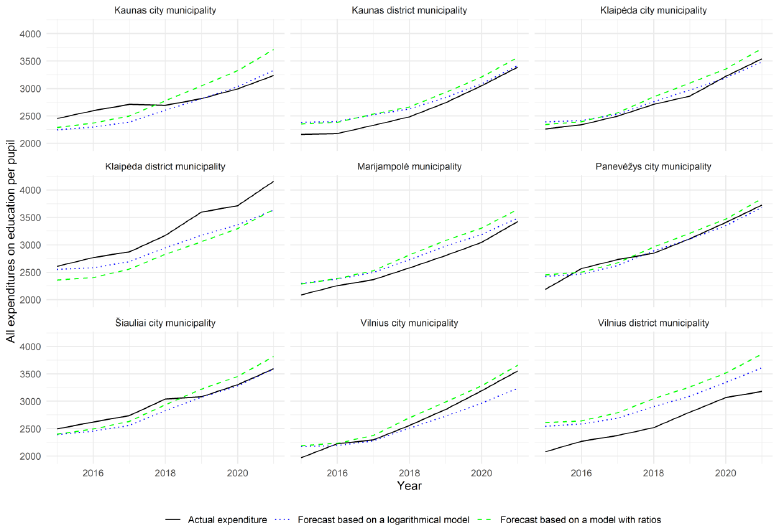
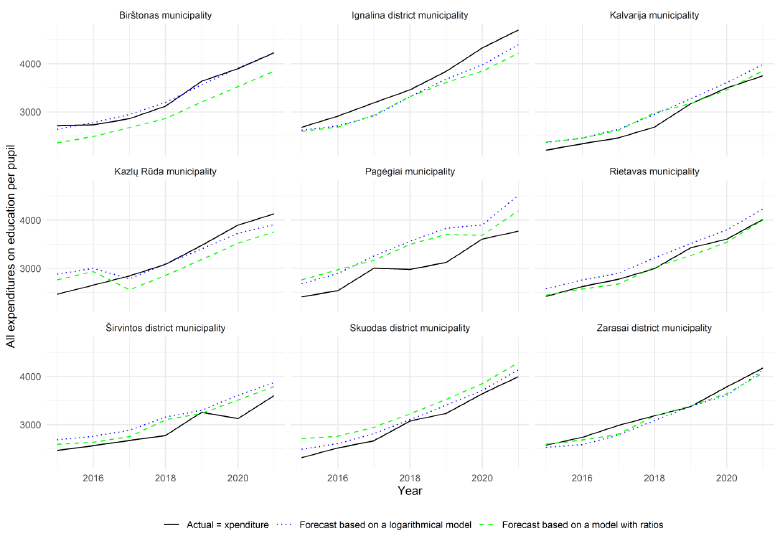
While it is feasible to derive an estimate of the total educational expenditure by using the method outlined in Equation (7), the reliability of this estimate is highly questionable. This is due to the fact that the absolute error in the per-student expenditure calculation will be significantly amplified, resulting in a grossly inaccurate estimate of the overall educational expenditure, as indicated in Equation (7). Consequently, the ratio model will serve solely as an alternative to the logarithmic model, specifically for estimating the spending per student. Figure 1 displays the actual educational expenditure alongside the expected or assumed expenditure from the two models in the largest municipalities, while Figure 2 plots the same curves for the smallest municipalities.
The disparity between the expenditures forecasted by the model and the actual expenses is the expenditure gap, which is determined in both absolute and relative terms as follows:
 (8)
(8)
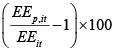 (9)
(9)
These gap indicators are numbers that show how unique the municipality is, and to what extent the predicted values from Equation (3), which show the level of spending based on objective factors, are different from the actual values. It is of importance to note that, in the calculation of gaps, the actual values are subtracted from the predicted values, rather than vice versa. If Equation (8) gives a positive absolute gap or if Equation (9) gives a relative gap greater than one, it means that the municipality spent less money on education than the average, taking into account the model’s factors that affect these spendings. A positive gap indicates a situation where the actual spending in one municipality, compared to other administrative units, is less than expected. If the relative gap is less than one, it means that, when taking into account the levels of factors in the model, municipal spending is higher than expected – i.e., the actual expenses exceeded those presupposed by the prevailing variables.
The results indicate that, for most municipalities, the gaps identified by both models exhibit the same signs, with a correlation coefficient of 0.85, suggesting a greater similarity than disparity between the two datasets, despite their non-identical nature. The logarithmic model (1) and the ratio model (2) look at the average gaps per student. The signs are mostly different for larger cities (Vilnius, Kaunas, Šiauliai, and Panevėžys) and some smaller cities (Birštonas, Alytus District, Anykščiai District, Jurbarkas District, Plungė District, Vilkaviškis District, Kazlų Rūda, and Rietavas). In the logarithmic model (1), the municipalities with the smallest average gaps are Panevėžys City, Pasvalys District, and Anykščiai District. Conversely, the largest positive gaps, reflecting below-predicted education financing, are found in Pagėgiai, Druskininkai, Šalčininkai District, and Vilnius District. The largest negative gaps, indicating above-average funding for educational purposes, are present in Rokiškis District, Visaginas, Šakiai District, Palanga City, and Klaipėda District. According to the model of relative indicators (2), the minimal disparities are observed in the municipality of Neringa, Ukmergė District, Šiauliai City, and Prienai District, whereas the largest significant positive disparities are found in Vilnius District, Šalčininkai District, Pagėgiai, and Alytus City. Conversely, negative disparities are present in the municipalities of Palanga City, Visaginas, Rokiškis District, and Klaipėda District.
From a labour market perspective, an education system will be considered adequate if it is able to supply the future workforce with the appropriate qualifications. The extreme case of failure in an education system is a situation where a huge number of students fail to graduate from schools with a diploma. In this article, the efficacy of the education system from the labour market perspective is assessed by taking into account the number of students who failed not complete the secondary school (NF), and by developing a model to find the elements that may mitigate this adverse phenomenon. After several experiments, the most appropriate model encompassing the variations in the number of students who did not complete secondary school ultimately took this form:
 (10)
(10)
In Equation (10), H represents the number of contact hours, NKs denotes the number of students in primary and secondary education, Df is a dummy variable that was used here for technical purposes, as it facilitates the estimation with municipalities where all students completed their education, EEoa refers to expenditures allocated for inferior educational activities, such as extracurricular programs, educational initiatives, or professional development, L stands for the average classroom workload of teachers, and  indicates the average number of students per educational institution. The variations in the number of pupils who failed to graduate from secondary school throughout specific years and municipalities are influenced by the quantity of contact hours per student, the teacher’s workload, expenditures on additional educational activities, and the average student enrolment per educational institution.
|
Coefficient |
Estimate |
Std. error |
t value |
p value |
|
β1 |
0.9856 |
4.8218 |
0.2044 |
8.3814e-01 |
|
β2 |
-1.8555 |
0.4460 |
-4.1599 |
3.8726e-05 |
|
β3 |
-0.4341 |
0.0896 |
-4.8425 |
1.8139e-06 |
|
β4 |
-0.5577 |
0.0998 |
-5.5893 |
4.1421e-08 |
|
β5 |
1.6111 |
0.7650 |
2.1061 |
3.5798e-02 |
|
β6 |
0.4739 |
0.2032 |
2.3320 |
2.0177e-02 |
This equation indicates that, when analysing specific municipalities or years, a one percent increase in contact hours per student (which is about 40 minutes in absolute terms) results in a 1.86 percent reduction in the number of students who were not able to graduate from secondary schools. The dropout rate’s response to expenditures on alternative educational activities is likewise unfavourable. An increase of one percent in expenditure on other education-related activities would result in a 0.56 percent reduction in the number of pupils who failed to graduate. Simultaneously, the influence of the teachers’ workload on the prevalence of pupils who failed to complete their education is affirmative. A one percent increase in workload, which results in approximately 7 hours, can be associated with a 1.61 percent rise in the number of students who could not complete their secondary education. The relationship between the number of students who could not complete their secondary education and the average number of pupils at the school in the municipality is also worth mentioning. A one percent rise in the number of students in a school results in a 0.47 percent increase in the number of students who could not complete their secondary education when comparing identical municipalities or periods in time.
In summary, the findings from Equation (10) indicate that, in order to decrease the number of students who could not complete their secondary education, it is essential to augment expenditures on various educational initiatives, including extracurricular activities, clubs, sports, educational projects, and teacher training. Additionally, it is important to increase contact hours, decrease class sizes, refrain from expanding the number of schools, and alleviate teacher workloads by hiring additional educators rather than overburdening the current staff. Increased individual work and diminished mass educational activities can effectively contribute to lowering the number of students who could not complete their secondary education.
Investment in extracurricular educational activities is a crucial factor in decreasing the number of students who could not complete their secondary education. These expenses are correlated with the discrepancies between the actual and the expected educational expenditures. A model that effectively combines these expenses and deficiencies is structured as follows:
 (11)
(11)
The model is augmented by a control variable, the first lag of the nominal gross domestic product. The primary rationale for its inclusion is that more expenditure on other educational activities will consistently be designated when the nation’s economic conditions enhance, and a converse of this point. Table 4 presents the coefficient estimates of Equation (11), along with their standard errors, t-statistics, and p-values.
|
Coefficient |
Estimate |
Std. error |
t value |
p value |
|
β1 |
-12.0017 |
1.8520 |
-6.4804 |
2.5858e-10 |
|
β2 |
-2.7646 |
0.2818 |
-9.8115 |
1.3886e-20 |
|
β3 |
1.7027 |
0.1738 |
9.7982 |
1.5460e-20 |
The estimation results of Equation (11) indicate that a one percentage point increase in the gap corresponds to a 2.76 percent rise in expenses for other educational activities. The gap variable is designed in such a way that its negative values, rather than positive ones, signify costs exceeding those established by model (1). These estimation results indicate that, in municipalities that exhibit greater discrepancies between the actual and the anticipated expenditures, a portion of this gap can be attributed to expenditures on additional education-related activities. If the municipality uses increased expenditures for initiatives that can decrease the number of students who failed to graduate, such excess spending should be seen as an appropriate allocation of financial resources.
To decrease the number of students who failed to graduate, greater emphasis and financial resources should be allocated to alternative educational initiatives, teacher trainings, clubs, extracurricular activities, increasing contact hours, alleviating teacher workloads, and preventing school overcrowding.
Other research indicates that, in order for pupils to benefit from extracurricular activities, one must draw their parents’ attention to them in addition to providing more financing. Research indicates that parents with higher educational levels are more likely to recognize the benefits of their children’s growth than parents with lower educational levels. Some qualitative studies suggest that a greater parental engagement and stronger community support structures – including an increased attention to extracurricular activities – may contribute to more effective learning inside and outside the classroom (Grant et al., 2022). Parental involvement plays an important role in the students’ participation in and benefits from extracurricular activities, thereby reinforcing the positive effects of an increased financing and school support (Fredricks & Eccles, 2006).
Although the findings are educational in nature, they also have important economic implications. Excess spending on education, if directed towards extracurricular activities, social cohesion and other soft needs, should not be treated as overspending but, instead, as a good solution that helps reduce the number of school dropouts and improve the situation in the labour market.
It is also worth warning the reader about the main limitations of this study. The first is related to the pandemic period. Undoubtedly, the pandemic has had profound and deep effects on the learning outcomes and processes. However, the lack of various micro-data on educational processes has caused the true and real COVID effects on educational processes, which affect the outcomes, to remain hidden. The second limitation is that this study is purely empirical, based on an econometric model that mimics the way the government distributes expenditures. School education is financed centrally by the government, based on the number of pupils and slightly adjusted by additional funds allocated by municipalities, which are related to the number of teachers and the infrastructure maintenance needs. Some municipalities allocate slightly more funding, while others allocate slightly less, but those in which slightly more funding is directed to extracurricular activities, higher maintenance of smaller classes, etc., also have one positive result – i.e., in those municipalities, fewer students fail to graduate from school. Therefore, there is a small risk that some of the dependencies detected here are not causal – but that they are simply correlations. A theoretical model that could confirm or refute the statements made here would be the subject of further research.
Decreasing the percentage of students who are unable to complete their secondary school could substantially enhance the workforce quality and the overall economic performance. Municipalities that realise the importance of such a step can do so by directing additional funding towards extracurricular activities and other soft measures related to education. The article reveals that the municipalities that devote more financial funds to education and specifically to soft measures achieve better results, which determines the quality of the labour force.
The fluctuations in the number of students who did not complete secondary education across particular years and municipalities are affected by the amount of contact hours per student, the teacher’s workload, expenditures on supplementary educational activities, and the average student enrolment per educational institution.
Reduction of the number of students who failed to complete secondary education requires increasing funding for diverse educational efforts, such as extracurricular activities, clubs, sports, educational projects, and teacher training. Furthermore, it is essential to increase contact hours, reduce class sizes, avoid the overcrowding of schools, and mitigate teacher workloads by employing new educators instead of overloading the already existing personnel. Higher individual engagement can also significantly aid in decreasing the dropout rate.
Spending on supplementary education-related and extracurricular activities contributes significantly to the discrepancy between the actual and the projected expenditures in municipalities and helps to reduce the number of nongraduates. Increased municipal expenditures on initiatives aimed at reducing the dropout rate should be regarded as a proper utilisation of financial resources.
To reduce the number of students who failed to graduate from school, an increased focus and financial resources must be directed towards alternative educational programmes, enhancing teacher qualifications, supporting clubs and extracurricular activities, increasing contact hours, reducing teacher workloads, and mitigating school overcrowding.
Excess expenditure on education, when allocated to extracurricular activities, social cohesion, and other soft needs, should not be regarded as overspending but rather as a beneficial strategy that mitigates the school dropout rates and improves the labour market conditions. Municipalities that spend more than usual or planned on the aforementioned educational needs cannot be considered as financially irresponsible. These expenditures provide significant, albeit difficult-to-measure, benefits to the labour market.
Abidoye, F. O., & Abidoye, A. O. (2023). Analysis of Effect of Science Instructional Materials on Students’ Academic Performance in Ilorin West, Kwara State. EduBasic Journal Jurnal Pendidikan Dasar, 5(1), 1–10. https://doi.org/10.17509/ebj.v5i1.56184
Bayır, M., & Zengin, N. (2024). Does the impact of education expenditures on economic growth vary between developed and developing countries? Ekonomika, 103(4), 6–21. https://doi.org/10.15388/ekon.2024.103.4.1
Elshani, A., & Pula, L. (2022). The Efficiency of Educational and Healthcare public expenditures in Kosovo: A Data Envelopment Analysis Technique. Ekonomika, 101(2), 92–108. https://doi.org/10.15388/ekon.2022.101.2.6
Chen, M., Chien, H., & Liu, R. (2023). An Empirical Study on the Learning Experiences and Outcomes of College Student Club Committee Members Using a Linear Hierarchical Regression Model. Applied System Innovation, 6(1), 23. https://doi.org/10.3390/asi6010023
Christison, C. (2013). The Benefits of Participating in Extracurricular Activities. BU Journal of Graduate Studies in Education, 5(2), 17–20. http://files.eric.ed.gov/fulltext/EJ1230758.pdf
Fredricks, J. A., & Eccles, J. S. (2006). Is extracurricular participation associated with beneficial outcomes? Concurrent and longitudinal relations. Developmental Psychology, 42(4), 698–713. https://doi.org/10.1037/0012-1649.42.4.698
Gylfason, T. (2001). Natural resources, education, and economic development. European Economic Review, 45(4–6), 847–859. https://doi.org/10.1016/s0014-2921(01)00127-1
Grant, M., Burns, A., & Lucas, S. E. (2022). Learning in and beyond the classroom: Communities of practice in education support for separated children. Children & Society, 38(1), 32–47. https://doi.org/10.1111/chso.12644
Gloria, R., Tatiana, D., Constantin, R. B., & Marinela, R. (2014). The Effectiveness of Non-formal Education in Improving the Effort Capacity in Middle-school Pupils. Procedia - Social and Behavioral Sciences, 116, 2722–2726. https://doi.org/10.1016/j.sbspro.2014.01.643
Harris, D. N., & Sass, T. R. (2010). Teacher training, teacher quality and student achievement. Journal of Public Economics, 95(7–8), 798–812. https://doi.org/10.1016/j.jpubeco.2010.11.009
Holland, A., & Andre, T. (1987). Participation in Extracurricular Activities in Secondary School: What Is Known, What Needs to Be Known? Review of Educational Research, 57(4), 437–466. https://doi.org/10.3102/00346543057004437
Jackson, C. K., Johnson, R. C., & Persico, C. (2015). The Effects of School Spending on Educational and Economic Outcomes: Evidence from School Finance Reforms. The Quarterly Journal of Economics, 131(1), 157–218. https://doi.org/10.1093/qje/qjv036
Jackson, C. K., Johnson, R., & Persico, C. (2014). The Effect of School Finance Reforms on the Distribution of Spending, Academic Achievement, and Adult Outcomes. https://doi.org/10.3386/w20118
Jacob, B. A., & Lefgren, L. (2004). The Impact of Teacher Training on Student Achievement: Quasi-Experimental Evidence from School Reform Efforts in Chicago. The Journal of Human Resources, 39(1), 50. https://doi.org/10.2307/3559005
Jepsen, C. (2004). Teacher characteristics and student achievement: evidence from teacher surveys. Journal of Urban Economics, 57(2), 302–319. https://doi.org/10.1016/j.jue.2004.11.001
Jepsen, C., & Rivkin, S. (2009). Class Size Reduction and Student Achievement: The Potential Tradeoff between Teacher Quality and Class Size. The Journal of Human Resources, 44(1), 223–250. https://doi.org/10.1353/jhr.2009.0008
Lips, D., Watkins, S. J., & Fleming, J. (2008). Does spending more on education improve academic achievement? Backgrounder. No. 2179. In Heritage Foundation eBooks. http://files.eric.ed.gov/fulltext/ED509499.pdf
Lipscomb, S. (2006). Secondary school extracurricular involvement and academic achievement: a fixed effects approach. Economics of Education Review, 26(4), 463–472. https://doi.org/10.1016/j.econedurev.2006.02.006
Massoni, E. (2011). Positive Effects of Extra Curricular Activities on Students. ESSAI, 9(1), 27. https://core.ac.uk/download/pdf/10676858.pdf
Roser, M., & Ortiz-Ospina, E. (2024, March 12). Education Spending. Our World in Data. https://ourworldindata.org/financing-education
Stijepic, D. (2021). A cross-country study of skills and unemployment flows. Journal for Labour Market Research, 55(1). https://doi.org/10.1186/s12651-021-00289-x
Tabacaru, C. (2018). Impact of non-formal education on the efficacy of school learning. Studia Universitatis Moldaviae, 9(119) 229–233. https://doaj.org/article/0a494ca3f5aa4a36be5147bebc4aa8cb
Wall, H. J. (2023). Student Outcomes and Spending on Teachers in the Aftermath of Recession. Missouri Policy Journal, 1(12). https://doi.org/10.62608/2330-930x.1055
Wang, L., & Calvano, L. (2022). Class size, student behaviors and educational outcomes. Organization Management Journal, 19(4), 126–142. https://doi.org/10.1108/omj-01-2021-1139