Organizations and Markets in Emerging Economies ISSN 2029-4581 eISSN 2345-0037
2020, vol. 11, no. 1(21), pp. 244–268 DOI: https://doi.org/10.15388/omee.2020.11.33
Pricing Efficiency of Exchange Traded Funds in India
Y V Reddy (Corresponding author)
Goa University, India
yvreddy@unigoa.ac.in
https://orcid.org/0000-0002-0805-6637
Pinkesh Dhabolkar
Vidya Prabhodini College, Parvari, Goa, India
dhabolkarpinkesh@gmail.com
https://orcid.org/0000-0001-8858-9515
Abstract. Exchange traded funds (ETFs) have two prices, the market price and the net asset value (NAV) price. ETFs NAV price gets determined by the net value of the constituent assets, whereas the market price of ETFs depends upon the number of units bought or sold on the stock exchange during trading hours. As per the law of one price, the NAV and market price of the ETF should be the same. However, due to demand and supply forces, the market price may divert from its NAV. This price difference may have significant repercussions to investors, as it represents a cost if they buy overvalued ETF shares or sell undervalued ETF shares. Pricing efficiency is the speed at which the market makers correct the deviations between ETFs NAV and market price. The present study attempts to investigate the pricing efficiency of Indian equity ETFs employing an autoregression model over its price deviation, and also attempts to understand the lead-lag relationship between the price and NAV using the vector error correction model (VECM).
Keywords: exchange-traded funds, pricing efficiency, premium, discount.
Received: 12/14/2019. Accepted: 4/12/2020
Copyright © 2020 Y V Reddy, Pinkesh Dhabolkar. Published by Vilnius University Press. This is an Open Access article distributed under the terms of the Creative Commons Attribution Licence, which permits unrestricted use, distribution, and reproduction in any medium, provided the original author and source are credited.
1. Introduction
Exchange-traded funds (ETFs) are unit investment trusts designed to mimic an underlying market index. It is a stock that reflects the composition of a chosen market index; each ETF share is a claim on a trust that holds a specified pool of assets. An accredited financial institution (market maker or authorised participant) creates ETF shares by depositing a portfolio of securities with the Trust and receives ETF shares in return. The created ETF shares, in turn, are sold to other investors in the secondary market. The objectives and characteristics of ETF are similar to Index mutual funds managed by asset management companies. Index funds attempt to replicate performance of chosen market index. The difference between the theoretical return of target index and returns of index fund is called as tracking error. One can think of ETFs as index mutual funds that can be bought and sold in real-time at a price that changes throughout the day. The difference between these two asset classes is that unlike index mutual funds which trade at the end of the day at NAV, ETFs trade at real-time on stock exchanges, and hence, investors can derive the benefit of trade-in ETF just like any ordinary stocks, which means they are easier to buy and sell quickly, if need be. Secondly, ETFs are available only on stock exchanges. Hence, one needs a demat account to invest in an ETF, whereas for an index mutual fund, one doesn’t need a demat account and may buy or sell the units directly from the mutual fund in small amounts.
Though there is no difference in the composition of index mutual funds and ETFs, there is a significant difference as far as formation and redemption of ETFs is concerned. As a result, ETFs are more tax-efficient and also carry less expense ratio compared to most index mutual funds.
Nifty BeES (Nifty Benchmark Exchange Traded Scheme) based on the Nifty 50 index was the first ETF launched in India in December 2001 by Benchmark Mutual Fund. Although index investing is at a nascent stage in India, it has experienced a notable momentum, mainly because of institutional investors and Government initiatives. The recent decisions of the Government of India to consent Employees’ Provident Fund Organisation to invest the incremental surplus into equity ETFs, and also to use the ETF route for disinvestment have further given a push to ETFs in India.
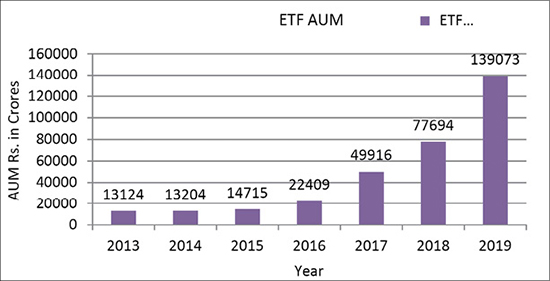
Figure 1. Asset Under Management (AUM) of ETFs in India (in Crores)
Source: Compiled from AMFI newsletters.
As per the Association of Mutual Funds in India (AMFI) industry trends June 2019 report, ETFs derived 94% of their assets from institutional investors and only 6% from individual investors. As individual and institutional investors tend to diversify their investments across different markets, the result of the study would be crucial for investors who look towards the ETF market for portfolio diversification. To attract individual investors, the Ministry of Finance and the Government of India have proposed to include ETFs investing in Central Public Sector Enterprises (CPSEs) in the Section 80C deduction of Income Tax Act in the Union Budget of 2019-2020. Besides, the market regulator, Securities and Exchange Board of India (SEBI), has restricted the Total Expense Ratio (TER) of index mutual funds and ETFs to 1% to drive cost down for investors. In India, Equity, Debt, Gold and International Indices ETFs are available for trade. As of May 2019, there are a total of 79 ETFs listed on the Indian stock market.
ETF creation/redemption mechanism
The key to understanding how ETFs work is the creation/redemption mechanism. When an ETF company wants to create new shares of its fund, whether to launch a new product or to meet increasing market demand, it approaches an authorized participant (AP). An AP may be a market maker, a specialist, or any other large financial institution with a lot of buying power. It is market maker’s duty to acquire the shares that the ETF wants to hold. For instance, if an ETF is designed to track the NSE Nifty 50 index, the market maker will buy shares in all the NSE Nifty 50 constituents in the exact proportion as the index, then deliver those shares to the ETF provider. In exchange, the provider gives the market maker a block of equally valued ETF shares, called a creation unit. The market maker delivers a certain amount of underlying securities and receives the same value in ETF shares, price based on their net asset value and not the market value at which ETF happens to be trading. It is beneficial for both parties; the ETF provider gets the stocks it needs to track the index, and the market maker receives ETF shares to resell on exchange for a profit. The redemption process works in reverse. Market makers can remove ETF shares from the market by purchasing enough of those shares to form a creation unit and then delivering those shares to the ETF issuer. In exchange, the market maker receives the same value in the underlying securities of the fund. The creation/redemption process is vital for the ETF. It is the process that keeps share prices trading in line with the fund’s underlying net asset value. Because an ETF trades like a stock, its price will fluctuate during the trading hours, due to market demand and supply. For instance, when the demand for ETF shares increases, the ETF’s share price may rise above the value of its underlying securities. When this happens, it is the market maker who intervenes. Recognising the overpriced ETF, the market maker might buy up the underlying shares that compose the ETF and then sell ETF shares on the open market. This exercise helps drive the ETF’s share market price back toward net asset value, while the market maker earns a risk free arbitrage profit.
Likewise, if the ETF starts trading at a discount to the securities it holds, the market maker can buy ETF shares equal to the creation unit on the cheap and redeem them for the underlying securities, which can be resold on the exchange. By buying up the undervalued ETF shares, the AP drives the market price of the ETF back towards net asset value while once again making a risk-free arbitrage profit. The arbitrage mechanism helps to keep an ETF’s market price in line with the net asset value of its underlying portfolio. With multiple market makers watching most ETFs, ETF market price typically stays in line with its net asset value.
2. Premium/Discount, arbitrage and pricing efficiency
ETF trades at a premium if its market price is higher than the NAV, and at a discount, if the market price is lower than the NAV. This price difference may have significant repercussions to investors, as it represents a cost if they buy overvalued ETF shares or sell undervalued ETF shares (Charteris, 2013). Pricing efficiency is the speed at which the market makers correct the deviations between ETFs NAV and the market price. Tse et al. (2006) indicated that a perfectly efficient market provides greater liquidity, lower transaction costs, and fewer restrictions, which plays a vital role in price discovery into the stock market index and its derivatives. Thus, the present study attempts to investigate the pricing efficiency of Indian equity ETFs employing an autoregression model over its price deviation, and also attempts to understand the lead-lag relationship between ETF price and NAV using the vector error correction model (VECM). Our study considers a large pool of ETFs that track different indices, including foreign market indices. The present research bridges the gap by extending the sample to all the equity ETFs listed in India. The study is aimed to contribute significantly to the finance literature and assist market regulators, fund houses, market makers and research analysts in evaluating the Indian ETF market.
3. Literature review
The earliest literature on ETFs by Elton et al. (2002), Poterba et al. (2002), Blitz and Huij (2012), Rompotis (2009) attempts to understand the performance of index funds with regard to its returns and tracking ability of the chosen market index. Gallagher and Segara (2005) examined the ability of ETFs on the Australian stock exchange to track the underlying benchmark index and to provide a comparison of the tracking error volatility. Wong and Shum (2010) examined the performance of 15 worldwide ETFs across bullish and bearish markets.
3.1 Literature on pricing efficiency
DeFusco et al. (2011) studied the pricing deviations of Spider, Diamonds, and Cubes from the price of the underlying index. The study applied summary statistics, simple OLS regression, and VECM model to analyze the data. The study found that their price deviation is predictable and nonzero. Marshall et al. (2013) analyzed the SPDR S&P 500 and iShares Core S&P 500 ETF for the period of February 2001 to August 2010. The study found that spreads increase just before arbitrage opportunities, consistent with a decrease in liquidity. The study also found that the ETFs have a daily return correlation of 0.99, and deviations correct back following mispricing.
Miu et al. (2013) examined the informational efficiency of prices of 273 ETFs that actively trade on the NYSE Arca, based on short-horizon return predictability from past order flows. The study found that price adjustments to new information for ETFs occur in about 30 minutes. The research also shows that the speed of convergence to market efficiency of ETFs is not only significantly driven by volume, but also by the probability of informed trading. Hilliard (2014) studied the ETF premium/discount process and determinants of domestic equity, international equity, commodity, taxable bond, currency, and municipal bond ETFs domiciled in the United States from April 2010 to April 2011. The study found that emerging market ETFs tend to have more significant and more persistent premiums than developed market ETFs. The study also documented illiquidity of underlying assets, higher volatility of the emerging markets, higher bid-ask spreads, and other market frictions as factors for mispricing of ETFs. Kreis and Licht (2018) analyzed deviations in the European ETF markets using gross and net returns of a long-short trading strategy in the capital asset pricing model. The study found a positive gross excess returns for the long-short strategy in all sample periods. Lin et al. (2006) investigated the pricing efficiency of Taiwan Top 50 Tracker Fund (TTT) using the deviation of price from the NAV and the absolute value of mispricing. The study found TTT tends to sell at a premium; however, the premium is not significant.
Kayali (2007) investigated the pricing deviations of price from NAV of the Dow Jones Istanbul 20 (DJIST) for one year and found that DJIST trades at a smaller discount on average, and premiums or discounts do not persist over time and disappear within two days. Shin and Soydemir (2010) estimated tracking errors from 26 ETFs utilizing three different methods and found that tracking errors are significantly different from zero and display persistence. The study using serial correlation tests, runs tests, and panel regression analysis also found greater persistence in ETFs price deviation. Shanmugham and Zabiulla (2012) examined the pricing efficiency of Nifty BeES in bullish and bearish market conditions using data for seven years. The study found that price divergence disappears within three days due to the arbitrage mechanism. Charteris (2013) examined the pricing efficiency of domestic and foreign ETFs listed in South Africa and found that two out of seven funds were trading at a discount and remaining at a premium. The study also suggests that differences, however, do not persist for more than two trading days. Charteris et al. (2014) investigated the extent to which ETFs premiums and discounts motivate feedback trading in emerging markets using a sample of index ETFs. The study provides evidence denoting that feedback trading grows significantly in the presence of lagged premiums, and is more widespread when lagged premiums increase in magnitude.
Swathy (2015) investigated the pricing efficiency of five ETFs of Benchmark/Goldman Sachs asset management company listed on NSE, India. The study period is from 2010 to 2015. The data were analyzed using regression analysis; it was found that premiums and discounts do not persist over time and, thus, the ETF market was found to be efficient. Bas and Sarioglu (2015) evaluated the tracking error and pricing efficiency of 16 ETFs between 2005 and 2013 operating in the Turkish Capital markets. The pricing efficiencies were computed using the average premium and discount and found to be efficient. Aditya and Desai (2015) examined the pricing efficiency and price discovery of equity index ETFs in India. The result showed that Indian ETFs take a minimum of 4 days and a maximum of 10 days for the differential between the NAV and price to disappear. Kumar (2018) investigated the pricing efficiency of CPSE ETF listed on the National Stock Exchange India. The researcher employed simple linear regression to understand the relationship between net asset value and the market price of ETF. The researcher also made use of descriptive statistics to analyze pricing efficiency and concluded that during the study period CPSE ETF traded at a discount, but the discount was economically insignificant for the market participant to profit from the arbitrage opportunity.
4. Methodology and Data
The present study makes use of various statistical and econometric tools and techniques to support the analysis and to achieve the objectives framed. Such methods are briefly explained to get an understanding of the relevance of these techniques in the present study, and equations are incorporated to support the analysis.
The study attempts to investigate the pricing efficiency of domestic equity index ETFs listed on the National Stock Exchange and Bombay Stock Exchange. As different funds have different inception dates, the researchers feel it will be inappropriate to examine the pricing efficiency of ETFs across different time horizons. Figure 1 shows the substantial inflow of funds to the ETFs, especially from 2017 to 2019, which may have a considerable impact on the performance of ETFs. As such, we study the pricing efficiency of the selected ETFs for two years, i.e., from April 2017 to March 2019. Table 1 shows the characteristics of the selected ETFs.
The daily closing price of ETFs was sourced from the National Stock Exchange and Bombay Stock Exchange. The daily Net Asset Value of ETFs was sourced from the Association of Mutual Funds in India (AMFI). The data cleaning process was undertaken for missing values, and the price deviation series, for further research, was calculated as the difference between the daily closing price of an ETF and its daily NAV.
Table I: Characteristics of selected ETFs
|
Sr. No. |
ETF |
Issuer |
Underlying Index |
Inception Date |
|
01 |
Aditya Birla Sun Life Nifty ETF |
Aditya Birla Sun Life Mutual Fund |
NIFTY 50 TRI |
21-Jul-11 |
|
02 |
Edelweiss ETF - Nifty 100 Quality 30 |
Edelweiss Mutual Fund |
NIFTY 100 Quality 30 TRI |
25-May-16 |
|
03 |
Edelweiss ETF - Nifty Bank |
Edelweiss Mutual Fund |
NIFTY Bank TRI |
15-Dec-15 |
|
04 |
Edelweiss ETF - Nifty 50 |
Edelweiss Mutual Fund |
NIFTY 50 TRI |
08-May-15 |
|
05 |
HDFC Nifty 50 ETF |
HDFC Mutual Fund |
NIFTY 50 TRI |
09-Dec-15 |
|
06 |
HDFC Sensex ETF |
HDFC Mutual Fund |
S&P BSE Sensex TRI |
09-Dec-15 |
|
07 |
ICICI Prudential Nifty 100 ETF |
ICICI Prudential Mutual Fund |
NIFTY 100 TRI |
20-Aug-13 |
|
08 |
ICICI Prudential Nifty ETF |
ICICI Prudential Mutual Fund |
NIFTY 50 TRI |
20-Mar-13 |
|
09 |
ICICI Prudential NV20 ETF |
ICICI Prudential Mutual Fund |
NIFTY 50 Value 20 TRI |
17-Jun-16 |
|
10 |
ICICI Prudential Sensex ETF |
ICICI Prudential Mutual Fund |
S&P BSE Sensex TRI |
10-Jan-03 |
|
11 |
IDFC Nifty ETF |
IDFC Mutual Fund |
NIFTY 50 TRI |
07-Oct-16 |
|
12 |
IDFC Sensex ETF |
IDFC Mutual Fund |
S&P BSE Sensex TRI |
07-Oct-16 |
|
13 |
Invesco India Nifty ETF |
Invesco Mutual Fund |
NIFTY 50 TRI |
13-Jun-11 |
|
14 |
Kotak Banking ETF |
Kotak Mahindra Mutual Fund |
NIFTY Bank TRI |
04-Dec-14 |
|
15 |
Kotak Nifty ETF |
Kotak Mahindra Mutual Fund |
NIFTY 50 TRI |
02-Feb-10 |
|
16 |
Kotak PSU Bank ETF |
Kotak Mahindra Mutual Fund |
NIFTY PSU Bank TRI |
08-Nov-07 |
|
17 |
Kotak Sensex ETF |
Kotak Mahindra Mutual Fund |
S&P BSE Sensex TRI |
06-Jun-08 |
|
18 |
LIC MF Exchange Traded Fund-Nifty 50 |
LIC Mutual Fund |
NIFTY 50 TRI |
20-Nov-15 |
|
19 |
LIC MF Exchange Traded Fund-Nifty 100 |
LIC Mutual Fund |
NIFTY 100 TRI |
17-Mar-16 |
|
20 |
LIC MF Exchange Traded Fund-Sensex |
LIC Mutual Fund |
S&P BSE Sensex TRI |
30-Nov-15 |
|
21 |
Motilal Oswal M50 ETF |
Motilal Oswal Mutual Fund |
NIFTY 50 TRI |
28-Jul-10 |
|
22 |
Motilal Oswal Midcap 100 ETF |
Motilal Oswal Mutual Fund |
NIFTY Midcap 100 TRI |
31-Jan-11 |
|
23 |
Motilal Oswal Nasdaq 100 ETF |
Motilal Oswal Mutual Fund |
Nasdaq 100 |
29-Mar-11 |
|
24 |
Quantum Nifty ETF |
Quantum Mutual Fund |
NIFTY 50 TRI |
10-Jul-08 |
|
25 |
Nippon ETF Bank BeES |
Nippon Mutual Fund |
NIFTY Bank TRI |
27-May-04 |
|
26 |
Nippon ETF Hang Seng BeES |
Nippon Mutual Fund |
HangSeng |
09-Mar-10 |
|
27 |
Nippon ETF Infra BeES |
Nippon Mutual Fund |
NIFTY Infrastructure TRI |
29-Sep-10 |
|
28 |
Nippon ETF Junior BeES |
Nippon Mutual Fund |
NIFTY Next 50 TRI |
21-Feb-03 |
|
29 |
Nippon ETF Nifty 100 |
Nippon Mutual Fund |
NIFTY 100 TRI |
22-Mar-13 |
|
30 |
Nippon ETF Nifty BeES |
Nippon Mutual Fund |
NIFTY 50 TRI |
28-Dec-01 |
|
31 |
Nippon ETF NV20 ETF |
Nippon Mutual Fund |
NIFTY 50 Value 20 TRI |
08-Jun-15 |
|
32 |
Nippon ETF PSU Bank BeES |
Nippon Mutual Fund |
NIFTY PSU Bank TRI |
25-Oct-07 |
|
33 |
Nippon ETF Sensex |
Nippon Mutual Fund |
S&P BSE Sensex TRI |
24-Sep-14 |
|
34 |
SBI-ETF BSE 100 |
SBI Mutual Fund |
S&P BSE 100 TRI |
16-Mar-15 |
|
35 |
SBI-ETF Nifty 50 |
SBI Mutual Fund |
NIFTY 50 TRI |
23-Jul-15 |
|
36 |
SBI-ETF Nifty Next 50 |
SBI Mutual Fund |
NIFTY Next 50 TRI |
16-Mar-15 |
|
37 |
SBI-ETF Nifty Bank |
SBI Mutual Fund |
NIFTY Bank TRI |
20-Mar-15 |
|
38 |
UTI NIFTY Exhcange Traded Fund |
UTI Mutual Fund |
NIFTY 50 TRI |
03-Sep-15 |
|
39 |
UTI SENSEX Exchange Traded Fund |
UTI Mutual Fund |
S&P BSE Sensex TRI |
03-Sep-15 |
Authors’ compilation
The arbitrage persistence was captured to check for the pricing efficiency of ETFs. Arbitrage is the simultaneous buying and selling securities to take advantage of a price difference. The presence of arbitrage is denoted by the price deviation between the market price of the ETF and its NAV. The price deviation is equated as (1)
D = Pt – NAVt (1)
where
D – price deviation
Pt – closing price of the ETF and,
NAVt – NAV of the ETF.
If D is negative, the fund is said to be trading at a discount to its NAV and, at a premium, if it is positive.
To begin with, we made use of summary statistics to analyse and understand the nature of the obtained price deviation series. The summary statistics shows the number of observations for each ETF, its mean deviation amount, minimum deviation amount, maximum deviation amount, standard deviation, skewness, and kurtosis of the data series. The mean implies average price deviation during the period. Standard deviation measures the variations in the data set. A low standard deviation indicates that value doesn’t vary much from the mean of the data set and is favorable for the study. Skewness is a measure of the symmetry in distribution. In skewness, we know that the data set is symmetrical if β1 is equal to 0, positively skewed if β1 is more than 1, and negatively skewed if β1 is less than 1. Kurtosis is a statistical measure that defines how heavily the tails of distribution differ from the tails of a normal distribution. It identifies whether the tails of a given distribution contain extreme values. Skewness essentially measures the symmetry of the distribution, while kurtosis determines the heaviness of the distribution tails.
The data being in the nature of time series, we performed the Augmented Dickey-Fuller (ADF) test to check whether the deviation series is stationary or non-stationary. If the time series has a unit root, it shows a systematic pattern that provides unpredictable results.
In order to measure the persistence of premium/discount, the premium/discount series so obtained (i.e., the difference between the closing price and NAV) was regressed against its lagged value. The following equation was used for the same (2):
D = Φ0 + Φ1 Dt–1 + εt (2)
An insignificant value for Φ1 indicates that the premium or discount does not persist and disappears within one trading day. A significant value would suggest that deviation persists and can be taken advantage of by the investors. The persistence of deviation was analyzed using an autoregression model and by adding additional lagged values of the obtained price deviation as the explanatory variable (Kayali, 2007; Charteris, 2013). Because the regression model uses data from the same input variable at previous time steps, it is known as autoregression (regression of self) model. The autoregression model with two lags would be as follows:
D = Φ0 + Φ1 Dt–1 + Φ2 Dt–2 + εt (3)
The market maker of the fund does the creation and deletion of ETF units in the primary market at the close of each trading day; hence, the premium/discount, if any, should disappear within one trading day. If the price deviation persists for two or more days, then investors can take advantage of these differences (Charteris, 2013).
To understand any long-run relationship between the NAV and the price of ETFs, we made use of the co-integration technique. Two time series are co-integrated if both are integrated of the same order, or there is a linear combination of the two time series. When the price and the NAV are not stationary at levels but are stationary at the first difference, then both are said to be integrated at the same order. Using the Johansen co-integration test, the study finds the existence of a co-integration relationship between the two price series. The order lag selection was based on Akaike information criteria. As both the price and NAV variables were transformed into their log form to correct for the trend, the researchers made use of no-constant and no-trend models in the co-integration tests.
The study makes use of the VECM analysis to examine the short-term dynamics between the integrated variables. Having identified the presence of the cointegrating vector between the market price and NAV using the Johansen co-integration test, the VECM was applied to determine the lead and lag indicators among NAV and market price. The Law of one price (LOOP) necessitates the market price and NAV to be equal, but it is vital to identify how the market price and NAV move back to the equilibrium level. This process is known as the price discovery process (Aditya & Dessai, 2015). The VECM provides the error correction coefficient for both the variable’s market price and NAV. The higher the error coefficient, the greater the amplitude of deviation from the long-run equilibrium. This signifies that the variable with a lower error coefficient is more efficient in reaching the long-run equilibrium and hence leads the subsequent variable. Being the lead indicator, the variable with a lower error coefficient will move to the point of equilibrium long before the other variable. With this, the historical information of the lead variable can be used effectively to predict the moment of the lag variable.
Tests like autoregression, Augmented dickey fuller unit root tests, Johansen’s co-integration, and VECM were done using the EViews 10 econometrics package. The Microsoft excel was used for cleaning and arranging the data.
5. Results and Discussion
5.1 Summary Statistics
Table 2 summarizes the summary statistics of the price deviation series of the selected ETFs listed in India. The mean, the measure of performance herein is used to indicate the average price deviation of the respective ETF. The mean value signifies, on average, 26 ETFs trade at a premium and remaining 13 at a discount. The standard deviation reflects the variation in data over a period of time. During the study period, the lowest deviation of ₹ -1531.60 and the highest deviation of ₹ 2286.80 is witnessed for Edelweiss ETF - Nifty 50. The summary statistic results are provided to know the nature of the data before proceeding with the advanced analysis.
5.2 Test of Stationarity
Table 3 reflects the results of the ADF test to check for the presence of unit root in the price deviation series. The results indicate data to be stationary, as the null hypothesis gets rejected at various levels of significance. The ADF tests result is considered to be favorable in the present context of the study for applying the autoregression model.
Table 2. Summary statistics for the ETF price deviation from NAV
|
Price Deviation |
No. |
Mean |
Standard |
Minimum |
Maximum |
β1 |
β2 |
|
Aditya Birla Sun Life Nifty ETF |
476 |
-2.439 |
4.3686 |
-13.03 |
13.18 |
0.66441 |
4.202456 |
|
Edelweiss ETF - Nifty 100 Quality 30 |
438 |
0.937 |
14.778 |
-35.28 |
50.62 |
0.145023 |
3.115829 |
|
Edelweiss ETF - Nifty Bank |
219 |
24.642 |
210.191 |
-360.610 |
623.830 |
0.612290 |
2.727001 |
|
Edelweiss ETF - Nifty 50 |
300 |
432.340 |
877.977 |
-1531.600 |
2286.800 |
0.400961 |
2.134940 |
|
HDFC Nifty 50 ETF |
492 |
0.368 |
3.363 |
-9.68 |
14.38 |
0.230137 |
3.314606 |
|
HDFC Sensex ETF |
387 |
9.703 |
48.713 |
-208.61 |
443.76 |
1.785973 |
22.79009 |
|
ICICI Prudential Nifty 100 ETF |
492 |
0.010 |
0.887 |
-4.53 |
13.40 |
10.62029 |
15.83337 |
|
ICICI Prudential Nifty ETF |
492 |
-0.018 |
0.201 |
-0.80 |
1.35 |
1.625165 |
11.52834 |
|
ICICI Prudential NV20 ETF |
474 |
0.048 |
0.359 |
-0.41 |
5.25 |
11.17651 |
14.81937 |
|
ICICI Prudential Sensex ETF |
454 |
0.559 |
4.174 |
-25.90 |
60.69 |
8.594035 |
12.9029 |
|
IDFC Nifty ETF |
437 |
-0.549 |
1.70 |
-5.10 |
15.72 |
1.643058 |
21.88400 |
|
IDFC Sensex ETF |
237 |
0.516 |
10.590 |
-32.68 |
54.95 |
0.094295 |
7.662840 |
|
Invesco India Nifty ETF |
304 |
-10.607 |
34.271 |
-109.72 |
204.81 |
1.574873 |
15.63658 |
|
Kotak Banking ETF |
492 |
0.038 |
1.194 |
-3.59 |
17.26 |
6.539400 |
91.08754 |
|
Kotak Nifty ETF |
492 |
-2.027 |
41.034 |
-910.17 |
3.84 |
-22.0987 |
49.57129 |
|
Kotak PSU Bank ETF |
492 |
-0.033 |
2.973 |
-43.450 |
12.461 |
-7.67720 |
109.2490 |
|
Kotak Sensex ETF |
463 |
-0.272 |
2.683 |
-7.94 |
34.86 |
4.856173 |
65.62305 |
|
LIC MF Exchange Traded Fund-Nifty 50 |
491 |
0.318 |
1.720 |
-4.49 |
21.94 |
5.012660 |
58.14398 |
|
LIC MF Exchange Traded Fund-Nifty 100 |
301 |
-1.994 |
4.211 |
-14.31 |
13.22 |
0.019800 |
3.899207 |
|
LIC MF Exchange Traded Fund-Sensex |
241 |
-1.707 |
15.494 |
-43.11 |
66.91 |
0.767681 |
4.819938 |
|
Motilal Oswal M50 ETF |
492 |
-0.598 |
1.170 |
-4.47 |
5.03 |
1.267274 |
7.173300 |
|
Motilal Oswal Midcap 100 ETF |
492 |
0.367 |
0.560 |
-0.58 |
2.22 |
1.047816 |
3.446090 |
|
Motilal Oswal Nasdaq 100 ETF |
491 |
47.955 |
40.132 |
-26.38 |
134.97 |
0.005199 |
1.588470 |
|
Quantum Nifty ETF |
299 |
-2.198 |
7.222 |
-84.13 |
17.28 |
-4.88200 |
57.44774 |
|
Nippon ETF Bank BeES |
492 |
0.564 |
5.115 |
-12.93 |
22.51 |
0.324278 |
3.212168 |
|
Nippon ETF Hang Seng BeES |
451 |
114.093 |
222.76 |
-298.15 |
705.94 |
0.455465 |
2.253202 |
|
Nippon ETF Infra BeES |
492 |
-0.036 |
2.047 |
-25.80 |
14.41 |
-3.00454 |
58.4135 |
|
Nippon ETF Junior BeES |
492 |
0.283 |
0.61 |
-1.29 |
2.55 |
-0.30433 |
2.666938 |
|
Nippon ETF Nifty 100 |
481 |
0.080 |
0.647 |
-1.606 |
7.655 |
3.50708 |
40.8274 |
|
Nippon ETF Nifty BeES |
492 |
-0.156 |
1.792 |
-3.84 |
4.20 |
0.22818 |
1.93609 |
|
Nippon ETF NV20 ETF |
327 |
1.757 |
3.256 |
-9.14 |
25.15 |
2.11920 |
16.5618 |
|
Nippon ETF PSU Bank BeES |
492 |
0.101 |
2.949 |
-48.20 |
11.32 |
-11.1115 |
171.867 |
|
Nippon ETF Sensex |
211 |
0.394 |
5.141 |
-14.34 |
64.86 |
9.21374 |
118.811 |
|
SBI-ETF BSE 100 |
436 |
0.483 |
1.523 |
-3.11 |
9.68 |
3.09641 |
14.9819 |
|
SBI-ETF Nifty 50 |
492 |
0.105 |
0.257 |
-0.61 |
1.96 |
1.75957 |
12.6846 |
|
SBI-ETF Nifty Next 50 |
492 |
0.472 |
1.135 |
-3.79 |
10.97 |
1.13557 |
2.58135 |
|
SBI-ETF Nifty Bank |
492 |
0.177 |
0.680 |
-1.65 |
8.12 |
3.13115 |
39.6630 |
|
UTI NIFTY Exhcange Traded Fund |
470 |
1.308 |
7.247 |
-19.38 |
66.21 |
2.48771 |
22.5519 |
|
UTI SENSEX Exchange Traded Fund |
290 |
3.001 |
12.225 |
-52.36 |
50.201 |
-0.487 |
8.57397 |
Source: Compiled using EViews and MS Excel
Note: β1 and β2 represent skewness and kurtosis, respectively.
Table 3. Result of stationarity test of price deviation series
|
ETF |
t-statistics |
ETF |
t-statistics |
|
Aditya Birla Sun Life Nifty ETF |
-4.12903 *** |
Motilal Oswal M50 ETF |
-7.921*** |
|
Edelweiss ETF - Nifty 100 Quality 30 |
-3.533*** |
Motilal Oswal Midcap 100 ETF |
-3.662*** |
|
Edelweiss ETF - Nifty Bank |
-3.068** |
Motilal Oswal Nasdaq 100 ETF |
-19.759*** |
|
Edelweiss ETF - Nifty 50 |
-2.941** |
Quantum Nifty ETF |
-12.225*** |
|
HDFC Nifty 50 ETF |
-7.760*** |
Nippon ETF Bank BeES |
-9.475*** |
|
HDFC Sensex ETF |
-15.790*** |
Nippon ETF Hang Seng BeES |
-2.935** |
|
ICICI Prudential Nifty 100 ETF |
-22.439*** |
Nippon ETF Infra BeES |
-20.629*** |
|
ICICI Prudential Nifty ETF |
-9.552*** |
Nippon ETF Junior BeES |
-4.893*** |
|
ICICI Prudential NV20 ETF |
-12.421*** |
Nippon ETF Nifty 100 |
-10.016*** |
|
ICICI Prudential Sensex ETF |
-15.023*** |
Nippon ETF Nifty BeES |
-12.891*** |
|
IDFC Nifty ETF |
-14.317*** |
Nippon ETF NV20 ETF |
-13.284*** |
|
IDFC Sensex ETF |
-12.412*** |
Nippon ETF PSU Bank BeES |
-14.178*** |
|
Invesco India Nifty ETF |
-18.842*** |
Nippon ETF Sensex |
-13.428*** |
|
Kotak Banking ETF |
-15.029*** |
SBI-ETF BSE 100 |
-6.267*** |
|
Kotak Nifty ETF |
-22.121*** |
SBI-ETF Nifty 50 |
-10.258*** |
|
Kotak PSU Bank ETF |
-14.944*** |
SBI-ETF Nifty Next 50 |
-12.660*** |
|
Kotak Sensex ETF |
-12.895*** |
SBI-ETF Nifty Bank |
-19.475*** |
|
LIC MF Exchange Traded Fund-Nifty 50 |
-19.865*** |
UTI NIFTY Exhcange Traded Fund |
-11.695*** |
|
LIC MF Exchange Traded Fund-Nifty 100 |
-7.260*** |
UTI SENSEX Exchange Traded Fund |
-5.561*** |
|
LIC MF Exchange Traded Fund-Sensex |
-4.613*** |
|
|
Source: Compiled using EViews and MS Excel
Note: ***, ** indicate significance at 1% and 5% confidence levels, respectively.
5.3 Autoregression (AR) analysis
The result of the autoregression (AR) analysis is displayed in Table 4. The intercept estimate of this regression model should closely approximate the average difference between the market price and the NAV of the ETF. The average percentage deviation captured by the intercept for 12 ETFs is negative, which shows that these funds trade at a discount to their NAV, whereas the remaining 27 ETFs trade at a premium to their NAV. However, intercept values are significant only for 25 out of 39 ETFs. For eight funds (ICICI Prudential Nifty 100 ETF, ICICI Prudential NV20 ETF, ICICI Prudential Sensex ETF, Kotak Nifty ETF, Kotak Sensex ETF, Quantum Nifty ETF, Nippon ETF Infra BeES, Nippon ETF Sensex), the coefficient on the first day was insignificant, thereby indicating that the premium/discount disappears within one day.
Table 4. Persistence in the price deviations
|
Sr. No. |
ETF |
Φ0 |
Φ1 |
Φ2 |
Φ3 |
Φ4 |
|
1 |
Aditya Birla Sun Life Nifty ETF |
−0.281*** |
0.518*** |
0.288*** |
0.064 |
|
|
2 |
Edelweiss ETF - Nifty 100 Quality 30 |
0.185*** |
0.533*** |
0.141*** |
0.79 |
|
|
3 |
Edelweiss ETF - Nifty Bank |
2.144 |
0.594*** |
-0.230 |
|
|
|
4 |
Edelweiss ETF - Nifty 50 |
96.790** |
0.438*** |
0.198*** |
0.085 |
|
|
5 |
HDFC Nifty 50 ETF |
0.111 |
0.289*** |
0.137** |
0.090** |
0.085 |
|
6 |
HDFC Sensex ETF |
7.647*** |
0.194*** |
0.031 |
|
|
|
7 |
ICICI Prudential Nifty 100 ETF |
0.010 |
-0.014 |
|
|
|
|
8 |
ICICI Prudential Nifty ETF |
-0.008 |
0.445*** |
0.148*** |
-0.033 |
|
|
9 |
ICICI Prudential NV20 ETF |
0.048*** |
-0.005 |
|
|
|
|
10 |
ICICI Prudential Sensex ETF |
0.555*** |
0.006 |
|
|
|
|
11 |
IDFC Nifty ETF |
-0.280*** |
0.496*** |
-0.009 |
|
|
|
12 |
IDFC Sensex ETF |
0.389 |
0.213*** |
0.042 |
|
|
|
13 |
Invesco India Nifty ETF |
-3.110*** |
0.366*** |
0.148*** |
0.153*** |
0.004 |
|
14 |
Kotak Banking ETF |
0.038 |
0.233*** |
0.153*** |
0.103 |
|
|
15 |
Kotak Nifty ETF |
-2.026 |
-0.000 |
|
|
|
|
16 |
Kotak PSU Bank ETF |
-0.028 |
0.345*** |
-0.124*** |
-0.043 |
|
|
17 |
Kotak Sensex ETF |
-0.259*** |
0.040 |
|
|
|
|
18 |
LIC MF Exchange Traded Fund-Nifty 50 |
0.263*** |
0.096** |
0.08 |
|
|
|
19 |
LIC MF Exchange Traded Fund-Nifty 100 |
-0.510*** |
0.636*** |
0.089 |
|
|
|
20 |
LIC MF Exchange Traded Fund-Sensex |
-0.700*** |
0.476*** |
0.106 |
|
|
|
21 |
Motilal Oswal M50 ETF |
-0.171*** |
0.445*** |
0.190*** |
0.072 |
|
|
22 |
Motilal Oswal Midcap 100 ETF |
0.02** |
0.71*** |
0.155*** |
0.062 |
|
|
23 |
Motilal Oswal Nasdaq 100 ETF |
0.813 |
0.887*** |
0.093 |
|
|
|
24 |
Quantum Nifty ETF |
-2.164*** |
0.011 |
|
|
|
|
25 |
Nippon ETF Bank BeES |
0.307 |
0.285*** |
0.203*** |
0.043 |
|
|
26 |
Nippon ETF Hang Seng BeES |
4.218** |
0.743*** |
0.130** |
0.08 |
|
|
27 |
Nippon ETF Infra BeES |
-0.029 |
0.049 |
|
|
|
|
28 |
Nippon ETF Junior BeES |
0.125*** |
0.264*** |
0.085 |
|
|
|
29 |
Nippon ETF Nifty 100 |
0.067** |
0.155*** |
-0.009 |
|
|
|
30 |
Nippon ETF Nifty BeES |
-0.062 |
0.434*** |
0.095** |
0.040 |
|
|
31 |
Nippon ETF NV20 ETF |
1.030*** |
0.244*** |
0.088 |
|
|
|
32 |
Nippon ETF PSU Bank BeES |
0.071 |
0.450*** |
-0.156*** |
0.014 |
|
|
33 |
Nippon ETF Sensex |
0.375 |
0.071 |
|
|
|
|
34 |
SBI-ETF BSE 100 |
0.092** |
0.594*** |
0.105 |
|
|
|
35 |
SBI-ETF Nifty 50 |
0.049*** |
0.345*** |
0.093** |
0.114*** |
-0.015 |
|
36 |
SBI-ETF Nifty Next 50 |
0.332*** |
0.142*** |
0.108*** |
0.056 |
|
|
37 |
SBI-ETF Nifty Bank |
0.139*** |
0.111*** |
0.089** |
0.035 |
|
|
38 |
UTI NIFTY Exhcange Traded Fund |
0.844*** |
0.209*** |
0.112*** |
0.050 |
|
|
39 |
UTI SENSEX Exchange Traded Fund |
2.512*** |
0.463*** |
-0.102 |
|
|
Source: Compiled using EViews and MS Excel
Note: ***, **, * indicate significance at 1%, 5% and 10% confidence levels, respectively.
Thirteen funds, which include Edelweiss ETF – Nifty Bank, HDFC Sensex ETF, IDFC Nifty ETF, IDFC Sensex ETF, LIC MF Exchange Traded Fund-Nifty 50, LIC MF Exchange Traded Fund-Nifty 100, LIC MF Exchange Traded Fund-Sensex, Motilal Oswal Nasdaq 100 ETF, Nippon ETF Junior BeES, Nippon ETF Nifty 100, Nippon ETF NV20 ETF, SBI-ETF BSE 100, and UTI SENSEX Exchange Traded Fund, took two days for the deviation to disappear. For three funds, which include HDFC Nifty 50 ETF, Invesco India Nifty ETF, and SBI-ETF Nifty 50, the coefficient on fourth lag was insignificant, thereby indicating that the premium or discount disappears within four days. The study found that from the sample, eight funds take one day, thirteen funds take two days, fifteen funds take three days, and three funds take four days for the market price to align back to its NAV. Our study documents that for equity ETFs listed in India it takes a minimum of one day and a maximum of four days for the price deviation to disappear. This finding is in contrast to previous studies made on Indian equity ETFs but during different time horizons. Aditya and Desai (2015), with a sample of seventeen ETFs, found that Indian ETFs take a minimum of four days and a maximum of ten days for the deviation between the market price and NAV to disappear. Our findings are partly consistent with Purohit and Malhotra (2015), who found that arbitrage opportunity in Indian equity ETF persists for an average of three days.
The sample also includes two funds tracking foreign market indices, Nasdaq 100 TRI representing the U.S. market, and Hang Seng TRI for the Hong Kong market. It is also interesting to see the role of arbitragers to set off the price deviation considering incongruity in timings of Indian stock markets vis-a-vis the foreign market. The study found the Motilal Oswal Nasdaq 100 ETF requires two days for its deviation to disappear, while Nippon ETF Hang Seng BeES needs three days to align price with NAV. Our finding is partly in line with Charteris (2013), who found that the deviation of domestic and foreign ETFs listed in South Africa does not persist for more than two days. The varying levels of pricing efficiency of ETFs tracking the same indices highlight the critical role to be played by each market-maker tied up with the fund house. The study also documents diverse levels of efficiency for the different ETF schemes belonging to the same fund house, posing a question on the role played by liquidity in the ETF market.
5.4 Unit root test
The study also attempts to understand the price discovery process between the market price and NAV of ETFs. The existence of a long-run relationship between the market price and NAV of ETFs needs to be examined before capturing the price discovery process of the ETFs. The long-run relationship can be examined by using the Johansen co-integration test. To check for the existence of any long-run relationship using the co-integration technique requires checking for the stationarity of data at the level. For the application of the co-integration technique, the data have to be non-stationary at the level and should be stationary at the same difference. The ADF test is used to test for stationarity of data. Table 5 presents the results of the ADF test applied on the levels and the first difference of ETFs daily market price and NAV series, respectively.
Evidence from ADF unit root tests suggests that market price and NAV get stationary at the first difference and at levels they are non-stationary as can be inferred from Table 5. This means that both the variables follow an I (1) process. Since both the series are integrated at the same order, the co-integration test can be applied to the price and NAV of the ETF.
Table 5. Unit root tests for the Price and NAV of ETF
|
Scheme name |
Price |
NAV |
||
|
Level |
First Diff |
Level |
First Diff |
|
|
Aditya Birla Sun Life Nifty ETF |
0.5325 |
0.0000 |
0.5862 |
0.0000 |
|
Edelweiss ETF - Nifty 100 Quality 30 |
0.7294 |
0.0000 |
0.6116 |
0.0000 |
|
Edelweiss ETF - Nifty Bank |
0.0707 |
0.0000 |
0.5744 |
0.0000 |
|
Edelweiss ETF - Nifty 50 |
0.1818 |
0.0000 |
0.3785 |
0.0000 |
|
HDFC Nifty 50 ETF |
0.6542 |
0.0000 |
0.5946 |
0.0000 |
|
HDFC Sensex ETF |
0.5015 |
0.0000 |
0.4323 |
0.0000 |
|
ICICI Prudential Nifty 100 ETF |
0.3523 |
0.0000 |
0.4207 |
0.0000 |
|
ICICI Prudential Nifty ETF |
0.5715 |
0.0000 |
0.5881 |
0.0000 |
|
ICICI Prudential NV20 ETF |
0.7527 |
0.0000 |
0.7172 |
0.0000 |
|
ICICI Prudential Sensex ETF |
0.4224 |
0.0000 |
0.5261 |
0.0000 |
|
IDFC Nifty ETF |
0.6311 |
0.0000 |
0.5143 |
0.0000 |
|
IDFC Sensex ETF |
0.5451 |
0.0000 |
0.6759 |
0.0000 |
|
Invesco India Nifty ETF |
0.1770 |
0.0000 |
0.5923 |
0.0000 |
|
Kotak Banking ETF |
0.9453 |
0.0000 |
0.7446 |
0.0000 |
|
Kotak Nifty ETF |
0.1873 |
0.0000 |
0.1920 |
0.0000 |
|
Kotak PSU Bank ETF |
0.3267 |
0.0000 |
0.2057 |
0.0000 |
|
Kotak Sensex ETF |
0.6338 |
0.0000 |
0.7490 |
0.0000 |
|
LIC MF Exchange Traded Fund-Nifty 50 |
0.3074 |
0.0000 |
0.6230 |
0.0000 |
|
LIC MF Exchange Traded Fund-Nifty 100 |
0.2276 |
0.0000 |
0.3881 |
0.0000 |
|
LIC MF Exchange Traded Fund-Sensex |
0.0772 |
0.0000 |
0.1881 |
0.0000 |
|
Motilal Oswal M50 ETF |
0.3671 |
0.0000 |
0.5768 |
0.0000 |
|
Motilal Oswal Midcap 100 ETF |
0.2390 |
0.0000 |
0.2377 |
0.0000 |
|
Motilal Oswal Nasdaq 100 ETF |
0.3898 |
0.0000 |
0.5897 |
0.0000 |
|
Quantum Nifty ETF |
0.2712 |
0.0000 |
0.2644 |
0.0000 |
|
Nippon ETF Bank BeES |
0.7875 |
0.0000 |
0.7503 |
0.0000 |
|
Nippon ETF Hang Seng BeES |
0.3689 |
0.0000 |
0.1847 |
0.0000 |
|
Nippon ETF Infra BeES |
0.3249 |
0.0000 |
0.2653 |
0.0000 |
|
Nippon ETF Junior BeES |
0.0707 |
0.0000 |
0.0774 |
0.0000 |
|
Nippon ETF Nifty 100 |
0.2650 |
0.0000 |
0.3474 |
0.0000 |
|
Nippon ETF Nifty BeES |
0.5878 |
0.0000 |
0.5929 |
0.0000 |
|
Nippon ETF NV20 ETF |
0.4992 |
0.0000 |
0.3576 |
0.0000 |
|
Nippon ETF PSU Bank BeES |
0.3122 |
0.0000 |
0.2075 |
0.0000 |
|
Nippon ETF Sensex |
0.2877 |
0.0000 |
0.4130 |
0.0000 |
|
SBI-ETF BSE 100 |
0.1692 |
0.0000 |
0.3016 |
0.0000 |
|
SBI-ETF Nifty 50 |
0.5870 |
0.0000 |
0.3713 |
0.0000 |
|
SBI-ETF Nifty Next 50 |
0.0682 |
0.0000 |
0.0704 |
0.0000 |
|
SBI-ETF Nifty Bank |
0.7166 |
0.0000 |
0.7403 |
0.0000 |
|
UTI NIFTY Exchange Traded Fund |
0.5802 |
0.0000 |
0.5776 |
0.0000 |
|
UTI SENSEX Exchange Traded Fund |
0.6656 |
0.0000 |
0.8370 |
0.0000 |
Source: Compiled using EViews and MS Excel
Note: Values in the table are P-values of ADF test.
5.5 Co-integration test
Results in Table 6 demonstrate the existence of only one co-integrating relationship between the market price and NAV during the period using the Johansen co-integration test. The lag selection is based upon the Akaike information criteria. Typically, one of the variables is used to normalize the co-integrating vector by fixing its coefficient at unity. We make use of market price as the normalizing (dependent) variable and NAV as an independent variable. The results of the Johansen co-integration test based on the trace test and the max-eigenvalue test are reported in Table 6. The results indicate that all ETFs show a long-run relationship between the price and NAV. Based on the results of the Johansen co-integration test, the null hypothesis that the price and NAV of Indian ETFs do not have any log run relationship gets rejected at the 5% significance level.
Table 6. Johansen Co-Integration Test: One Vector
|
Scheme name |
Co-Integrating Vector* |
Trace Test |
Max-Eigen Test |
Lags |
|
Aditya Birla Sun Life Nifty ETF |
None At most one |
(0.0002) (0.1003) |
(0.003) (0.1003) |
2 |
|
Edelweiss ETF - Nifty 100 Quality 30 |
None At most one |
(0.0377) (0.1016) |
(0.0630) (0.1016) |
4 |
|
Edelweiss ETF - Nifty Bank |
None At most one |
(0.0893) (0.0426) |
(0.2351) (0.0426) |
3 |
|
Edelweiss ETF - Nifty 50 |
None At most one |
(0.0121) (0.0264) |
(0.0542) (0.0264) |
14 |
|
HDFC Nifty 50 ETF |
None At most one |
(0.0000 (0.0930) |
(0.0000) (0.0930) |
3 |
|
HDFC Sensex ETF |
None At most one |
(0.0000 (0.0938) |
(0.0000 (0.0938) |
1 |
|
ICICI Prudential Nifty 100 ETF |
None At most one |
(0.0000 (0.0711) |
(0.0000 (0.0711) |
1 |
|
ICICI Prudential Nifty ETF |
None At most one |
(0.0000 (0.1261) |
(0.0000 (0.1261) |
2 |
|
ICICI Prudential NV20 ETF |
None At most one |
(0.0000 (0.2886) |
(0.0000 (0.2886) |
1 |
|
ICICI Prudential Sensex ETF |
None At most one |
(0.0000) (0.0872) |
(0.0000 (0.0872) |
1 |
|
IDFC Nifty ETF |
None At most one |
(0.0011) (0.0664) |
(0.0023) (0.0664) |
7 |
|
IDFC Sensex ETF |
None At most one |
(0.0000) (0.2135) |
(0.0000) (0.2135) |
2 |
|
Invesco India Nifty ETF |
None At most one |
(0.0000) (0.0952) |
(0.0000) (0.0952) |
2 |
|
Kotak Banking ETF |
None At most one |
(0.0000) (0.2451) |
(0.0000) (0.2451) |
2 |
|
Kotak Nifty ETF |
None At most one |
(0.0000) (0.0200) |
(0.0000) (0.0200) |
2 |
|
Kotak PSU Bank ETF |
None At most one |
(0.0000) (0.0330) |
(0.0000) (0.0330) |
2 |
|
Kotak Sensex ETF |
None At most one |
(0.0000) (0.2010) |
(0.0000) (0.2010) |
2 |
|
LIC MF Exchange Traded Fund-Nifty 50 |
None At most one |
(0.0000) (0.1055) |
(0.0000) (0.1055) |
2 |
|
LIC MF Exchange Traded Fund-Nifty 100 |
None At most one |
(0.0000) (0.0554) |
(0.0000) (0.0554) |
1 |
|
LIC MF Exchange Traded Fund-Sensex |
None At most one |
(0.0015) (0.0156) |
(0.0085) (0.0156) |
3 |
|
Motilal Oswal M50 ETF |
None At most one |
(0.0000) (0.1334) |
(0.0000) (0.1334) |
3 |
|
Motilal Oswal Midcap 100 ETF |
None At most one |
(0.0081) (0.0338) |
(0.0266) (0.0338) |
2 |
|
Motilal Oswal Nasdaq 100 ETF |
None At most one |
(0.0386) (0.1304) |
(0.0388) (0.1304) |
3 |
|
Quantum Nifty ETF |
None At most one |
(0.0000) (0.0259) |
(0.0000) (0.0259) |
2 |
|
Nippon ETF Bank BeES |
None At most one |
(0.0000) (0.2167) |
(0.0000) (0.2167) |
2 |
|
Nippon ETF Hang Seng BeES |
None At most one |
(0.0000) (0.0376) |
(0.0021) (0.0376) |
2 |
|
Nippon ETF Infra BeES |
None At most one |
(0.0000) (0.0604) |
(0.0000) (0.0604) |
1 |
|
Nippon ETF Junior BeES |
None At most one |
(0.0003) (0.0126) |
(0.0017) (0.0126) |
6 |
|
Nippon ETF Nifty 100 |
None At most one |
(0.0000) (0.0420) |
(0.0000) (0.0420) |
4
|
|
Nippon ETF Nifty BeES |
None At most one |
(0.0000) (0.1325) |
(0.0000) (0.1325) |
2 |
|
Nippon ETF NV20 ETF |
None At most one |
(0.0000) (0.0309) |
(0.0000) (0.0309) |
1 |
|
Nippon ETF PSU Bank BeES |
None At most one |
(0.0000) (0.0324) |
(0.0000) (0.0324) |
2 |
|
Nippon ETF Sensex |
None At most one |
(0.0000) (0.0228) |
(0.0000) (0.0228) |
1 |
|
SBI-ETF BSE 100 |
None At most one |
(0.0000) (0.0435) |
(0.0000) (0.0435) |
2 |
|
SBI-ETF Nifty 50 |
None At most one |
(0.0000) (0.0576) |
(0.0000) (0.0576) |
2 |
|
SBI-ETF Nifty Next 50 |
None At most one |
(0.0000) (0.0043) |
(0.0000) (0.0043) |
2 |
|
SBI-ETF Nifty Bank |
None At most one |
(0.0000) (0.1398) |
(0.0000) (0.1398) |
2 |
|
UTI NIFTY Exchange Traded Fund |
None At most one |
(0.0000) (0.1010) |
(0.0000) (0.1010) |
3 |
|
UTI SENSEX Exchange Traded Fund |
None At most one |
(0.0002) (0.2643) |
(0.0002) (0.2643) |
12 |
Source: Compiled using EViews and MS Excel
Notes: *Null hypothesis is a test for the presence of co-integration vector between the price of the ETF and NAV of the ETF.**Test proves significant at the 5% confidence level.
5.6 Vector error correction model (VECM)
A VECM model is commonly used for data where the underlying variables have a long-run stochastic trend, also known as co-integration. The VECM has co-integration relations built into the specification so that it restricts the long-run behaviour of the endogenous variables to converge to their co-integration while allowing for short-run adjustment dynamics. The co-integration term known as error correction term since the deviation from long-run equilibrium is corrected gradually through a series of partial short-run adjustments. Table 7 reports the VECM estimation results. Coefficients of the equilibrium error correction term represent the speed at which the short-run deviation from the long run equilibrium is corrected in the subsequent period. The result suggests that for all the ETFs, the NAV leads the market price in information transmission and price discovery processes. The market price often deviates substantially from the long-run equilibrium. The results help to understand the lead-lag relationship between the market price and NAV of the ETFs. The market price corrects itself based on the movements of the NAV. Hence, we can conclude that historical NAV data can be used for predicting future market price discovery of ETFs. Investors can devise profitable strategies based on the NAV-market price movement, which would be reflected in future ETF price levels.
Table 7. Vector Error Correction Model Estimates for One Co-Integration Vector
|
Scheme Name |
Variable |
Error |
Standard |
P-Value |
Lag |
Inference |
|
Aditya Birla Sun Life Nifty ETF |
NAV Price |
-0.0058 -0.1742 |
0.0128 0.0331 |
0.811 0.000 |
2 |
Error coefficient of price is higher than NAV and NAV’s error coefficient is not significant. Hence, the NAV leads the price. |
|
Edelweiss ETF – Nifty 100 Quality 30 |
NAV Price |
0.000578 0.118513 |
0.00755 0.03197 |
0.938 0.002 |
4 |
Error coefficient of price is higher than NAV and NAV’s error coefficient is not significant. Hence, the NAV leads the price. |
|
Edelweiss |
NAV Price |
-0.01123 -0.16198 |
0.01402 0.04892 |
0.424 0.001 |
3 |
Error coefficient of price is higher than NAV and NAV’s error coefficient is not significant. Hence, the NAV leads the price. |
|
Edelweiss |
NAV Price |
0.01840 0.03166 |
0.0071 0.0327 |
0.0101 0.3343 |
14 |
Error coefficient of price is higher than NAV and both are significant. Hence, the NAV leads the price. |
|
HDFC Nifty 50 ETF |
NAV Price |
0.07984 0.44438 |
0.1477 0.1410 |
0.5892 0.0017 |
3 |
Error coefficient of price is higher than NAV and NAV’s error coefficient is not significant. Hence, the NAV leads the price. |
|
HDFC Sensex ETF |
NAV Price |
-0.03732 0.77236 |
0.0402 0.0709 |
0.3537 0.0000 |
1 |
Error coefficient of price is higher than NAV and NAV’s error coefficient is not significant. Hence, the NAV leads the price. |
|
ICICI Prudential Nifty 100 ETF |
NAV Price |
0.00901 1.02137 |
0.05579 0.08167 |
0.8717 0.0000 |
1 |
Error coefficient of price is higher than NAV and NAV’s error coefficient is not significant. Hence, the NAV leads the price. |
|
ICICI Prudential Nifty ETF |
NAV Price |
-0.2368 0.23907 |
0.22129 0.21065 |
0.2851 0.2570 |
2 |
Error coefficient of price is higher than NAV and both are not significant. Hence, the NAV leads the price. |
|
ICICI Prudential NV20 ETF |
NAV Price |
-0.0259 0.97596 |
0.06772 0.09037 |
0.7013 0.0000 |
1 |
Error coefficient of price is higher than NAV and NAV’s error coefficient is not significant. Hence, the NAV leads the price. |
|
ICICI Prudential Sensex ETF |
NAV Price |
0.04070 1.09185 |
0.04198 0.07533 |
0.3328 0.0000 |
1 |
Error coefficient of price is higher than NAV and NAV’s error coefficient is not significant. Hence, the NAV leads the price. |
|
IDFC Nifty ETF |
NAV Price |
0.04370 0.32131 |
0.03801 0.06879 |
0.2509 0.0000 |
7 |
Error coefficient of price is higher than NAV and NAV’s error coefficient is not significant. Hence, the NAV leads the price. |
|
IDFC Sensex ETF |
NAV Price |
-0.0444 0.62708 |
0.03469 0.09039 |
0.2018 0.0000 |
2 |
Error coefficient of price is higher than NAV and NAV’s error coefficient is not significant. Hence, the NAV leads the price. |
|
Invesco India Nifty ETF |
NAV Price |
-0.02583 0.39232 |
0.02827 0.07290 |
0.3615 0.0000 |
2 |
Error coefficient of price is higher than NAV and NAV’s error coefficient is not significant. Hence, the NAV leads the price. |
|
Kotak Banking ETF |
NAV Price |
-0.2018 0.33325 |
0.15508 0.15753 |
0.1937 0.0349 |
2 |
Error coefficient of price is higher than NAV and NAV’s error coefficient is not significant. Hence, the NAV leads the price. |
|
Kotak Nifty ETF |
NAV Price |
-0.70206 0.03992 |
0.05628 0.79573 |
0.0000 0.9600 |
2 |
Error coefficient of price is higher than NAV and NAV’s error coefficient is significant. Hence, the NAV leads the price. |
|
Kotak PSU Bank ETF |
NAV Price |
-0.42018 0.51724 |
0.19505 0.16446 |
0.0317 0.0018 |
2 |
Error coefficient of price is higher than NAV and both are significant. Hence, the NAV leads the price. |
|
Kotak Sensex ETF |
NAV Price |
-0.01094 0.81884 |
0.0780 0.0921 |
0.8886 0.0000 |
2 |
Error coefficient of price is higher than NAV and NAV’s error coefficient is not significant. Hence, the NAV leads the price. |
|
LIC MF Exchange Traded Fund-Nifty 50 |
NAV Price |
-0.04357 0.73787 |
0.0340 0.0750 |
0.2013 0.0000 |
2 |
Error coefficient of price is higher than NAV and NAV’s error coefficient is not significant. Hence, the NAV leads the price. |
|
LIC MF Exchange Traded Fund-Nifty 100 |
NAV Price |
-0.0151 0.2595 |
0.0159 0.0442 |
0.3415 0.0000 |
1 |
Error coefficient of price is higher than NAV and NAV’s error coefficient is not significant. Hence, the NAV leads the price. |
|
LIC MF Exchange Traded Fund-Sensex |
NAV Price |
0.0227 0.2860 |
0.0183 0.0666 |
0.2162 0.0000 |
3 |
Error coefficient of price is higher than NAV and NAV’s error coefficient is not significant. Hence, the NAV leads the price. |
|
Motilal Oswal M50 ETF |
NAV Price |
-0.0912 0.2300 |
0.0357 0.0449 |
0.0110 0.0000 |
3 |
Error coefficient of price is higher than NAV and both are significant. Hence, the NAV leads the price. |
|
Motilal Oswal Midcap 100 ETF |
NAV Price |
-0.0164 0.0598 |
0.0173 0.0200 |
0.3477 0.0030 |
2 |
Error coefficient of price is higher than NAV and NAV’s error coefficient is not significant. Hence, the NAV leads the price. |
|
Motilal Oswal Nasdaq 100 ETF |
NAV Price |
-0.0012 0.0219 |
0.0084 0.0111 |
0.8786 0.0555 |
3 |
Error coefficient of price is higher than NAV and NAV’s error coefficient is not significant. Hence, the NAV leads the price. |
|
Quantum Nifty ETF |
NAV Price |
-0.4119 0.4452 |
0.1506 0.1394 |
0.0066 0.0016 |
2 |
Error coefficient of price is higher than NAV and both are significant. Hence, the NAV leads the price. |
|
Nippon ETF Bank BeES |
NAV Price |
-0.4932 0.0223 |
0.2859 0.2817 |
0.0852 0.9368 |
2 |
Error coefficient of price is higher than NAV and both are not significant. Hence, the NAV leads the price |
|
Nippon ETF Hang Seng BeES |
NAV Price |
-0.0393 0.1192 |
0.0157 0.0311 |
0.0131 0.0001 |
2 |
Error coefficient of price is higher than NAV and NAV’s error coefficient is not significant. Hence, the NAV leads the price. |
|
Nippon ETF Infra BeES |
NAV Price |
-0.1849 0.7536 |
0.1147 0.1274 |
0.1076 0.0000 |
1 |
Error coefficient of price is higher than NAV and NAV’s error coefficient is not significant. Hence, the NAV leads the price. |
|
Nippon ETF Junior BeES |
NAV Price |
0.1468 0.4501 |
0.3361 0.3250 |
0.6624 0.1666 |
6 |
Error coefficient of price is higher than NAV and both are not significant. Hence, the NAV leads the price. |
|
Nippon ETF Nifty 100 |
NAV Price |
0.0916 0.8893 |
0.1222 0.1282 |
0.4540 0.0000 |
4 |
Error coefficient of price is higher than NAV and NAV’s error coefficient is not significant. Hence, the NAV leads the price. |
|
Nippon ETF Nifty BeES |
NAV Price |
-0.3911 0.0670 |
0.2537 0.2411 |
0.1238 0.7811 |
2 |
Error coefficient of price is higher than NAV and both are not significant. Hence, the NAV leads the price. |
|
Nippon ETF NV20 ETF |
NAV Price |
0.1098 0.8764 |
0.1248 0.1235 |
0.3794 0.000 |
1 |
Error coefficient of price is higher than NAV and NAV’s error coefficient is not significant. Hence, the NAV leads the price. |
|
Nippon ETF PSU Bank BeES |
NAV Price |
0.2513 0.5118 |
0.2110 0.1846 |
0.2342 0.0058 |
2 |
Error coefficient of price is higher than NAV and NAV’s error coefficient is not significant. Hence, the NAV leads the price. |
|
Nippon ETF Sensex |
NAV Price |
-0.0319 0.9553 |
0.0806 0.1160 |
0.6924 0.0000 |
1 |
Error coefficient of price is higher than NAV and NAV’s error coefficient is not significant. Hence, the NAV leads the price. |
|
SBI-ETF BSE 100 |
NAV Price |
0.0081 0.2109 |
0.0285 0.0345 |
0.7745 0.0000 |
2 |
Error coefficient of price is higher than NAV and NAV’s error coefficient is not significant. Hence, the NAV leads the price. |
|
SBI-ETF Nifty 50 |
NAV Price |
-0.2517 0.3338 |
0.2307 0.2190 |
0.2764 0.1288 |
2 |
Error coefficient of price is higher than NAV and both are not significant. Hence, the NAV leads the price. |
|
SBI-ETF Nifty Next 50 |
NAV Price |
0.1474 0.8400 |
0.1741 0.1585 |
0.3976 0.0000 |
2 |
Error coefficient of price is higher than NAV and NAV’s error coefficient is not significant. Hence, the NAV leads the price. |
|
SBI-ETF Nifty Bank |
NAV Price |
-0.3451 0.4163 |
0.2294 0.2195 |
0.1332 0.0585 |
2 |
Error coefficient of price is higher than NAV and NAV’s error coefficient is not significant. Hence, the NAV leads the price. |
|
UTI NIFTY Exchange Traded Fund |
NAV Price |
-0.0804 0.5404 |
0.0870 0.0963 |
0.3558 0.0000 |
3 |
Error coefficient of price is higher than NAV and NAV’s error coefficient is not significant. Hence, the NAV leads the price. |
|
UTI SENSEX Exchange Traded Fund |
NAV Price |
-0.0261 0.5070 |
0.0720 0.1131 |
0.7171 0.0000 |
12 |
Error coefficient of price is higher than NAV and NAV’s error coefficient is not significant. Hence, the NAV leads the price. |
Source: Compiled using EViews and MS Excel
6. Conclusion
Our findings contribute to the understanding of equity ETFs listed in India tracking domestic as well as foreign market indices by studying the relation between the market price and the NAV of ETFs. The recent substantial increase in the flow of funds to ETFs signifies the rise in the popularity of ETF as an investment tool in India. The present study contributes to the existing literature on ETFs in India, and also tries to investigate the pricing efficiency achieved through the creation-redemption mechanism by the ETF market makers.
The results of autoregression analysis showed that during the study period, ETFs listed in India take a minimum of one day and a maximum of four days for the deviation between the NAV and market price to disappear. The results of autoregression are in contrast with Elton et al. (2002) and Rompotis (2010), where persistence in deviation was observed for a day. The presence of deviation between the market price and NAV of ETF for more than one day represents an additional cost to the investors, but also provides arbitragers with an opportunity to book low-risk profit. The VECM results demonstrate the short term dynamics and help to understand the lead-lag relationship; they indicate the NAV as the lead variable, which is followed by the market price (lag variable). The persistence of deviation between price and NAV, along with the understanding of lead-lag movement, can be used by investors to frame profitable investment strategies in the Indian ETF market. Though pricing efficiency of ETFs in India has substantially improved over the period, there is still a need for ETF providers to partner with market makers for efficiently aligning price and NAV using the creation-redemption mechanism effectively. Thus, we can conclude that the ETF market in India is partially efficient, and there still exist arbitrage opportunities to market makers and investors. Yadav and Pope (1994) reported that mispricing is more likely to represent profit opportunities rather than risk premia. The market regulators in India must increase their efforts to educate investors about the benefits of investing in ETFs, which will help improve pricing efficiency in the future.
Acknowledgements
The authors acknowledge the valuable suggestions received from anonymous reviewers.
References
Aditya, G., & Desai, R. (2015). Pricing Efficiency and Price Discovery of Indian Equity ETFs. The Journal of Index Investing, 6 (3), 67–79.
Bas, N. K., & Sarioglu, S. E. (2015). Tracking ability and pricing efficiency of exchange traded funds: Evidence from Borsa Istanbul. Business and Economics Research Journal, 6(1), 19–33.
Blitz, D., & Huij, J. (2012). Evaluating the performance of global emerging markets equity exchange-traded funds. Emerging Markets Review, 13(2), 149–158.
Charteris, A. (2013). The price efficiency of South African exchange traded funds. Investment Analysts Journal, 42(78), 1–11.
Charteris, A., Chau, F., Gavriilidis, K., & Kallinterakis, V. (2014). Premiums, discounts and feedback trading: Evidence from emerging markets’ ETFs. International Review of Financial Analysis, 35, October, 80–89.
DeFusco, R. A., Ivanov, S. I. & Karels, G. V. (2011). The exchange traded funds’ pricing deviation: analysis and forecasts. Journal of Economics and Finance, 35( 2), 181–197.
Elton, E. J., Gruber, M. J., Comer, G., & Li, K. (2002). Spiders: Where Are the Bugs?. The Journal of Business, 75(3), 453–472.
Gallagher, D. R., & Segara, R., (2005). The performance and trading characteristics of exchange-traded funds. Journal of Investment Strategy, 1(1), 47–58.
Hilliard, J. (2014). Premiums and discounts in ETFs: An analysis of the arbitrage mechanism in domestic and international funds. Global Finance Journal, 25 (2), 90–107.
Kayali, M. M. (2007). Pricing efficiency of exchange traded funds in Turkey: Early evidence from the Dow Jones Istanbul 20. International Research Journal of Finance and Economics, 10, July, 14–23.
Kreis, Y., & Licht, J. W. (2018). Trading on ETF mispricings. Managerial Finance, 44(3), 357–373.
Kumar, P. (2018). An Investigation of Pricing Efficiency of CPSE ETF in India. Journal of Commerce & Accounting Research, 7(2).
Lin, C. C., Chan, S. J., & Hsu, H. (2006). Pricing efficiency of exchange traded funds in Taiwan. Journal of Asset Management, 7(1), 60–68.
Marshall, B. R., Nguyen, N. H., & Visaltanachoti, N. (2013). ETF arbitrage: Intraday evidence. Journal of Banking & Finance, 37(9), 3486–3498.
Miu, P., Charupat, N., Chung, D. Y., & Hrazdil, K. (2013). Speed of convergence to market efficiency in the ETFs market. Managerial Finance, 39(5), 457–475.
Poterba, J. M., & Shoven, J. B. (2002). Exchange-traded funds: A new investment option for taxable investors. American Economic Review, 92(2), 422–427.
Purohit, H., & Malhotra, N. (2015). Pricing Efficiency & Performance of Exchange Traded Funds in India. The IUP Journal of Applied Finance, 21(3), 16–35.
Rompotis, G. G. (2009). Interfamily competition on index tracking: The case of the vanguard ETFs and index funds. Journal of Asset Management, 10(4), 263–278.
Rompotis, G. G. (2010). Active versus Passive ETFs: An Investigation of Bid-Ask Spread. The IUP Journal of Asset Management, 11(4), 298–308.
Shanmugham, R., & Zabiulla. (2012). Pricing efficiency of Nifty BeES in bullish and bearish markets. Global Business Review, 13(1), 109–121.
Shin, S., & Soydemir, G. (2010). Exchange-traded funds, persistence in tracking errors and information dissemination. Journal of Multinational Financial Management, 20(4/5), 214–234.
Swathy, M. (2015). An empirical analysis on pricing efficiency of exchange traded funds in India. International Journal of Engineering and Management Sciences, 6(2), 68–72.
Tse, Y., Bandyopadhyay, P., & Shen, Y. P. (2006). Intraday price discovery in the DJIA index markets. Journal of Business Finance & Accounting, 33(9/10), 1572–1585.
Wong, K. H., & Shum, W. C. (2010). Exchange-traded funds in bullish and bearish markets. Applied Economics Letters, 17(16), 1615–1624.
Yadav, P. K., & Pope, P. F. (1994). Stock index futures mispricing: Profit opportunities or risk premia?. Journal of Banking & Finance, 18(5), 921–953.