Organizations and Markets in Emerging Economies ISSN 2029-4581 eISSN 2345-0037
2019, vol. 10, no. 2(20), pp. 278–293 DOI: https://doi.org/10.15388/omee.2019.10.14
Sectoral Analysis of the Determinants of Corporate Capital Structure in Malaysia
Yee Peng Chow
Faculty of Accountancy, Finance and Business,
Tunku Abdul Rahman University College, Kuala Lumpur, Malaysia
chowyeepeng@gmail.com
Abstract. This study investigates the determinants of corporate capital structure of various sectors in the Bursa Malaysia Main Market with the aim to establish whether the determinants of capital structure can be explained by either the trade-off or the pecking order theory. This study also examines whether there are any differences between the regressions for any two sectors or not. This study applies both the ordinary least squares (OLS) and the seemingly unrelated regression (SUR) estimators to estimate the leverage models, and subsequently determines the efficiency of each estimator. The results indicate that profitability, asset tangibility, growth opportunities, and firm size are important determinants of corporate capital structure. However, the signs of the regression coefficients suggest that the trade-off and pecking order theories are complementary. Moreover, the importance of some of these determinants differs across sectors. In most cases of the regression analyses between two sectors, the SUR estimator is found to be more efficient in explaining the determinants of capital structure among the various sectors. Hence, this study concludes that the SUR method could serve as a useful alternative methodology for capital structure research.
Keywords: capital structure; leverage; seemingly unrelated regression; sectoral analysis; Bursa Malaysia
Received: 11/5/2018. Accepted: 7/1/2019
Copyright © 2019 Yee Peng Chow. Published by Vilnius University Press. This is an Open Access article distributed under the terms of the Creative Commons Attribution Licence, which permits unrestricted use, distribution, and reproduction in any medium, provided the original author and source are credited.
1. Introduction
In their seminal work, Modigliani and Miller (1958) introduce the irrelevance theorem, which postulates that in perfect capital markets, the firm’s leverage1 should not have any effect on its market value and capital investment plans since both real and financial decisions can be made separately. In other words, when there are no frictions such as agency costs, asymmetric information, taxes, and bankruptcy costs, the firm’s capital structure is irrelevant to its value. Numerous studies have been carried out since then to further understand the financing decisions of firms, and some recent empirical studies on capital structure determinants have produced contrary evidence. Most of the empirical evidence suggests that firms use some cost-benefit analysis to choose their capital structure.
The primary aim of this paper is to examine the determinants of corporate capital structure of various sectors in the Bursa Malaysia Main Market. The majority of capital structure studies are confined to country level or firm level analysis. However, limited studies are done for multi-sectors or multi-industries, particularly in relation to the Malaysian market (e.g., Lau et al., 2016a, 2016b; Ramakrishnan, 2012). This study aims to investigate whether the capital structure determinants are explained by either the trade-off or the pecking order theory. This study hypothesizes that both the trade-off and pecking order theories are complementary, rather than one theory being more superior than the other. The second aim of this paper is to investigate whether there are any differences between the regressions for any two sectors or not. If there are no differences, then the data from the two sectors can be pooled together without any parameter restrictions and with no allowance being made for differing intercept or slope.
In order to achieve these objectives, this study applies both the OLS and SUR estimators to estimate the capital structure determinants of various sectors in Malaysia.2 The SUR model is especially useful for testing the properties of homogeneity and symmetry. Therefore, it would be interesting to see whether this estimator is more efficient in explaining the capital structure determinants among the various sectors. This study covers seven sectors in the Bursa Malaysia Main Market, namely consumer products, industrial products, construction, trading services, properties, plantation, and technology from 2000 to 2014, yielding 105 sector-year observations. The results support the hypothesis of this study and are in line with prior findings by Ebrahim et al. (2014), González and González (2012), and Mukherjee and Mahakud (2012) that the trade-off and pecking order theories are complementary. However, some of the determinants of capital structure differ across sectors. In addition, based on the Breusch and Pagan (1980) Lagrange Multiplier (Breusch-Pagan LM) test, the SUR estimator is found to be a more efficient estimator for the regression models involving 17 out of 21 combinations between two sectors. Nonetheless, the results based on the Wald test are mixed.
The contribution of this paper is that it allows us to have a better comprehension of what factors influence the capital structure of different sectors. This is important at the policy makers’ level because it enables the monetary authorities and financial policy makers to introduce the appropriate policies and financial instruments to fulfill the funding needs of various sectors in the economy. This may also assist lenders and other financial institutions in aligning their lending decisions with the capital structure choices of firms from different sectors.
The remainder of the paper is organized as follows. Section two reviews the literature. Section three explains the methodology. Section four describes the data. Section five presents the empirical results. Section six covers the robustness checks, and section seven concludes.
2. Literature Review
The debate on capital structure originates from the capital structure irrelevance theorem by Modigliani and Miller (1958), which postulates that in perfect capital markets, i.e., where there are no frictions such as agency costs, asymmetric information, taxes, and bankruptcy costs, the capital structure of a firm is irrelevant. Therefore, a firm’s leverage should not have any effect on its market value and capital investment plans. Since then, several theories on capital structure have emerged, which attempt to identify which frictions make capital structure relevant to the firms and their implications. There are two major competing theories in modern corporate finance literature which attempt to explain the firm’s financing decisions, namely the trade-off theory and the pecking order theory.
The trade-off theory is one of the most accepted theories of corporate capital structure. According to this theory, firms select their optimal capital structure after considering the trade-off between the benefits and costs of using debt. The imperfections to be taken into consideration include the costs of financial distress, taxes, and agency costs. For instance, higher financial distress costs lead to less debt and more equity (Myers, 1977), higher taxes on dividend lead to more debt (Miller & Scholes, 1978; Modigliani & Miller, 1963), higher non-debt tax shields lead to less debt (DeAngelo & Masulis, 1980), excessive debt can result in conflicts of interest and asset substitution problems between managers and bondholders (Jensen & Mecking, 1976; Fama & Miller, 1972), agency problems can result in higher or lower amount of debt, and excessive equity can result in free cash flow problems and conflicts of interest between managers and shareholders (Jensen, 1986).
There are recent empirical findings supporting the existence of a target leverage ratio and firms reverting back to a target capital structure after perturbations or random events. For instance, Chong and Law (2012) analyzed the long-run adjustment of capital structure towards the target for a sample of industrial firms in five Asian economies, namely Thailand, Hong Kong, Singapore, Japan, and Taiwan, for the period 1980 to 2003. The results indicate that although there are significant deviations from the target due to the pecking order and market timing effects, the leverage ratios of these Asian firms revert gradually to the target leverage ratio to fill up the leverage deficit. Meanwhile, Dang et al. (2014) investigated the impact of the Global Financial Crisis and the associated credit shocks on the leverage adjustment speed for a sample of U.S. firms over the period 2002 to 2012. The authors find limited evidence of threshold effects and asymmetric speed of adjustment when the analysis is done for the whole sample period. However, when the authors conduct sub-period analyses, they find stronger cross-sectional heterogeneity in the speed of adjustment, with the most pronounced results recorded for the pre-crisis period. Other empirical studies which find evidence supporting the existence of a target leverage ratio are Versmissen and Zietz (2017), Cook et al. (2016), and González and González (2012).
Meanwhile, Myers (1984) and Myers and Majluf (1984) propose the pecking order theory, which postulates that firms have no well-defined target debt ratio. Instead, firms’ preferences are described in a theoretical model where the firms’ capital structure choice follows a strict hierarchy, where they prefer internal funding the most, and they will issue debt when the internal funding is insufficient to finance their investment. Firms shall only consider issuing equity when they can no longer issue debt due to the risk of default or other financial distress costs. The justification behind the pecking order in capital structure choices is the presence of asymmetric information between the firm’s managers and outside investors, where managers are assumed to have more information about the firm’s value compared to potential investors.3 When managers believe that their shares are undervalued, they are reluctant to issue new shares even if it means that they have to forgo valuable investment opportunities. Investors know about this information asymmetry and interpret the actions of the firm rationally. As a result, investors perceive an investment decision with no security issuance as a signal for good news, and equity issuance as a signal for bad news. The latter signal causes a reduction in the price investors are willing to pay for the equity issue. Faced with the reality of this discount, firms adopt a pecking order of firm’s financing, where managers prefer using internally generated sources of funds first, then debt, and finally, equity, if external financing is needed.
The empirical investigation of the pecking order theory involves two major notions. The first one is financing deficit, or a financing gap, which is defined as the difference between investment and internal funding. For example, De Jong et al. (2010) modify the pecking order model of Shyam-Sunder and Myers (1999) by discriminating between the effects of financing surpluses, normal deficits, and large deficits. The authors report that for financing surpluses, the pecking order model is a good descriptor of the financing behaviour of firms. Nonetheless, the pecking order model only provides a reasonable description for small and medium financing deficits, and an extremely poor description for large financing deficits. This implies that firms facing large deficits, which are normally associated with small firms, issue relatively more equity than debt.
The second important notion in the empirical investigation of the pecking order theory is debt capacity. Debt capacity can be broadly defined as the maximum amount of debt that a firm can borrow. For instance, Lemmon and Zender (2010) consider the heterogeneity in the debt capacity level of various firms in their capital structure study. The authors find that firms which are unconstrained by debt capacity rely on different sources of external funding compared to firms with limited debt capacity when they face large financing deficits. More specifically, firms which are unconstrained by concerns over debt capacity tend to issue debt, while firms with limited debt capacity rely more on outside equity, hence violating the pecking order. In the same vein, Shen (2014) also emphasizes the role of debt capacity, where firms that violate the pecking order theory often have limited access to the public debt market. The author finds it puzzling for firms with high information asymmetry to have moderate dependence on debt financing since such firms are supposed to demonstrate a strong preference for debt financing given the relatively expensive equity capital. He shows that this puzzling finding can be explained by the constraints faced by high-information-asymmetry firms in the public debt market, where as information asymmetry increases, firms have increasing desire to issue debt but are constrained from doing so since they begin to lose access to the public debt market. Consequently, these firms have to resort to issuing private debt and face the relatively low debt capacities found in the private debt market.
In conclusion, there is no single theory of capital structure that can fully explain the cross-sectional and time series patterns observed in the literature (Chang & Dasgupta, 2011; Graham & Leary, 2011). There is a variation in the relative importance of these explanations in different studies. This paper focuses primarily on the two major competing theories, namely the trade-off and the pecking order theories.
3. Methodology
Equation 1 shows the leverage model used in this paper4:
LEVi,t = β1 + β2PROFITi,t + β3TANGIi,t + β4GROWTHi,t + β5SIZEi,t + εi.t (1)
where subscript i indexes the sector and t indexes the year.
The dependent variable is book leverage ratio (LEV), which is measured as the ratio of the book value of total debt divided by the book value of total assets. The studies which have adopted similar definitions of book leverage ratio include Chow et al. (2018) and Canarella et al. (2014).
The choice of regressors used in this paper is similar to those found in prior capital structure research. PROFIT measures the overall profitability of the given sector, which is calculated as the ratio of earnings before interest and taxes to total assets (Li & Islam, 2019; Sun et al., 2015). According to the trade-off theory, there is a positive relationship between leverage and profitability since more profitable firms have less probability of financial distress. Additionally, more profitable firms also have higher leverage to control the agency cost of free cash flow and to shield taxable income (Hart & Moore, 1995; Jensen, 1986). On the contrary, the pecking order model predicts an inverse association between profitability and leverage. More profitable firms prefer less leverage and rely more on retained earnings due to adverse selection and information asymmetry problems (Myers, 1984; Myers & Majluf, 1984).
TANGI measures the tangibility of assets, which is calculated as the ratio of net values of property, plant, and equipment to total assets (Li & Islam, 2019; Nugroho & Suk, 2019). According to the trade-off theory, there is a positive association between asset tangibility and leverage. Higher asset tangibility means that firms possess more fixed assets that can be given as collateral for loans. As such, lenders face lower risk when giving loans to these firms. Moreover, tangibility makes it more difficult for shareholders to substitute high-risk assets for low-risk ones. As a result, firms with more tangible assets can obtain debt financing with greater ease.5 There is, however, ambiguity regarding the relationship between asset tangibility and firm leverage under the pecking order theory. On one hand, firms with few tangible assets are expected to have more problems with information asymmetry. As such, these firms tend to use more debt over time (Harris & Raviv, 1991). On the other hand, adverse selection problem increases with asset tangibility and results in higher leverage. According to Frank and Goyal (2009), this ambiguity arises because asset tangibility acts as a proxy for different forces of economy.
GROWTH denotes growth opportunities and is measured using the market-to-book ratio, computed as the ratio of the sum of market value of equity and book value of debt to total assets (Nugroho & Suk, 2019; Ebrahim et al., 2014). The trade-off theory predicts that the association between growth opportunities and leverage is negative. Higher market-to-book ratio may be perceived as an indication of better future investment opportunities. Firms may attempt to protect these future investment opportunities by restraining the use of leverage now. On the flip side, according to the pecking order theory, there is a positive relation between growth opportunities and leverage because higher financing needs arise due to investment opportunities, and this will lead to more debt issuance.
SIZE is meant to illustrate the magnitude of the representative company’s operations. It is measured as the natural logarithm of total assets (Chow et al., 2018; Ebrahim et al., 2014). According to the trade-off theory, it is predicted that firm size has a positive relationship with leverage because larger firms are more diversified and face lower chances of bankruptcy. Moreover, these firms have greater bargaining power in the debt markets due to their good reputation and business track records. However, the pecking order theory predicts a negative association between leverage and firm size. Assuming that firm size is a reasonable proxy for firm age, large firms are assumed to have been operating for a longer period and are better known. Consequently, large firms encounter lower adverse selection problems and find it relatively easy to issue equity compared to small firms which are often shrouded by more severe adverse selection problems (Ebrahim et al., 2014).6 Finally, εi.t denotes the error term.
This study uses both the OLS and SUR estimators to estimate the leverage model, and subsequently determines the efficiency of each estimator. The OLS estimator fails to consider the possible correlation between equations, where it assumes that the error terms are not correlated. The SUR estimator developed by Zellner (1962) considers the correlations in the error terms and allows for different dependent variables to have different sets of regressors. The SUR method simultaneously estimates the parameter of all equations so that the parameters of each equation also utilise the information provided by other equations. Hence, the estimation is more efficient since it combines information on different equations.
Initially, this study estimates the leverage model for all seven sectors using both the OLS and SUR estimators. In order to account for cross-sector differences in the OLS regression, this study has incorporated sector dummies into the analysis. For diagnostic tests, this study runs the Durbin-Watson (DW) test for autocorrelation. Next, the leverage models for all the combinations of two sectors are estimated to see whether there are any differences between the regressions for any two sectors or not. If no differences are found, then the data from the two sectors can be pooled together without any consideration being made for differing intercept or slope, and with no parameter restrictions.
In order to test whether there is contemporaneous correlation for the system of equations, this study tests the following null and alternative hypotheses:
H0: cov (ε1t , ε2t ) = 0 (2)
H1: cov (ε1t , ε2t ) ≠ 0
The Breusch-Pagan LM test is adopted to test these hypotheses. The Breusch-Pagan LM test-statistic is as follows:
LM test-statistic = r2 × T (3)
where r2 is the squared correlation residuals between equations, and the residuals are estimated from the OLS regression, while T is the total pooled observations. The LM test-statistic follows the Chi-square distribution, χ2 [m (m – 1)/2] with [m (m – 1)/2] degrees of freedom, and m denotes the number of sectors.
In order to examine whether the estimate coefficient between any two sectors, e.g., Sector 1 and Sector 2, is equal, this study tests the following null and alternative hypotheses:
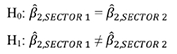 (4)
(4)
The Wald test is applied to test these hypotheses. The same steps are repeated for the remaining parameters, i.e., 
4. Data and Descriptive Statistics
This study sources annual financial and accounting data on firms listed on the Bursa Malaysia Main Market from the firms’ annual reports and audited financial statements. The analysis covers firms from seven sectors according to Bursa Malaysia’s classification, namely consumer products, industrial products, construction, trading services, properties, plantation, and technology from 2000 to 2014, yielding a balanced panel dataset of 105 sector-year observations. The financial and utility sectors are excluded from the analysis due to the influence of regulatory concerns on their capital structure decisions.7
TABLE 1A. Descriptive statistics for the full sample
|
LEV |
PROFIT |
TANGI |
GROWTH |
SIZE |
|
|
Sector-Year Obs. Mean Std. Dev. Min Max |
105 0.437 0.351 0.110 2.984 |
105 0.057 0.067 -0.311 0.360 |
105 0.276 0.137 0.084 1.242 |
105 1.189 0.597 0.591 3.877 |
105 8.822 0.428 8.256 9.717 |
Table 1A shows the descriptive statistics for all sectors for the overall period, while Table 1B shows the averages of the firm-specific variables by sector across 2000 to 2014. The average leverage for all sectors is 0.437, with a standard deviation of 0.351. It can also be observed that the leverage ratios vary significantly across sectors, which is in line with prior research such as Li and Islam (2019). For instance, the industrial products sector records the lowest average leverage ratio of 0.255, while the trading services sector charts the highest average leverage ratio of 0.613. Meanwhile, the average profitability for all sectors is 0.057, with a standard deviation of 0.067. The properties sector has the lowest average profitability of 0.029, while the consumer products sector records the highest average profitability of 0.096. In addition, the average asset tangibility for all sectors is 0.276, with a standard deviation of 0.137. This paper finds that the construction sector has the lowest average asset tangibility of 0.132, while the industrial products sector has the highest average asset tangibility of 0.373. The average growth opportunities for all sectors is 1.189, with a standard deviation of 0.597. On average, firms in the technology sector have the highest growth opportunities of 1.729, while firms in the properties sector have the lowest growth opportunities of 0.727. Lastly, the average firm size for all sectors is 8.822, with a standard deviation of 0.428. Firms in the trading services sector tend to be relatively large in size, with a mean value of 9.505, while the consumer products sector records the lowest mean value of firm size of 8.415.
5. Empirical Results
Table 2 reports the estimation results using both the OLS and SUR estimators. When the leverage model is estimated using the OLS estimator, the signs of the variables indicate support for both the trade-off and the pecking order theories, thus confirming this study’s hypothesis that both theories are complementary.
In particular, this study finds that profitability is negatively related to leverage at the 1% significance level, which supports the pecking order theory. This indicates that more profitable firms prefer less leverage and rely more on retained earnings due to adverse selection and information asymmetry problems. Among empirical studies that find evidence in line with the pecking order theory are Li and Islam (2019) and Ebrahim et al. (2014).
Meanwhile, the association between leverage and asset tangibility is positive and statistically significant at the 1% level, which supports the trade-off theory. Higher asset tangibility means that firms possess more fixed assets that can be given as collateral for loans. As such, lenders face lower risk when giving loans to these firms. Moreover, asset tangibility makes it more difficult for shareholders to substitute high-risk assets for low-risk ones. As a result, firms with more tangible assets can obtain debt financing with greater ease. Among empirical findings that support the trade-off theory are Li and Islam (2019), Chow et al. (2018), and Ebrahim et al. (2014).
The coefficient for growth opportunities is positive and statistically significant at the 1% level, thus supporting the pecking order theory. This indicates that higher financing needs arise due to investment opportunities, and this will lead to more debt issuance. Among empirical studies that find evidence in line with the pecking order theory are Ebrahim et al. (2014), and González and González (2012).
Lastly, the coefficient for firm size is positive and statistically significant at the 10% level, which lends support to the trade-off theory. This indicates that larger firms can obtain more debt financing since they are more diversified, have lower probability of going bankrupt, and possess greater bargaining power in the debt markets. This is also in accord with empirical findings by Li and Islam (2019), Chow et al. (2018), and Ebrahim et al. (2014).
Next, using the SUR estimator, we estimate separate equations for each of the seven sectors. As observed, the adjusted R2 improves tremendously from 0.654 under the OLS estimator to 0.956 under the SUR estimator, implying that the SUR model captures a higher proportion of variation in the leverage ratio that is predictable from the regressors relative to the OLS model. The results also show that in some sectors, profitability, asset tangibility, growth opportunities, and firm size have significant associations with leverage, but not all the time. Moreover, some of the signs of the variables have changed compared to those estimated using the OLS regression.
In particular, for the consumer products sector, the results show that asset tangibility is negatively associated with leverage at the 5% level, which does not support the trade-off theory. There is, however, ambiguity regarding the relationship between asset tangibility and leverage under the pecking order theory. On one hand, firms with few tangible assets are expected to have more problems with information asymmetry. As such, these firms will tend to use more debt over time (Harris & Raviv, 1991). On the other hand, adverse selection problem increases with asset tangibility and results in higher leverage. Furthermore, consistent with the OLS estimation, both growth opportunities and firm size are positively associated with leverage at the 1% level. However, profitability is positively associated with leverage, but the relationship is not statistically significant.
For the industrial products sector, the results for profitability are similar to those of the OLS estimation. Nevertheless, asset tangibility and growth opportunities are negatively related to leverage, but both relationships are not statistically significant, while firm size is positively associated with leverage but the relationship is not statistically significant, either. For the construction sector, only firm size is statistically significant and positively associated with leverage at the 5% level, which is in line with the OLS estimation. The remaining three variables are not statistically significant.
For the trading services sector, the results are similar to those of the OLS estimation except for asset tangibility and firm size, which are not statistically significant for the case of the SUR estimation. For the properties sector, the variables share the same signs with those of the OLS estimation, but growth opportunities is not a statistically significant variable under the SUR estimation.
For the plantation sector, only asset tangibility and growth opportunities are positively associated with leverage at the 1% level, whereas profitability and firm size are not statistically significant. Lastly, for the technology sector, only firm size shares similar results to those of the OLS estimation. Asset tangibility is negatively associated with leverage at the 10% level, while profitability and growth opportunities are not statistically significant.
Next, this study estimates the leverage models for all the combinations of two sectors to examine whether there are any differences between the regressions for any two sectors or not. Table 3 shows that in 17 out of 21 combinations between two sectors, the LM test-statistics are statistically significant. Hence, the null hypothesis is rejected, indicating that there is contemporaneous correlation for the system of equations. In these 17 cases, the SUR estimator is a more efficient estimator for the regression models. Meanwhile, for the remaining four combinations, i.e., between consumer products and construction, consumer products and trading services, consumer products and properties, and properties and technology, the results are not statistically significant. Therefore, the null hypothesis is not rejected, indicating that there is no contemporaneous correlation for the system of equations. In these four cases, the OLS estimator is a more efficient estimator for the regression models.
TABLE 3. Results of the Breusch-Pagan LM test and the Wald test
|
Sectors |
LM test-stat |
Wald Test (Chi-square) |
|||
|
PROFIT |
TANGI |
GROWTH |
SIZE |
||
|
Industrial/Consumer Industrial/Construction Industrial/Trading Industrial/Properties Industrial/Plantation Industrial/Technology Consumer/Construction Consumer/Trading Consumer/Properties Consumer/Plantation Consumer/Technology Construction/Trading Construction/Properties Construction/Plantation Construction/Technology Trading/Properties Trading/Plantation Trading/Technology Properties/Plantation Properties/Technology Plantation/Technology |
6.139** 19.379*** 7.698*** 18.884*** 5.203** 8.466*** 0.275 1.948 0.951 6.292** 17.545*** 5.153** 24.480*** 13.715*** 3.128* 4.440** 19.011*** 12.711*** 12.096*** 1.084 10.252*** |
11.180*** 2.997* 3.311* 0.272 0.398 10.438*** 1.146 24.395*** 5.806** 0.002 1.642 16.058*** 1.177 0.066 3.195* 5.829** 5.200** 34.807*** 1.004 1.765 0.153 |
0.319 2.423 0.046 24.275*** 32.585*** 0.000 3.354* 0.196 26.206*** 30.979 0.150 0.047 12.480*** 14.337*** 1.434 1.263 0.479 0.004 0.055 21.951*** 16.486*** |
1.389 0.370 32.671*** 1.508 13.945*** 0.697 0.013 36.881*** 0.522 14.609 1.925 10.095*** 0.914 3.656* 0.144 7.893*** 10.563*** 54.580*** 1.006 3.528* 27.245*** |
2.083 0.266 0.010 4.534** 0.006 20.775*** 10.044** 0.058 10.625*** 1.126 60.064*** 0.022 3.565* 3.474* 44.300*** 0.383 0.026 0.679 7.683*** 1.020 38.755*** |
Notes: PROFIT = Profitability; TANGI = Asset tangibility; GROWTH = Growth opportunities; SIZE = Firm size. Asterisks *, **, and *** denote significance at the 10%, 5%, and 1% levels, respectively.
However, the results based on the Wald test are mixed. Only certain test results are statistically significant, hence allowing the null hypothesis to be rejected. In these cases, it can be concluded that based on the Wald test, the estimate coefficients between the two sectors are not equal, and the SUR estimator is a more efficient estimator for the regression models. Meanwhile, some test results are not statistically significant, and in such cases, the null hypothesis is not rejected. This indicates that for these cases, the estimate coefficients between the two sectors are equal, and the OLS estimator is a more efficient estimator for the regression models. Of particular interest is the combination between consumer products and plantation, where the test results for all four coefficients are insignificant.
6. Robustness Checks
As a robustness check, this study includes another variable, namely business risk, into the regression model. Following Shanmugasundaram (2008) and Mazur (2007), business risk is proxied by the standard deviation of the firm’s operating income scaled by the firm’s total assets over the study period. The regressions using both the OLS and SUR models are re-run, and the results are reported in Table 4. As observed, the inclusion of business risk as an additional regressor does not significantly change the results, where the results remain qualitatively similar to those reported in Table 2. Hence, this study concludes that business risk is not a significant variable, and the regression models remain robust.
TABLE 4. OLS and SUR estimates for leverage determinants (including business risk as an additional regressor)
|
OLS |
SUR |
|||||||
|
Consumer |
Industrial |
Construction |
Trading |
Properties |
Plantation |
Technology |
||
|
PROFIT TANGI GROWTH SIZE BUSINESS RISK Constant |
-1.414*** (-4.014) 1.576*** (6.814) 0.229*** (4.780) 0.243* (1.774) 0.011 (1.009) -2.333* (-1.978) |
-0.528* (0.655) -1.025** (-3.406) 0.074*** (3.753) 0.051 (-1.149) 0.154*** (2.804) 1.553* (1.914) |
-1.466*** (-3.672) -0.523* (-1.899) -0.007 (-0.130) 0.191 (1.121) 0.975 (1.724) -1.132 (-0.747) |
-0.531 (-1.454) -0.005 (-0.023) 0.148 (1.360) 0.051 (0.923) -0.739* (-1.774) 0.046 (0.096) |
-2.617*** (-6.669) 1.625 (1.370) 0.704*** (11.997) 1.061 (1.665) 0.027*** (3.812) -10.782 (-1.709) |
-1.680*** (-3.832) 1.427*** (6.065) 0.155 (1.652) 0.457* (2.404) 0.127 (0.166) -4.009 (-2.307) |
-0.262 (-0.293) 1.418*** (6.238) 0.351*** (6.945) -0.100 (-1.079) 0.127 (0.166) 0.333 (0.386) |
0.385** (1.999) -0.588* (-2.176) 0.012 (0.943) 0.659*** (13.349) 0.228 (0.745) -5.097*** (-12.447) |
|
Obs. F-value Adj. R2 DW statistic |
105 18.858*** 0.654 1.893 |
105 66.074*** 0.962 1.822 |
||||||
Notes: PROFIT = Profitability; TANGI = Asset tangibility; GROWTH = Growth opportunities; SIZE = Firm size; BUSINESS RISK = Business risk. Figures in parentheses are t-statistics for book leverage regressions. Asterisks *, **, and *** denote significance at the 10%, 5%, and 1% levels, respectively.
7. Conclusion
This study examines the determinants of corporate capital structure of various sectors in the Bursa Malaysia Main Market with the objective to establish whether the determinants of capital structure can be explained by either the trade-off or the pecking order theory. This research also investigates whether there are any differences between the regressions for any two sectors or not. This paper applies both the OLS and SUR estimators to estimate the leverage models and subsequently determines the efficiency of each estimator.
The results reveal that profitability, asset tangibility, growth opportunities, and firm size are important determinants of corporate capital structure. However, the signs of the regression coefficients suggest that the trade-off and the pecking order theories are complementary. Moreover, the importance of some of these determinants differs across sectors. In most cases of the regression analyses between two sectors, the SUR estimator is found to be more efficient in explaining the capital structure determinants among the various sectors as indicated by the Breusch-Pagan LM test. Hence, this paper concludes that the SUR method could serve as a useful alternative methodology for capital structure research.
Several limitations of this study need to be highlighted. First, this study is only confined to firm-specific variables. Future research may extend this study to include other factors such as macroeconomic variables and institutional factors, especially when dealing with multi-country analysis. Second, this study did not account for the possible effects of the Global Financial Crisis of 2008. As such, future research may consider incorporating structural breaks into the regression models.
References
Al-Dhamari, R., & Ku Ismail, K. N. I. (2014). Cash Holdings, Political Connections, and Earnings Quality: Some Evidence from Malaysia. International Journal of Managerial Finance, 11(2), 215–231. https://doi.org/10.1108/ijmf-02-2014-0016
Altinkiliç, O., & Hansen, R. S. (2000). Are There Economies of Scale in Underwriting Fees? Evidence of Rising External Financing Costs. Review of Financial Studies¸ 13(1), 191–218. https://doi.org/10.1093/rfs/13.1.191
Baker, M., Ruback, R. S., & Wurgler, J. (2007). Behavioral corporate finance. In B. E. Eckbo (Ed.), Handbook of Corporate Finance–Empirical Corporate Finance, Vol. 1 (pp. 146–186). Amsterdam: Elsevier. https://doi.org/10.1016/b978-0-444-53265-7.50026-3
Bhaird, C., & Lucey, B. M. (2010). Determinants of Capital Structure in Irish SMEs. Small Business Economics, 35(3), 357–375. https://doi.org/10.1007/s11187-008-9162-6
Breusch, T. S., & Pagan, A. R. (1980). The Lagrange-Multiplier Test and Its Applications to Model Specification in Econometrics. Review of Economic Studies, 47(1), 239–253. https://doi.org/10.2307/2297111
Cadavez, V. A. P., & Henningsen, A. (2012). The Use of Seemingly Unrelated Regression to Predict the Carcass Composition of Lambs. Meat Science, 92(4), 548–553. https://doi.org/10.1016/j.meatsci.2012.05.025
Canarella, G., Nourayi, M., & Sullivan, M. J. (2014). An Alternative Test of the Trade-Off Theory of Capital Structure. Contemporary Economics, 8(4), 365–386. https://doi.org/10.5709/ce.1897-9254.151
Chang, X., & Dasgupta, S. (2011). Monte Carlo Simulations and Capital Structure Research. International Review of Finance, 11(1), 19–55. https://doi.org/10.1111/j.1468-2443.2011.01126.x
Chong, T. T. L., & Law, T. Y. (2012). The Capital Structure Adjustments of Firms in Five Asian Economies. International Journal of Business and Society, 13(1), 1–18.
Chow, Y. P., Muhammad, J., Bany-Ariffin, A. N., & Cheng, F. F. (2018). Macroeconomic Uncertainty, Corporate Governance and Corporate Capital Structure. International Journal of Managerial Finance, 14(3), 301–321. https://doi.org/10.1108/ijmf-08-2017-0156
Cook, D. O., Fu, X., & Tang, T. (2016). Are Target Leverage Ratios Stable? Investigating the Impact of Corporate Asset Restructuring. Journal of Empirical Finance, 35, 150–168. https://doi.org/10.1016/j.jempfin.2015.11.003
Dang, V. A., Kim, M., & Shin, Y. (2014). Asymmetric Adjustment Toward Optimal Capital Structure: Evidence from a Crisis. International Review of Financial Analysis, 33, 226–242. https://doi.org/10.1016/j.irfa.2014.02.013
DeAngelo, H., & Masulis, R. (1980). Optimal Capital Structure under Corporate and Personal Taxation. Journal of Financial Economics, 8(1), 3–29. https://doi.org/10.1016/0304-405x(80)90019-7
De Jong, A., Verbeek, M., & Verwijmeren, P. (2010). The Impact of Financing Surpluses and Large Financing Deficits on Tests of the Pecking Order Theory. Financial Management, 39(2), 733–756. https://doi.org/10.1111/j.1755-053x.2010.01090.x
Ebrahim, M. S., Girma, S., Shah, M. E., & Williams, J. (2014). Dynamic Capital Structure and Political Patronage: The Case of Malaysia. International Review of Financial Analysis, 31, 117–128. https://doi.org/10.1016/j.irfa.2013.11.004
Fama, E. F., & Miller, M. H. (1972). The Theory of Finance. New York: Holt, Rinehart and Winston.
Frank, M. Z., & Goyal, V. K. (2009). Capital Structure Decisions: Which Factors are Reliably Important? Financial Management, 38(1), 1–37. https://doi.org/10.1111/j.1755-053x.2009.01026.x
González, V. M., & González, F. (2012). Firm Size and Capital Structure: Evidence Using Dynamic Panel Data. Applied Economics, 44(36), 4745–4754. https://doi.org/10.1080/00036846.2011.595690
Graham, J. R., & Leary, M. T. (2011). A Review of Empirical Capital Structure Research and Directions for the Future. Annual Review of Financial Economics, 3(1), 309–345. https://doi.org/10.1146/annurev-financial-102710-144821
Harris, M., & Raviv, A. (1991). The Theory of Capital Structure. Journal of Finance, 46(1), 297–355.
Hart, O., & Moore, J. (1995). Debt and Seniority: An Analysis of the Role of Hard Claims in Constraining Management. American Economic Review, 85(3), 567–585. https://doi.org/10.3386/w4886
Jensen, M. C., & Meckling, W. H. (1976). Theory of the Firm: Managerial Behavior, Agency Costs and Ownership Structure. Journal of Financial Economics, 3(4), 305–360. https://doi.org/10.1016/0304-405x(76)90026-x
Jensen, M. C. (1986). Agency Costs of Free Cash Flow, Corporate Finance, and Takeovers. American Economic Review, 76(2), 323–329. https://doi.org/10.1017/cbo9780511609435.005
Keshavarzi, S., Ayatollahi, S. M. T., Zare, N., & Sharif, F. (2012). Quality of Life of Childbearing Age Women and Its Associated Factors: An Application of Seemingly Unrelated Regression (SUR) Models. Quality of Life Research, 22(6), 1255–1263. https://doi.org/10.1007/s11136-012-0250-3
Lau, W. T., Law, S. H., & Nassir, A. M. (2016a). Debt Maturity and Stock Returns: An Inter-Sectoral Comparison of Malaysian Firms. Asian Academy of Management Journal of Accounting and Finance, 12(2), 37–63.
Lau, W. T., Law, S. H., Nassir, A. M., & Sarmidi, T. (2016b). Role of Cash Flows in Firm-Level Leveraged Returns within Industry in Bursa Malaysia. Capital Markets Review, 24(2), 40–58.
Lemmon, M. L., & Zender, J. F. (2010). Debt Capacity and Tests of Capital Structure Theories. Journal of Financial and Quantitative Analysis, 45(5), 1161–1187. https://doi.org/10.1017/s0022109010000499
Li, L., & Islam, S. Z. (2019). Firm and Industry Specific Determinants of Capital Structure: Evidence from the Australian Market. International Review of Economics and Finance, 59, 425–437. https://doi.org/10.1016/j.iref.2018.10.007
Mazur, K. (2007). The Determinants of Capital Structure Choice: Evidence from Polish Companies. International Advances in Economic Research, 13(4), 495–514. https://doi.org/10.1007/s11294-007-9114-y
Miller, M. H., & Scholes, M. S. (1978). Dividends and Taxes. Journal of Financial Economics, 6(4), 333–364.
Modigliani, F., & Miller, M. H. (1958). The Cost of Capital, Corporation Finance and the Theory of Investment. American Economic Review, 48(3), 261–297.
Modigliani, F., & Miller, M. H. (1963). Corporate Income Taxes and the Cost of Capital: A Correction. American Economic Review, 53(3), 433–443.
Mukherjee, S., & Mahakud, J. (2012). Are Trade-Off and Pecking Order Theories of Capital Structure Mutually Exclusive? Journal of Management Research, 12(1), 41–55.
Myers, S. C. (1977). Determinants of Corporate Borrowing. Journal of Financial Economics, 5(2), 147–75.
Myers, S. C. (1984). The Capital Structure Puzzle. Journal of Finance, 39(3), 575–592.
Myers, S. C., & Majluf, N. S. (1984). Corporate Financing and Investment Decisions When Firms Have Information that Investors Do Not Have. Journal of Financial Economics, 13(2), 187–221. https://doi.org/10.1016/0304-405x(84)90023-0
Nugroho, V. C., & Suk, K. S. (2019). The Relationship between Leverage, Maturity, and Investment Decision: Evidence from Emerging Markets. Organizations and Markets in Emerging Economies, 10(1), 147–164. https://doi.org/10.15388/omee.2019.10.00008
Ramakrishnan, S. (2012). Sectoral Analysis of Capital Structure Determinants among the Malaysian Listed Firms (Unpublished PhD thesis). Australia: Deakin University.
Shanmugasundaram, G. (2008). Intra-Industry Variations of Capital Structure in Pharmaceutical Industry in India. International Research Journal of Finance and Economics, 16, 162–174.
Shen, C. H. (2014). Pecking Order, Access to Public Debt Market, and Information Asymmetry. International Review of Economics and Finance, 29(1), 291–306. https://doi.org/10.1016/j.iref.2013.06.002
Shyam-Sunder, L., & Myers, S. C. (1999). Testing Static Tradeoff against Pecking Order Models of Capital Structure. Journal of Financial Economics, 51(2), 219–244. https://doi.org/10.3386/w4722
Stiglitz, J. E. (1973). Taxation, Corporate Financial Policy, and the Cost of Capital. Journal of Public Economics, 2, 1–34. https://doi.org/10.1016/0047-2727(73)90008-x
Sun, J., Ding, L., Guo, J. M., & Li, Y. (2015). Ownership, Capital Structure and Financing Decisions: Evidence from the U.K. British Accounting Review, 48(4), 1–16.
Versmissen, J., & Zietz, J. (2017). Is There a Leverage Target for REITs? Quarterly Review of Economics and Finance, 66, 57–69. https://doi.org/10.1016/j.qref.2017.01.001
Zellner, A. (1962). An Efficient Method of Estimating Seemingly Unrelated Regressions and Tests for Aggregation Bias. Journal of the American Statistical Association, 57, 348–368. https://doi.org/10.1080/01621459.1962.10480664
1 The terms “capital structure” and “leverage” are applied interchangeably in this paper.
2 The OLS and SUR methods have been adopted to test the association between variables in numerous empirical studies (e.g., see Al-Dhamari & Ku Ismail, 2014; Cadavez & Henningsen, 2012; Keshavarzi et al., 2012; Bhaird & Lucey, 2010). Moreover, past capital structure research has widely adopted the OLS method to find the determinants of corporate capital structure (e.g., see Shen, 2014; De Jong et al., 2010).
3 Besides asymmetric information, it has been shown that the pecking order theory can also be generated by other imperfections. For instance, firms may prefer debt to equity due to corporate taxes (Stiglitz, 1973), agency costs or incentive conflicts (Jensen & Meckling, 1976), transaction costs (Altinkiliç & Hansen, 2000), or excessive managerial optimism (Baker et al., 2007).
4 The leverage model is tested in its linear form. Preliminary data analyses did not detect the presence of non-linearities in the data.
5 This also implies that firms with fewer tangible assets would face more difficulties in obtaining debt financing. Empirically, it has been shown that firms with fewer tangible assets (e.g., firms operating in the technology sector) have lower leverage ratios (e.g., Li & Islam, 2019), which is in support of the trade-off theory.
6 González and González (2012) investigate the influence of firm size on capital structure and demonstrate that there are variations in the importance of the trade-off theory and the pecking order theory in explaining the capital structure choices among large, medium-sized, and small firms in Spain. Precisely, the authors find that small firms tend to follow the predictions of the pecking order theory. Nonetheless, there are no notable differences among large, medium-sized, and small firms in their speed of adjustment to the target leverage ratio as postulated by the trade-off theory.
7 Put differently, the capital structures of these sectors are ascertained by capital requirements, which may differ from firms in the remaining sectors (Bhaird & Lucey, 2010). It is customary for capital structure studies to exclude these firms (e.g., Nugroho & Suk, 2019; Ebrahim et al., 2014).