Organizations and Markets in Emerging Economies ISSN 2029-4581 eISSN 2345-0037
2019, vol. 10, no. 2(20), pp. 174–195 DOI: https://doi.org/10.15388/omee.2019.10.9
Relationship Marketing Estimation Model in Emerging Economies: Dyadic Versus Non-dyadic Approach
Anton Agus Setyawan (Corresponding author)
Program Studi Manajemen, Fakultas Ekonomi dan Bisnis
Universitas Muhammadiyah Surakarta, Jawa tengah, Indonesia
anton.setyawan@ums.ac.id
https://orcid.org/0000-0001-9664-7818
Bernardinus M. Purwanto
Program Studi Manajemen, Fakultas Ekonomi dan Bisnis
Universitas Gadjah Mada, Yogyakarta, Indonesia
Basu Swastha Dharmmesta
Program Studi Manajemen, Fakultas Ekonomi dan Bisnis
Universitas Gadjah Mada, Yogyakarta, Indonesia
Sahid Susilo Nugroho
Program Studi Manajemen, Fakultas Ekonomi dan Bisnis
Universitas Gadjah Mada, Yogyakarta, Indonesia
Abstract. The purpose of this study is to analyze two estimation models related to relationship marketing in business-to-business interactions in the context of emerging economies. We compare two estimation models – one based on a dyadic approach and another based on a non-dyadic approach. We estimate these two models and compare their results to see which one is more suitable to be used as a theoretical relationship marketing model. We developed a survey comprising 204 dyadic observations of retailers and their suppliers and used a purposive sampling method. Three different observations correspond to three different estimation models. This study shows that the estimation model based on a dyadic approach has a better model fit than the model based on a non-dyadic approach regarding relationship marketing in a business-to-business context. The dyadic model also gives more accurate information to explain behaviour among companies involved in business relationships. Furthermore, this study explains how to examine estimation models in a relationship marketing context using dyadic and non-dyadic approaches. We also develop methods for examining dyadic perceptions of companies involved in business relationships. Our results contribute to the IMP school of thought in relationship marketing.
Keywords: relationship marketing, dyadic approach, trust, commitment.
Received: 7/4/2019. Accepted: 11/5/2019
Copyright © 2019 Anton Agus Setyawan, Bernardinus M. Purwanto, Basu Swastha Dharmmesta, Sahid Susilo Nugroho. Published by Vilnius University Press. This is an Open Access article distributed under the terms of the Creative Commons Attribution Licence, which permits unrestricted use, distribution, and reproduction in any medium, provided the original author and source are credited.
1. Introduction
There are two major arguments in the research of the relationship marketing model, namely dyadic and non-dyadic approaches (Lindgreen, 2001; Palmer, Lindgreen & Vanhamme, 2005). Morgan and Hunt (1994) examined the constructs of trust and commitment in the supply chain of the US automotive industry by employing a dyadic approach in the measurement. Similarly, Heide and John (1988) and Kim (2000) used a dyadic approach to analyze the exchange relationships between suppliers and retailers within a relationship marketing framework. Meanwhile, Affran, Dza and Oduro (2019) conducted a study of relationship marketing in the banking industry to measure the impact of relationship marketing strategy on consumer’s loyalty using a non-dyadic approach. We compare dyadic and non-dyadic approaches to analyze such partnership by using the relationship marketing model. The results of this study are expected to give insight for relationship marketing researchers, especially those who are interested in analyzing the business-to-business market. Table 1 shows the comparison between dyadic- and non-dyadic-based estimation models in relationship marketing.
Table 1. Comparison of Dyadic and Non-Dyadic Estimation Models in Relationship Marketing
|
Components |
Dyadic Estimation Model |
Non-Dyadic Estimation Model |
|
Unit of Analysis |
A pair or set of individuals or organizations |
An individual or organization |
|
Research Setting |
Business to Business |
Business to Consumer |
|
Model Examination |
1. Average value of both sides perception 2. Value of perceptual difference between individuals or organizations involved in a relationship 3. Measurement of several constructs by different parties in a relationship |
1. Average value of individual or organization perception 2. Sum of perceptual score of individual or organization perception |
Source: Kim (2000), Ramaseshan et al. (2006), Bigne and Blesa (2003)
Furthermore, detailed measurements of relationship marketing with the dyadic and non-dyadic estimation models are also carried out. In this context, the estimation model is defined as a model that describes the relationship between variables or constructs and their measurements along with the unit of analysis (McKay & Miller, 2019). Specifically, the estimation model is described by a mathematical equation to explain the relationship between constructs. In this study, estimation models in mathematical equations are used for both the dyadic and non-dyadic approach.
Palmer et al. (2005) identify three schools of thought in relationship marketing: the Nordic School, the Industrial or International Marketing and Purchasing (IMP) Group, and the Anglo-Australian School. These three schools of thought provide the basic concept of relationship models developed in the present study in which the models will be represented by several variables, including trust and commitment. The Nordic school is related with the process of integration among functions in a company to achieve marketing goals (i.e., customer loyalty, extending customer life cycle). This school usually becomes a theoretical framework in business-to-consumer (B2C) as well as in business-to-business (B2B) research.
The Industrial or International Marketing and Purchasing (IMP) Group focuses on factors explaining organizational relationship in business-to-business markets. This school has a basic assumption that in the first stage, business relationship in B2B markets is based on transaction. However, there are various factors that explain a business relationship between two or more organizations lasting for a long-term period and give mutual benefit to each party involved. Those factors include satisfaction, commitment, trust and relationship quality (Palmer et al., 2005; Grewal et al., 2019). The Anglo Australian school of thought relies on the relationship between a company and the end customer (business to customer). In this school of thought, discussion on theoretical framework emphasizes quality and customer service (Gronroos, 1994).
Kim (2000) argued the necessity to obtain information from two or more companies in order to comprehensively understand the impact of a particular business relationship. This is known as the basic assumption of the dyadic relationship marketing model. Meanwhile, Ramaseshan, Yip and Pae (2006) suggested that the relationship marketing model can be measured without using the dyadic approach since each party in a business partnership carries out specific efforts to reinforce the business relationship and gain the impact of such relationship.
We identify the gap between the three schools of thought in relationship marketing. It especially emerges in the context of business-to-business relationship. In this setting, the perceptions of the parties involved in the business relationship can be assessed by using the dyadic approach. We compare the dyadic approach of the estimation model of Nordic and IMP Schools with the non-dyadic model of the Anglo-Australian School.
This paper examines a research model based on the trust and commitment theory developed by Morgan and Hunt (1994), in which the constructs of commitment and trust become the key mediating variables (KMV) that mediate the variable of coercive power. Moreover, the model of relationship marketing developed by Ramaseshan et al. (2006) that underlines the effect of coercive forces on the firm’s strategic performance as mediated by the construct of commitment is also involved.
Essentially, this paper aims to analyze the implementation of the dyadic approach in testing the estimation model of the influence of power on the firm’s strategic performance as mediated by commitment and trust. This study compares the non-dyadic relationship marketing estimation model by using single perception in business relationship with the dyadic-tested estimation model by using perception of both parties a business relationship. The dyadic approach employed in this study is a method formulated by Kim (2000), which uses the average score and the difference score of each construct perceived by each party in a business relationship.
Indonesia, one of the emerging economies in Southeast Asia, becomes the setting of the study. In 2009, OECD (Organization for Economic Cooperation and Development) published a policy brief that included Indonesia in emerging economies in the world. The term BRIICS comprises 6 countries which had rapid economic growth from 1999 to 2009. They are Brazil, Russia, India, Indonesia, China and South Africa (OECD, 2009). These countries have had excellent economic performance indicators in the last 10 years. Some of these indicators include GDP, investment and industrial growth. Table 2 shows selected economic indicators of the BRIIC countries in 2019.
Table 2. Selected Economic Indicators of BRIIC Countries, 2000-2018
|
Countries |
GDP Growth |
Industry Growth |
Service Growth |
|
Brazil |
2.7 |
1.6 |
3.0 |
|
Russia |
3.3 |
2.3 |
4.2 |
|
India |
6.8 |
7.1 |
8.0 |
|
Indonesia |
5.5 |
4.4 |
7.1 |
|
China |
9.5 |
10.2 |
10.1 |
|
South Africa |
2.8 |
1.9 |
3.4 |
Source: World Development Indicator, 2019, www.worldbank.org
Table 2 shows that Indonesia has consistently become an emerging economy in 18 years with an average GDP growth of 5.5 percent. Furthermore, service growth in this country is also consistent, with an average growth of 7 percent in 18 years.
The business relationship between the small and medium-sized enterprises (SMEs) and large scale companies becomes the focus of this study. This partnership has been encouraged and regulated by the government in order to improve SMEs business performance.
2. Literature Review
2.1 The Schools of Thought in Relationship Marketing
Morgan and Hunt (1994) define relationship marketing as activities directed toward establishing, developing, and maintaining successful relational exchanges. Gronroos (1994; 2017) defines relationship marketing as marketing to establish, maintain and enhance relationships with consumers and partners, at a profit, so that the objectives of the parties involved are met. Berry (1983) defines relationship marketing as attracting, maintaining, and – in multi-service organizations – enhancing customer relationship. Gummesson (1991) defines the concept of relationship marketing as the construction of relationship that involves giving promises, maintaining relationship based on promises that are kept, and enhancing relationships by giving several new promises on terms that former promises have been kept.
Palmer et al. (2005) described three major schools of thought in relationship marketing: the Nordic school, the Industrial or International Marketing and Purchasing (IMP) Group, and the Anglo-Australian School. The Nordic School has a fundamental view that when the market is in a maturity state and technology is evolving, the opportunities for differentiation decrease. As a consequence, service and price represent the only remaining means of creating competitiveness. Furthermore, it perceives marketing as a cross-functional process and not just the responsibility of those within the function.
The IMP Group holds an approach in relationship marketing which is common in business-to-business market research. In business-to-business markets, buyers and sellers are fewer but larger, and the transaction values are greater and, therefore, of higher significance (Palmer et al., 2005). In general, marketing activities in business-to-business markets involve a relationship between two organizations. This relationship raises problems related with changes in the external environment, such as: market concentration, high switching costs and perception of risk. Organizations change the nature of their business relationship from competition to co-operation, and, subsequently, transform it into a strategy of risk reduction (Palmer et al., 2005). Interaction of organizations and individuals within business-to-business relationship becomes the unit of analysis of the IMP approach. It means that the unit of analysis in the IMP approach is dyadic.
The Anglo-Australian approach views the traditional marketing paradigm as based on quality and service. All activities of building quality and designing service aim to deliver values to consumers, by maintaining good long-term relationships with them. A marketer should build and maintain relationship with consumers to support the process of production and deliver value to them (Palmer et al., 2005).
The three schools of thought in relationship marketing become the foundation in building the research model. Hoque and Rana (2019) identify that research in business to business, in terms of buyer-supplier relationships, tends to be carried out based on various models. Dyadic models in business-to-business research provide an overview of the companies involved in business relationships, particularly about their strategies to influence business partners and their impact on their business (Grewal et al., 2019). However, many studies in relationship marketing employ the non-dyadic approach for certain reasons, including reducing the complexity in measurement and relationship marketing in business-to-consumer setting.
2.2 Research Traditions in Relationship Marketing
Eiriz and Wilson (2006) classified research traditions of relationship marketing into two categories: research focusing on organizational markets and goods, and research focusing on consumer markets and services. The first category was initiated by discussion on channels in marketing literature of the 1970s. El Ansary and Stern (1972) examined the distribution channel with an emphasis on the topics of the power, conflict and inter-organizational relationships. Such issues turned into important dimensions in the early development of relationship marketing. Furthermore, Eiriz and Wilson (2006) suggested that relationship marketing focusing on discussion about exchange relationships becomes the dominant paradigm in marketing.
Advancement in information and technology has encouraged the development of relationship marketing in consumer markets. In practice, the development of marketing databases is an example of extending the concept of relationship marketing in services. Berry (1983) emphasized the importance of extending the concept of relationship marketing in services. There are several issues of relationship marketing in services that attract scholars in marketing such as discussion of customer loyalty in the banking sector (Ndubisi, 2007), customer satisfaction in banking services (Leverin & Lilijander, 2006), and intention and future behavior in retail industry (Fullerton, 2005).
2.3 Dyadic Approach in Relationship Marketing Research
In general, the dyadic approach requires a pair of respondents in the observation phase. It relates to assessment that involves interactions between two entities as the objects. Lindgreen (2001) provided an example of dyadic research design in qualitative research. The procedure involved an in-depth interview with two parties whose perceptions were analyzed. Furthermore, the similarities and dissimilarities were observed and interpreted as a unit of analysis.
Kim (2000) used different techniques to examine the dyadic unit of analysis. This study analyzes a manufacturer and its suppliers as the unit of analysis. The value of perceptual differences between a manufacturer and suppliers was determined. This value was used to reveal the variables of power and control within the dyad. Furthermore, Kim (2000) used the average value of perceptions between suppliers and the manufacturer to measure the construct of trust.
Plewa and Quester (2008) criticized Kim’s dyadic approach (2000) by arguing the risk of the value of difference in eliminating the meaning of the measured constructs, due to the complexity to determine the maximum and minimum value. Moreover, the average value is also at risk of eliminating important information, for instance, if one party claims to be very satisfied, with the value 5, while the other declares either indecisive or neutral, with the value 3, thus the average value will be 4, which means satisfied. Plewa and Quester suggested dyadic calculations by multiplication of scores between one party and its partner in the dyadic unit of analysis. Multiplication will accommodate the value of difference and the magnitude of respondents’ perception score.
Bigne and Blesa (2003) utilized different dyadic measurement methods to analyze the effect of market orientation on trust and commitment in the relationship between suppliers and distributors in the ceramic industry in Spain. It disclosed the perceptions of the two sides of the dyad for different constructs. Bigne and Blesa (2003) also revealed the perception of market orientation from the supplier side as well as trust and commitment measured from the distributor side.
2.4 Conceptual Model
In this study, the conceptual model is adopted from Morgan and Hunt (1994), Kim (2000) and Ramaseshan et al. (2006). It is not concentrated on the relationship between constructs but rather on the goodness of fit model to compare the research designs with the dyadic approach and non-dyadic approach.
Conceptual model of this study is developed based on Morgan and Hunt’s Trust-Commitment Theory (1994). This concept relies on two key mediating variables (KMV): trust and commitment. In this study, trust and commitment mediate the relationship between power asymmetry and strategic performance of companies in business relationship. Business relationship between two or more companies has the ultimate goal of increasing the performance. Strategic performance consists of several constructs, namely: satisfaction, loyalty, and economic performance (Ramaseshan et al., 2006). Satisfaction in this conceptual model is related with the satisfaction of an organization with the benefits of the relationship (Terawatanavong et al., 2007). In addition, satisfaction also refers to the organization’s positive attitude towards decisions in business relationships that provide strategic advantages to the company (Gaski & Nevin, 1985).
The concept of loyalty in this research model refers to the consideration of staying in a business relationship because of the benefits from it (Rayruen & Miller, 2007). Organizations maintain a business relationship for a long term due to two reasons, both related with strategic interests. First, organizations stay in a business relationship due to economic benefit of such relationship. Second, organizations keep a partnership in business since it has lower cost compared to other business relationship with a different business partner (Hoque et al., 2019).
Economic performance, such as profit growth, sales growth, sales growth and market share, is related with direct effect of a business relationship on companies (Mas-Ruiz, 2000; Kim, 2000; Corsten & Kumar, 2005). The ultimate reason for an organization to build a long-term business relationship is economic benefit. Economic benefit from a business relationship is the easiest and simplest measurement of company performance. It also becomes a consideration factor in deciding whether to maintain or terminate a business relationship (Ramaseshan et al., 2006; Neill & Rose, 2006).
Maloni and Benton (2000) identify the asymmetry of power, or influence among companies in a business relationship. Companies are inclined to use power or influence to assert their interest to their partners (Keysuk, 2000). Certain conditions also trigger the occurrence of power asymmetry in a business relationship. It automatically affects the quality of relationship and business performance (Bandara et al., 2017; Li et al., 2013). Figure 1 shows the relationship between constructs in the relationship marketing conceptual model.
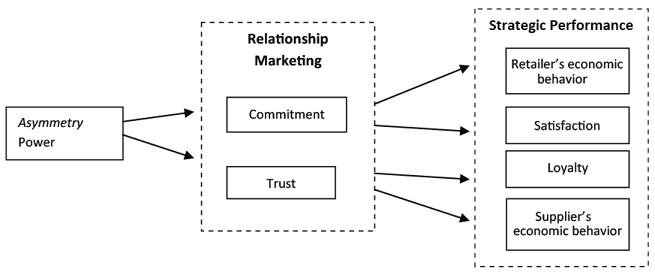
Figure. 1. Research Model
Sources: Morgan and Hunt (1994); Ramaseshan et al. (2006); Kim (2000).
The estimation model of relationship marketing is described in mathematical equations below:
1) Commitment = a11 + b12 power asymmetry + e13
2) Trust = a21 + b22 power asymmetry + e23
3) Satisfaction = a31 + b32 commitment + b33 trust + e34
4) Loyalty = a41 + b42 commitment + b43 trust + e44
5) Supplier’s business performance = a51 + b52 commitment + b53 trust + e54
6) Retailer’s business performance = a61 + b62 commitment + b63 trust + e64
Those mathematical equations are used to estimate the dyadic and non-dyadic models in this study.
The relationship marketing model used in this study is expected to fit the business relationship in emerging economies. This study was conducted in Indonesia, which is one of emerging economies (or countries) in Asia. Kumar et al. (2015) examined the role of company’s power in the business relationship between SMEs and large companies in supply chain management of the manufacturing industry in India. In the present study, SMEs are presumed to confront the strategy of their powerful partner, i.e., large companies. A preliminary study of the relationship marketing between SMEs and large companies in Indonesia found the occurrence of power asymmetry in this relationship (Setyawan et al., 2016).
3. Research Method
3.1 Population and Sample
The population in this research is retail companies in major cities in Java, i.e., Surakarta, Yogyakarta and Semarang. These cities were selected based on the contribution of trade, hotel and restaurant sectors to Regional Gross Domestic Product (RGDP). Manufacturing and trading industries were dominant contributors to GDP of those cities. Table 3 shows the contributions of trade sectors to RGDP.
Table 3. Contribution of Trade Sectors to RGDP of Selected Cities in Java in 2017 (in million Rp)
|
No |
City |
Trade Sector |
RGDP |
Percentage |
|
1. 2. 3. 4. 5 6. |
Jakarta Bandung Semarang Yogyakarta Surakarta Surabaya |
55.799.500 22.960.610 12.890.615 2.921.837 1.396.825 47.530.000 |
263.095.200 82.002.180 46.037.910 12.847.988 5.337.315 176.440.000 |
21.20 28.00 28.00 22.70 26.17 26.90 |
Source: Central Bureau of Statistics (2019)
Table 3 indicates that Surakarta and Semarang are the cities with the largest percentage of trade sector contribution, while Yogyakarta is the city with the lowest percentage. The Indonesian Retailer Association (APRINDO) of Central Java and Yogyakarta Special Region notes that approximately 323 retail companies are registered as members. To obtain the variation of power, we collected data about the dyadic SME to large company business relationship.
We employ the purposive sampling method based on methods developed by Neuman (2000, p. 192) and Cooper and Schindler (2001, p. 192). The characteristics of the respondents should match the following criteria: they have a structured financial report, and the business relations last at least a year. These characteristics are determined based on the procedure of business evaluation that is performed once in three months, hence evaluation is done at least twice prior to this study.
3.2 Sample Design
The unit of analysis in this research is the dyadic relationship between a supplier and a retailer. Based on the unit of analysis, the school of thought of the IMP Group that uses the dyadic unit of analysis is employed to see the pattern of exchange relations between two organizations.
The IMP Group approach emerged from the phenomenon in business to business (B2B). In B2B marketing, transactions are few compared to business to consumer (B2C), but the transaction value is higher. In addition, transactions in B2B are the result of the interaction between two organizations. Such interaction occurs between companies, and many individuals within companies (Palmer et al., 2005). Business relationships entail start-up activities and sharing of resources with the involved individuals (Hakansson, 1982). It indicates that the unit of analysis in this approach is dyadic. In this study, the dyadic model refers to a combination of average value, value of difference, Kim’s model (2000) and measurement of the perception of several constructs from different parties as suggested by Bigne and Blesa (2003). Diverse methods were employed to measure the variables in accordance with the nature of the concerned construct.
The power asymmetry construct was estimated by assessing the differences between the perceptions of suppliers and retailers. The constructs of commitment, trust, satisfaction and loyalty were measured by the average value of those perceptions. The construct of economic behavior was examined from two sides/parties, thus there were two constructs used to measure the supplier’s economic behavior and the retailer’s economic behavior.
3.3 Operational Definition and Measurement of Variables
Table 4 summarizes the operational definition and measurement of variables in this study.
Table 4. Variable Measurement Dimensions
|
No |
Variable |
Measurement Dimension |
Source |
|
1. |
Power asymmetry |
Control toward quality, price, and discount Payment milestone Sanction and penalty |
Ramaseshan et al. (2006); Kim (2000); Maloni & Benton (2000) |
|
2. |
Supplier’s and Retailer’s Commitments |
Business relationship duration The level of dependency Transfer cost calculation Business partner alternative |
Wu et al. (2004); Srinivasan & Moorman (2005) |
|
3. |
Supplier’s and Retailer’s Satisfaction |
Positive perception toward the benefits of business relationships Positive perception toward the decisions of business partners |
Gaski & Nevin (1985); Terawatanavong et al. (2007) |
|
4. |
Supplier’s and Retailer’s Trust |
Fulfillment of appointments to business partners Information about changes in policy Consistency and honesty to business partners |
Wu et al. (2004); Kim (2000); Ryu et al. (2008) |
|
5. |
Supplier’s and Retailer’s Loyalties |
Business relationship duration Intensity of business transaction Reference for other parties about the quality of partner |
Rauyruen & Miller (2007); Fullerton (2005) |
|
6. |
Supplier’s Business Performance |
Sales growth Profit growth Market share Overall benefits |
Ruiz (2000); Kim(2000); Corsten & Kumar (2005); Ramaseshan et al. (2006); Neill &Rose (2006) |
|
7. |
Retailer’s Business Performance |
Sales growth Profit growth Market share Overall benefits |
Ruiz (2000); Kim(2000); Corsten & Kumar (2005); Ramaseshan et al. (2006); Neill & Rose (2006) |
4.1 Data Analysis and Discussion
The procedure of data analysis is to compare three estimation models developed by Morgan and Hunt (1994), Kim (2000), and Ramaseshan et al. (2006). From the supplier side, the discussion uses a model comparison technique with Path Analysis.
This study involved suppliers and retailers as the samples. 216 suppliers and 216 retailers were targeted as the respondents. In the process of data collection, only 204 questionnaires collected from suppliers and 205 questionnaires collected from retailers could be processed. The number of observations for suppliers and retailers were 204 and 205 units, respectively. As for the dyadic model, there were 204 dyads that could be used as the units of analysis.
Testing the validity and reliability of measurement was also done by comparing perception of the supplier and retailer sides, and the dyadic approach. Table 5a shows the results of validity testing from the supplier side, Table 5b presents the results of validity testing from the retailer side.
The result of construct validity testing for each construct in the non-dyadic model indicates that the factor loading value of several items of the question is low. Moreover, there are many invalid questions. Direct comparison identifies that the construct validity of the supplier side has a higher factor loading value than the retailer side.
Table 6 shows the results of reliability testing of each construct based on the supplier and retailer sides. Cronbach’s Alpha was used to examine the reliability.
Table 5a. Factor Loading and Pattern Matrix of the Supplier Research Instruments
|
No |
Indicators |
Satisfaction |
Loyalty |
Trust |
Commit- |
Perfor- |
Power |
|
1. 2. 3. 4. 5. 6. 7. 8. 9. 10. 11. 12. 13. 14. 15. |
SS2 SS3 SS4 SL3 Sl4 ST1 ST3 SC2 SC4 SEP2 SEP3 SEP4 SPA3 SPA4 SPA5 |
0.631 0.750 0.342 |
0.884 0.608 |
0.641 0.596 |
0.694 0.676 |
0.671 0.523 0.833 |
0.880 0.833 0.917 |
Table 5b. Factor Loading and Pattern Matrix of the Retailer Research Instruments
|
No |
Indicators |
Satisfaction |
Loyalty |
Trust |
Commit- |
Perfor- |
Power |
|
1. 2. 3. 4. 5. 6. 7. 8. 9. 10. 11. 12. 13. 14. 15. 16. 17. 18. 19. |
RS2 RS3 RS4 RS5 RL2 RL3 RL4 RT1 RT3 RC2 RC3 RC4 REP1 REP2 REP3 REP4 RPA3 RPA4 RPA5 |
0.613 0.793 0.749 0.473 |
0.766 0.426 0.723 |
0.311 0.343 |
0.867 0.467 0.796 |
0.441 0.647 0.856 0.808 |
0.600 0.654 0.742 |
Table 6. Results of Reliability Testing from the Supplier and Retailer Sides
|
No. |
Construct |
Cronbach’s Alpha |
Description |
|
1. 2. 3. 4. 5. 6. 7. 8. 9. 10. 11. |
Supplier’s satisfaction Retailer’s satisfaction Supplier’s loyalty Retailer’s loyalty Supplier’s commitment Retailer’s commitment Supplier’s trust Retailer’s trust Supplier’s power asymmetry Supplier’s performance Retailer’s performance |
0.602 0.669 0.616 0.518 0.642 0.667 0.442 0.630 0.896 0.779 0.842 |
Reliable Reliable Reliable Not reliable Reliable Reliable Not reliable Reliable Reliable Reliable Reliable |
Based on the results of reliability testing, there are two unreliable constructs. The Cronbach’s alpha of those constructs is below the critical value of 0.6 (DeVellis, 1991, p. 85). These constructs are retailer’s loyalty and supplier’s trust. Nevertheless, these constructs are persistently used in the research model analysis. However, there is a risk in using this procedure since by continuing to include constructs that have low internal consistency, we will obtain a model with marginal goodness of fit. On the other hand, if we exclude those constructs, we will have a model specification bias. It will be more serious since it relates with a conceptual or theoretical model (Woody & Sadler, 2005). Therefore, we choose to take marginal goodness of fit as the risk.
The validity and reliability testing of the constructs of both supplier and retailer sides was compared with the validity and reliability testing of the dyadic construct. The second testing was done by calculating the average perception value of the paired supplier and retailer for the constructs of trust, commitment, satisfaction and loyalty. The construct of power asymmetry was measured by calculating the difference of perceptions between the supplier and the retailer. The construct of economic behavior was measured from the respective perception, namely the supplier’s economic behavior and the retailer’s economic behavior. Hence, there were two constructs for economic behavior. Table 7 illustrates the classification of each item in the questionnaire from each construct based on the dyadic approach.
Table 8 shows the results of reliability testing on the constructs derived from the dyadic model with Cronbach’s Alpha.
The results of reliability testing of constructs derived from the dyadic model indicate that there are two unreliable constructs, i.e., construct of trust and coercive power asymmetry. Nevertheless, in testing the model, these constructs were used in the analysis process. We also choose this procedure to prevent the model specification bias.
Table 7. Factor Loading and Pattern Matrix of Research Instruments
with the Dyadic Approach
|
No |
Indicators |
Satisfaction |
Loyalty |
Trust |
Commitment |
Supplier’s performance |
Retailer’s performance |
Power asymmetry 1 |
Power asymmetry 2 |
|
1. 2. 3. 4. 5. 6. 7. 8. 9. 10. 11. 12. 13. 14. 15. 16. 17. 18. 19. 20. 21. 22. 23. 24. |
Satisfaction 1 Satisfaction 3 Satisfaction 5 Loyalty 1 Loyalty 2 Loyalty 3 Trust 2 Trust 4 Commitment 2 Commitment 3 Supplier Supplier Supplier Retailer Retailer Retailer Retailer Retailer Power Power Power Power Power Power |
0.630 0.701 0.652 |
0.760 0.823 0.635 |
0.430 0.463 |
0.872 0.732 |
0.501 0.881 0.586 0.729 |
0.745 0.793 0.884 0.847 |
0.822 0.324 0.389 |
0.431 0.612 0.728 |
Table 8. Results of Reliability Testing with the Dyadic Approach
|
No. |
Construct |
Cronbach’s Alpha |
Description |
|
1. 2. 3. 4. 5. 6. 7. 8. |
Satisfaction Commitment Loyalty Trust Power asymmetry 1 Retailer’s performance Supplier’s performance Power asymmetry 2 |
0.618 0.744 0.737 0.478 0.686 0.842 0.779 0.486 |
Reliable Reliable Reliable Not reliable Reliable Reliable Reliable Not reliable |
Figure 2 shows the results of the estimation model of relationship marketing from the supplier side.
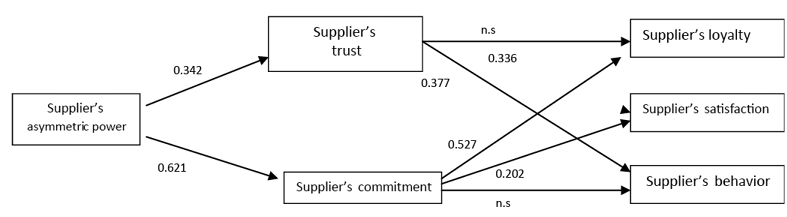
Figure. 2. Estimation Model of Relationship Marketing from the Supplier Side
Table 9. Criteria of Empirical Goodness of Fit Model with Composite Data from the Supplier Side
|
Goodness Of Fit |
Cut Off Value |
Estimation Result |
Description |
|
Chi Square |
Expectedly low |
84.549 |
Good |
|
Probability |
≥ 0.05 |
0.000 |
Good |
|
GFI |
≥ 0.90 |
0.874 |
Moderate |
|
AGFI |
≥ 0.90 |
0.622 |
Moderate |
|
CFI |
≥ 0.95 |
0.780 |
Moderate |
|
RMSEA |
≤ 0.08 |
0.234 |
Marginal |
|
CMIN/DF |
≤ 2.00 |
12.078 |
Marginal |
Figure 3 shows the results of the estimation model from the retailer side.
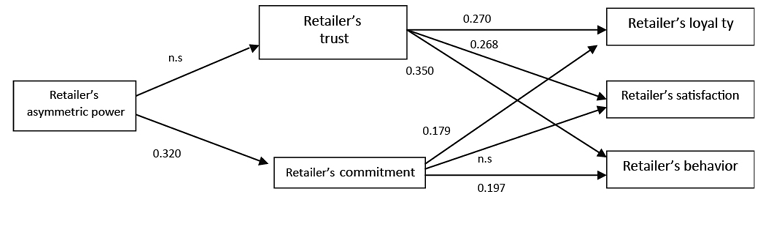
Figure 3. Estimation Model of Relationship Marketing from the Retailer Side
Table 10. Criteria of Empirical Goodness of Fit Model with Composite Data from the Retailer Side
|
Goodness Of Fit |
Cut Off Value |
Estimation Result |
Description |
|
Chi Square |
Expectedly low |
63.583 |
Good |
|
Probability |
≥ 0.05 |
0.000 |
Good |
|
GFI |
≥ 0.90 |
0.899 |
Moderate |
|
AGFI |
≥ 0.90 |
0.696 |
Moderate |
|
CFI |
≥ 0.95 |
0.590 |
Marginal |
|
RMSEA |
≤ 0.08 |
0.200 |
Marginal |
|
CMIN/DF |
≤ 2.00 |
9.083 |
Marginal |
Neither supplier nor retailer relationship marketing estimation models show eligible goodness of fit. However, the Chi Square value of the model from the retailer side is lower than that of the supplier, implicitly indicating it has a slightly better model than the supplier model. The relationship marketing estimation model with the dyadic approach was subsequently examined. Figure 4 shows the results of assessment with the dyadic approach.
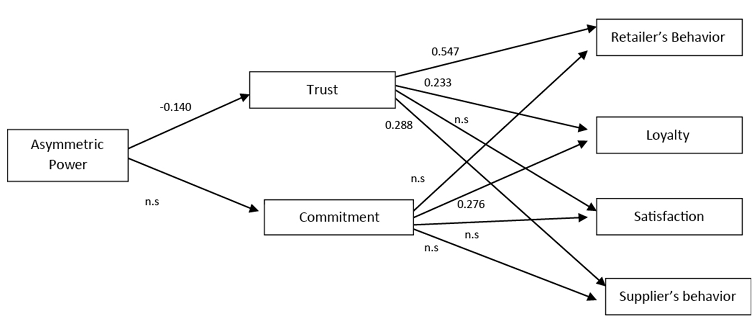
Figure 4. Estimation Model of Relationship Marketing with the Dyadic Approach
Table 11. Criteria of Empirical Goodness of Fit Model with Composite Data from the Retailer Side
|
Goodness Of Fit |
Cut Off Value |
Estimation Result |
Description |
|
Chi Square |
Expectedly low |
63.583 |
Good |
|
Probability |
≥ 0.05 |
0.000 |
Good |
|
GFI |
≥ 0.90 |
0.899 |
Moderate |
|
AGFI |
≥ 0.90 |
0.696 |
Moderate |
|
CFI |
≥ 0.95 |
0.590 |
Marginal |
|
RMSEA |
≤ 0.08 |
0.200 |
Marginal |
|
CMIN/DF |
≤ 2.00 |
9.083 |
Marginal |
The results of analysis using the dyadic approach indicate better goodness of fit than those of the non-dyadic approach as shown by lower chi square value and eligible GFI value.
In general, the comparison of the three models of the non-dyadic approach from the supplier and the retailer side, and the dyadic approach indicates these models have moderate goodness of fit. Nevertheless, the model with the dyadic approach has a lower chi square value and better GFI than the non-dyadic models.
The model is a result of a certain measurement method. We combined three different measurements of the dyad in each constructs in the model, namely: value difference, average value of perception and different side perception. It is noteworthy that we did not assess the dyadic model with a single measurement, for example by using average value of perception of all the constructs in the model.
Our constructs have various factor loading score. Several constructs have moderate factor loading, e.g., trust with factor loading 0.4. It is possible to strengthen the validity measurement by criterion-related assessment. Nevertheless, we did not complete the procedure because the construct validity was eligible to provide the information about the quality of measurement.
The findings of this study confirmed the trust and commitment theory proposed by Morgan and Hunt (1994), in which the construct of commitment is a mediating variable in the relationship of power asymmetry and strategic performance. In addition, power asymmetry has adverse impact on the construct of trust, which reaffirms Morgan and Hunt (1994).
4. Conclusions and Implications
We have investigated two estimation models in relationship marketing based on the dyadic and non-dyadic approach. The results indicate that the estimation model with the dyadic approach fits the nature of the relational constructs of commitment and trust that require analysis from the two sides of the involved parties in a relationship. This finding supported Rocco and Bush (2016) on the buyer-seller dyadic perceptions that suggest the capacity of dyadic measurement in relationship marketing research in capturing the conditions of parties in a business relationship.
The results of this study are also consistent with the assumptions proposed by the IMP Group on the dyadic nature of constructs or variables in relationship marketing. It also supports Eiriz and Wilson (2006) on the strong dominance of business-to-business in relationship marketing research. We recommend scholars who are interested in business-to-business relationship marketing research to develop a dyadic approach in their estimation model. Furthermore, it is suggested to employ multiplication of perceptions of each party in measuring the dyad perception as promulgated by Plewa and Quester (2008).
In the context of emerging economies, this study finds that power asymmetry has negative effect on the company trust to their partners. There is negative regression coefficient in the relationship between power asymmetry and trust. It indicates the exploitation in a business relationship between supplier and retailer in Indonesia. Companies with dominant power tend to exploit their partners to comply with their interests in a business relationship. However, this study could not identify which part - the supplier or the retailer - of the business relationship has a dominant power.
There are limitations of this study: first, this study fails to explain in more detail the power of asymmetry. In the construct validity, the power asymmetry is divided into two constructs. We classify this power asymmetry into coercive and non-coercive power. Second, this study could not explain the cause of power asymmetry in the business relationship between the supplier and the retailer. Therefore, we suggest the future study on relationship marketing in business to business to reveal the type of power, either coercive or non-coercive, and the source of a company’s power to influence their partners.
In addition, research in relationship marketing with the dyadic approach using case study and similar qualitative approaches as suggested by Lindgreen (2001) is a challenge for research in the area. Research on relationship marketing can also use qualitative methods with a dyadic approach. Lindgreen (2001) suggests the technique of in-depth interview with companies in a business relationship to obtain more detailed information on how they develop interaction with their partners.
References
Affran, S., Mawuko, D. & Oduro, R. (2019). Relationship Marketing: A Strategic Tool For Sustainable Competitive Advantage. GIS Business, 14 (3), May, 54–65.
Bandara, S., Leckie, C., Lobo, A. & Hewege, C. (2017). Power And Relationship Quality In Supply Chains: The Case Of The Australian Organic Fruit And Vegetable Industry. Asia Pacific Journal of Marketing and Logistics, 29(3), 501–518. https://doi.org/10.1108/apjml-09-2016-0165
Berry, L. L. (1983). Relationship Marketing. In L. L. Berry, G. L. Shostack, & G.D. Upah (Eds.), Emerging Perspectives on Services Marketing ( pp. 25–28). Chicago: American Marketing Association. https://doi.org/10.1177/009207038501300332
Bigne, E. & Blesa, A. (2003). Market Orientation, Trust and Satisfaction In Dyadic Relationships: A Manufacturer-Retailer Analysis. International Journal Of Retail and Distribution Management, 31(11), 574–590. https://doi.org/10.1108/09590550310503302
Cooper, D. R., & Schindler, P. S. (2014). Business Research Methods (12th ed.). Boston: McGraw Hill.
Corsten, D., & Kumar, N. (2005). Do Suppliers Benefit from Collaborative Relationships with Large Retailers? An Empirical Investigation of Efficient Consumer Response Adoption. Journal of Marketing, 69(3), 80–94. https://doi.org/10.1509/jmkg.69.3.80.66360
DeVellis, R. F. (1991). Scale Development, Theory and Applications. London: Sage Publications.
Eiriz, V. & Wilson, D. (2006). Research in Relationship Marketing: Antecedents, Traditions and Integration. European Journal of Marketing, 40(3) 275–291. https://doi.org/10.1108/03090560610648057
El Ansary, A. & Stern, L. W. (1972). Power Measurement in the Distribution Channel. Journal of Marketing Research , 9(1), 47–52.
Fulerton, G. (2005). The Impact of Brand Commitment on Loyalty to Retail Service Brands. Canadian Journal of Administrative Science, 22(2), 97–110.
Gaski, J. F., & Nevin, J. R. (1985).The Differential Effects of Exercised and Unexercised Power Sources in a Marketing Channels Journal of Marketing Research, 22 (May), 130–142. https://doi.org/10.1177/002224378502200203
Grewal, R., Lilien, G. L., Bharadwaj, S., Jindal, P., Kayande, U., Lusch R. F. et al. (2019). Business-to-Business Buying: Challenges and Opportunities. Customer Needs and Solutions, 2(3), 193–208. https://doi.org/10.1007/s40547-015-0040-5
Gronroos, C. (1994). From Marketing Mix To Relationship Marketing: Towards a Paradigm Shift in Marketing. Management Decision, 32(2), 4–20. https://doi.org/10.1108/00251749410054774
Grönroos, C. (2017). Relationship marketing readiness: theoretical background and measurement directions. Journal of Services Marketing, 31(3), 218–225. https://doi.org/10.1108/jsm-02-2017-0056
Gummesson, E. (1991). Marketing Orientation Revisited: The Crucial Role of the Part-Time Marketer. European Journal of Marketing, 25(2), 60–75. https://doi.org/10.1108/03090569110139166
Heide, J. B., & John, G. (1988). The Role Of Dependence Balancing In Safeguarding Transaction-Specific Assets In Conventional Channels, Journal of Marketing, 52 (January), 20–35. https://doi.org/10.1177/002224298805200103
Hoque, I., & Rana, M. B. (2019). Buyer–Supplier Relationships From The Perspective Of Working Environment And Organisational Performance: Review and Research Agenda. Management Review Quarterly. https://doi.org/10.1007/s11301-019-00159-4
Kim, K. (2000). On Interfirm Power, Channel Climate and Solidarity in Industrial Distributor-Supplier Dyads. Journal of The Academy of Marketing Science, 28(3), 388–405. https://doi.org/10.1177/0092070300283007
Kumar, R., Singh, R. K., & Shankar, R. (2015). Critical Success Factors For Implementation Of Supply Chain Management In Indian Small And Medium Enterprises And Their Impact On Performance. IIMB Management Review, 1–13. https://doi.org/10.1016/j.iimb.2015.04.005
Leverin, A., & Liljander, V. (2006). Does relationship marketing improve customer relationship satisfaction and loyalty? International Journal of Bank Marketing, 24(4), 232–251. https://doi.org/10.1108/02652320610671333
Li, B., Zhu, Y., & Wang, X. (2013). Equilibrium Analysis Of Distribution Channel Structures Under Power Imbalance And Asymmetric Information. International Journal of Production Research, 51(9), 2698–2714. https://doi.org/10.1080/00207543.2012.737954
Lindgreen, A. (2001). A Framework of Studying Relationship Marketing Dyads. Qualitative Market Research: An International Journal, 4(2), 75–87.
Maloni, M., & Benton, W. C. (2000). Power Influences In The Supply Chain. Journal of Business Logistics, 21(1), 49–73.
Mas-Ruiz, F. J. (2000). The Supplier-Retailer Relationship in The Context of Strategic Groups. International Journal of Retail and Distribution Management, 28(2), 93–106. https://doi.org/10.1108/09590550010315278
McKay, A., & Miller, N. H. (2019). Estimating Models of Supply and Demand: Instruments and Covariance Restrictions. Harvard Business School, Working Paper 19–051.
Morgan, R. M., & Hunt, S. D. (1994). The commitment-trust theory of relationship marketing. Journal of Marketing, 58(3), 20–38. https://doi.org/10.2307/1252308
Ndubisi, N. O. (2007). Relationship marketing and customer loyalty. Marketing Intelligence & Planning, 25(1), 98–106. https://doi.org/10.1108/02634500710722425
Neill, S., & Rose, G. M. (2006). The Effect of Strategic Complexity on Marketing Strategy and Organizational Performance. Journal of Business Research, 59(1), 1–10. https://doi.org/10.1016/j.jbusres.2004.12.001
Neuman, W. L. (2000). Social Research Methods: Qualitative and Quantitative Methods (4th ed.). Boston: Allyn & Bacon.
Palmer, R., Lindgreen, A., & Vanhamme, J. (2005). Relationship Marketing: Schools of Thought and Future Research Directions. Marketing Intelligence and Planning, 23(3), 313–330. https://doi.org/10.1108/02634500510597337
Plewa, C., & Quester, P. (2008). A Dyadic Study Of “Champions’’ In University-Industry Relationships. Asia Pacific Journal Of Marketing And Logistics, 20(2), 211–226. https://doi.org/10.1108/13555850810864560
Ramaseshan, B., Yip, L. C., & Pae, J. H. (2006). Power, Satisfaction and Relationship Commitment in Chinese Store-Tenant Relationship and Their Impact on Performance. Journal of Retailing, 82(1), 63–70. https://doi.org/10.1016/j.jretai.2005.11.004
Rauyruen, P., & Miller, K. E. (2007). Relationship quality as a predictor of B2B customer loyalty. Journal of Business Research, 60(1), 21–31. https://doi.org/10.1016/j.jbusres.2005.11.006
Rocco, R. A., & Bush, A. J. (2016). Exploring buyer-seller dyadic perceptions of technology and relationships: Implications for Sales 2.0. Journal of Research in Interactive Marketing, 10(1), 17–32. https://doi.org/10.1108/jrim-04-2015-0027
Ryu, S., Min, S., & Zushi, N. (2008). The moderating role of trust in manufacturer-supplier relationships. Journal of Business & Industrial Marketing, 23(1), 48–58. https://doi.org/10.1108/08858620810841489
Setyawan, A., Purwanto, B. M., Dharmmesta, B.S., Nugroho, S.S. (2016). Business Relationship Framework In Indonesia: Relationship Marketing Vs Transaction Cost. Journal of Asia Business Studies, 10(1), 61–77. https://doi.org/10.1108/jabs-06-2014-0043
Srinivasan, R., & Moorman, C. (2005). Strategic Firm Commitments and Rewards for Customer Relationship Management in Online Retailing. Journal of Marketing, 69, 193–200. https://doi.org/10.1509/jmkg.2005.69.4.193
Terawatanavong, C., Whitwell, G. J., & Widing, R. E. (2007). Buyer satisfaction with relational exchange across the relationship lifecycle. European Journal of Marketing 41(7/8), 915–938. https://doi.org/10.1108/03090560710752456
Woody, E., & Sadler, P. (2005). Structural Equation Models for Interchangeable Dyads: Being the Same Makes a Difference. Psychological Methods, 10(2), 139–158. https://doi.org/10.1037/1082-989x.10.2.139
Wu, Wann-Yih, Chiag, Chwan-Yi, Wu, Ya-Jung, & Tu, Hui-Ju (2004). The Influencing Factors Of Commitment And Business Integration On Supply Chain Management. Industrial Management & Data Systems, 104(4), 322–333. https://doi.org/10.1108/02635570410530739
APPENDIX. Indicators of constructs
Satisfaction
|
No |
Indicators |
|
1 |
Our company is satisfied with our business partner’s services. |
|
2 |
Our business partners always help our company in a satisfying way. |
|
3. |
Our company is satisfied with business interaction with our business partners. |
|
4. |
Our business partners understand our company’s needs. |
|
5. |
In general, our company is satisfied with our relationship with our business partners. |
Loyalty
|
No |
Indicators |
|
1 |
Our company never seriously thinks about changing our business partners. |
|
2 |
Our company is a loyal business partner in a business relationship. |
|
3. |
Our company entrusts all business affairs to our business partner based on agreement. |
|
4. |
Our company is willing to provide recommendations to other companies to make our business partner their partners as well. |
Commitment
|
No |
Indicators |
|
1 |
Our company maintains profitable business relationships with our main business partners. |
|
2 |
It is very difficult for our company to switch business partners. |
|
3. |
Our company maintains business relationships with business partners whose operational costs are affordable for us. |
|
4. |
There are only few choices for us to establish profitable business partnerships except with our main business partner. |
Trust
|
No |
Indicators |
|
1 |
Our main business partner is an honest company. |
|
2 |
Our main business partner always provides support to our company. |
|
3. |
Our company trusts our business partners. |
|
4 |
The business decisions of our partner companies always give us benefit. |
Power Asymmetry
|
No |
Indicators |
|
1 |
Our company has a strong influence to determine the price of our business partners’ products. |
|
2 |
Our company can provide advice to business partners to improve the quality of their products. |
|
3. |
If our company does not meet the required standard of our main business partners, we will get poor service. |
|
4. |
If our company rejects the advice of our main business partner company, we will get a strong warning from them. |
|
5. |
If we do not follow our business partner’s instructions, we will get payment delay from them. |
|
6. |
If our company follows the advice and recommendations from our main business partners, we will get better service from them. |
|
7. |
Our company will gain more benefit if we follow the recommendations or desires of our main business partner. |
Performance
|
No |
Indicators |
|
1 |
Our sale has increased since we established a business relationship with our partner. |
|
2 |
Our business growth has increased since we established a business relationship with our partner. |
|
3. |
Our business profit has increased since we established a business relationship with our partner. |
|
4. |
Our annual business revenue has increased since we established a business relationship with our partner. |