Organizations and Markets in Emerging Economies ISSN 2029-4581 eISSN 2345-0037
2020, vol. 11, no. 2(22), pp. 482–503 DOI: https://doi.org/10.15388/omee.2020.11.44
Contribution of Manufacturing Strategy to Competitive Performance of Manufacturing Companies: Empirical Evidence from Vietnam
Hoang Trong Hoa
Vietnam National University / University of Economics and Business, Vietnam
hoangtronghoa1988@gmail.com
http://orcid.org/0000-0001-6115-8686
Phan Chi Anh (corresponding author)
Vietnam National University / University of Economics and Business, Vietnam
anhpc@vnu.edu.vn
https://orcid.org/0000-0002-0153-1845
Le Thai Phong
University of Foreign Trade, Vietnam
lethaiphong@ftu.edu.vn
https://orcid.org/0000-0003-2821-6033
Abstract. This paper presents the results of an empirical study examining the relationship between manufacturing strategy and competitive performance of Vietnamese manufacturers, with focus on the technology factor of manufacturing strategy. Statistical techniques were used to analyze the data collected from 25 manufacturing enterprises, and the qualitative research method was employed to enrich the captured results. Findings indicate the positive impact that manufacturing strategy (together with its components namely competitive priorities and technology choices) has on firm’s competitive performance. Two case studies also provided more in-depth knowledge of the development and implementation of manufacturing strategy at Vietnamese manufacturers. From there, recommendations are proposed for management to better implement manufacturing strategy and utilize technology in order to improve competitive performance.
Keywords: manufacturing strategy, competitive priorities, strategic choices, technology choices, Vietnam manufacturers, Industry 4.0, emerging economy.
Received: 26/6/2020. Accepted: 11/11/2020
Copyright © 2020 Hoang Trong Hoa, Phan Chi Anh, Le Thai Phong. Published by Vilnius University Press. This is an Open Access article distributed under the terms of the Creative Commons Attribution Licence, which permits unrestricted use, distribution, and reproduction in any medium, provided the original author and source are credited.
1. Introduction
On Vietnam’s industrialization path, manufacturing is among the crucial factors assisting the country’s economic restructuring process to maintain high growth. According to the General Statistics Office of Vietnam, by the end of 2019, the manufacturing sector continued to play the leading role within Vietnamese economy, with 11.29% growth rate, contributing 2.33 percentage points to that of Vietnam’s GDP (General Statistics Office of Vietnam, 2020). The sector is expected to sustain its strong upward momentum mainly thanks to the sturdy source of FDI, which keeps flushing the economy – registered at more than 38 billion dollars in 2019, the highest in 10 years (Ministry of Planning and Investment of Vietnam, 2020). In addition, free trade agreements that the country has been able to obtain are also important enablers for export activities and manufacturing sector to flourish. On the other hand, as many experts claimed that the latest technologies of Industry 4.0 will create unprecedented benefits for manufacturing companies globally (Baur & Wee, 2015), Vietnamese government’s macro-economic policies seem to unanimously point to smart manufacturing as an inevitable direction. It could be said that the Vietnamese manufacturing sector is taking an increasingly important role within the economy as well as facing tremendously favorable opportunities. However, one needs to admit that the sector’s disadvantages are also not insignificant. The current FDI-dependent landscape for manufacturing sector is risky; the effect of rising labor cost will not allow the country to depend solely on low-cost production model for much longer. Besides, each individual Vietnamese manufacturer still has a lot of room for improvement on many aspects ranging from strategy, technology, operation to performance, etc. Many Vietnamese manufacturers would like to embrace Industry 4.0, yet are limited by their shortage of technical foundations, financial and human resources, management skills, insights on technological trends and other legislative obstacles.
The question for Vietnamese manufacturers today is how to develop their own competitive edge while taking advantage of Industry 4.0 to strengthen their performance, in order to stay competitive in the long term. When external factors seem favorable, it is important for firms to look inward to find out which factors could help improve their competitive performance, and manufacturing strategy is said to be among the most vital factors impacting manufacturer’s performance (Flynn et al., 1997). Many authors have concluded that manufacturing strategy affects firms’ competitive performance strongly and positively (Amoako-Gyampah & Acquaah, 2007; Ang et al., 2015; Singh & Mahmood, 2013; Schroeder et al., 2002). Indeed, manufacturing strategy was found to play an important role helping manufacturers from India – also an emerging market yet, well larger in size compared to Vietnam – to overcome the intensifying global competition, where customers often demand for lower cost and better quality (Dangayach & Deshmukh, 2001b). Although Vietnam’s emerging economy is solidly fueled by its manufacturing sector, the concept of manufacturing strategy itself is still mostly absent in domestic research and among Vietnamese manufacturers. As a result, the paper aims to examine the relationship between manufacturing strategy and competitive performance of Vietnamese manufacturers to initiate one of the first foundations for this term. Additionally, in order to emphasize the role of Industry 4.0 in today’s manufacturing world, the paper will also scope the focus of this research on technology factor when studying manufacturing strategy. Hence, this study attempts to give answers to the following research questions: (1) What are the current practices of manufacturing strategy with focus on technology at Vietnamese manufacturers? (2) Is there a considerable linkage between manufacturing strategy and competitive performance of Vietnamese manufacturers?
Even though the global research on manufacturing strategy has been well expanded, there are three gaps that this paper wishes to fulfill. First, there is a slight shortage of manufacturing strategy studies in developing countries such as Vietnam, while emerging economies are taking an increasingly significant role within the global trade and manufacturing. Second, a large number of previous studies constructed the concept of manufacturing strategy based solely on either of its two main components: (1) the four competitive priorities (Swamidass & Newell, 1987; Amoako-Gyampah & Acquaah, 2007; Lin et al., 2012) or (2) strategic choices (Ang et al., 2015; Singh & Mahmood, 2013). There is a dearth of research constructing manufacturing strategy based on both competitive priorities and strategic choices. Besides, the use of technology choices as an important part of strategic choices was also absent in previous studies despite the fact that technology is crucial to manufacturing, and Industry 4.0 is promised to bring disruptive changes to global manufacturers. Third, numerous previous studies employed either the quantitative or qualitative method to examine the relationship between manufacturing strategy and competitive performance. There have not been many studies employing both methods to implement the investigation more thoroughly. As a result, this research aims to exploit these gaps, inspecting the relationship between manufacturing strategy and competitive performance of Vietnamese manufacturers using an extensive theoretical construct of manufacturing strategy while employing both quantitative and qualitative research methods.
2. Literature Review
Since the country’s Reform from mid-1980s, Vietnam has witnessed robust economic transition and impressive export performance (Athukorala, 2009), making it one of the highly promising emerging economies, playing an ever-more-important role in the global economy. In recent years, the country has been faced with difficulties ranging from external issues such as economic slowdown, credit booming, international protectionism (Nguyen et al., 2018) to internal problems namely outdated growth models, limited productivity, bureaucracy, etc. (Nguyen et al., 2019). Nonetheless, Kikuchi et al. (2018) stand strongly on the position that Vietnam will continue its economic flourishing thanks to the many FTA and economic agreements that the country is a part of. Manufacturing sector is going to be among those benefiting the most from this trend, especially when it is the highest invested-in sector of FDI inflows to Vietnam (Quoc & Thi, 2018). The Vietnam General Statistics Office (2020) deems the country’s manufacturing sector as one of the most important constituents of Vietnamese economy. There are a number of sub-sectors with outstanding growth rates, including medicine and pharmacy (up 20%), motor vehicles (up 16%), paper and paper products (up 14%). According to the Ministry of Planning and Investment of Vietnam (2019), in the White Book on Vietnamese Enterprises, by the end of 2018, the whole country had a total of 108,587 enterprises operating in the field of processing and manufacturing, which employ slightly less than 8 million employees. A report by the Vietnam Academy of Social Sciences (2019) claims that although the contribution of manufacturing sector to Vietnam’s GDP has increased steadily over the last decade, it is still very limited compared to that of many other countries such as China, Thailand, South Korea, Malaysia, Indonesia, Japan, India, Cambodia, and so on. Furthermore, labor productivity of Vietnamese manufacturing sector is still at relatively low level, only accounting for 64% that of India and 36% that of the Philippines. However, among the manufacturing sub-sectors, some industries such as electronics, motor vehicles, electrical equipment, etc. have increased labor productivity, along with revenue, total value added and export turnover.
Since Skinner (1969) coined the concept of manufacturing strategy, international research on this subject has grown enormously. Early studies already tried to find out manufacturing strategy’s impact on firm’s competitive performance besides clarifying its concepts and definitions. Along with Skinner (1969), a number of other researchers soon joined the field to define manufacturing strategy such as Hayes and Wheelwright (1984), Hill (1993), Swamidass and Newell (1987), McGrath and Bequillard (1989), Hayes and Pisano (1994), Swink and Way (1995), Keong and Ward (1995), Berry et al. (1999), or Brown (1998). Based on the studies of these authors, manufacturing strategy can be described with three crucial traits, which are: (1) Manufacturing strategy is an important part of a firm’s overarching corporate strategy; (2) Manufacturing strategy impacts greatly a firm’s competitive performance; (3) Manufacturing strategy consists of decisions on detailed strategic choices regarding manufacturing activities, constructed based on the four foundational competitive priorities including cost, quality, delivery and flexibility.
In this study, manufacturing strategy is defined as a system of competitive priorities accompanied and realized by strategic choices regarding design, organization, staff, processes, management, tools, techniques, technology, etc. in order for manufacturers to achieve strategic objectives and improve competitive performance.
The importance of manufacturing strategy has been widely confirmed since the concept’s birth. However, initial studies regarding manufacturing strategy usually kept their scope around manufacturing strategy’s definitions and its descriptive analysis. It was not until 1990s, when globalization with expanding foreign trade and international production became a trend, that the academic system on the topic of manufacturing strategy started to surge. Figure 1 illustrates this academic expansion in more detail.
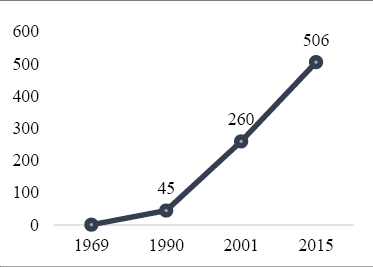
FIGURE 1. Global research on manufacturing strategy until year 2015
Source: Dangayach & Deshmukh (2001), Chatha & Butt (2015)
In 2001, Dangayach and Deshmukh reviewed more than 260 studies on manufacturing strategy from more than 30 credible international academic journals and scientific conferences and found that only a fraction of this sum (45 studies) was conducted during the 21-year period from 1969 (when Skinner established the term) to 1990 (when globalization started becoming more present); the rest (215 studies) were all published within 10 years from 1991 to 2001. As can be seen, new studies on manufacturing strategy were conducted at considerably higher speed when there was a clear need from global manufacturers to systematically understand manufacturing strategy in order to gain better competitive edge, as global competition is getting tougher along with globalization. In later years, when Chatha and Butt (2015) conducted a similar study aimed at reviewing the academic system of manufacturing strategy, the number of studies had accumulated to 506. From the reviewed academic works, one of the strongest messages delivered was the robust and positive impact that manufacturing strategy has on companies’ competitive performance (Amoako-Gyampah & Acquaah, 2007; Ang et al., 2015; Singh & Mahmood, 2013; Schroeder et al., 2002; Youndt et al., 1996; Lin et al., 2012; Paiva et al., 2012; Swamidass & Newell, 1987; Ward & Duray, 1999).
3. Analytical framework and hypotheses establishment
Based on the reviewed theories and results from other studies by Ward et al. (1998), Chatha and Butt (2015) regarding competitive priorities, as well as studies by Sonntag (2003), Tuominen et al. (2004), Tracey et al. (1999), Kotha and Swamidass (1999) regarding technology choices, this paper proposes an analytical framework to study manufacturing strategy of Vietnam manufacturers, which is presented in Figure 2. The arrows in this figure present the foundational relationships to be further investigated in this study, helping to later build the research hypotheses.
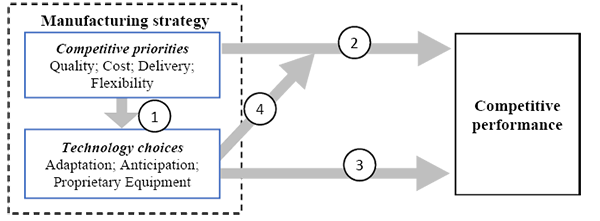
FIGURE 2. Analytical framework
First, while a good number of previous studies have shown that manufacturing strategy has a positive causal relationship with a firm’s competitive performance (Amoako-Gyampah & Acquaah, 2007; Ang et al., 2015; Singh & Mahmood, 2013; Schroeder et al., 2002), this relationship has been under-investigated in emerging economies overall and in Vietnam in particular. Tallaki and Bracci (2017) claimed that manufacturing practices in reality may differ greatly across national settings due to the changes of influencing contextual factors such as culture, organization, environment, etc. As a consequence, exploring any causal relationship between manufacturing strategy and competitive performance is not this paper’s immediate intention. Instead, at this early stage of the manufacturing strategy concept in Vietnam, it is more critical to first examine the simple correlation between the two elements before more in-depth explorations. For that, the first hypothesis was constructed as follows:
H1. There is a significant statistical linkage between manufacturing strategy and competitive performance.
Second, previous empirical studies on manufacturing strategy have confirmed a causal relationship between the two main components of the concept, namely competitive priority and strategic choices (Skinner, 1969; Hayes & Wheelwright, 1985; Yen & Sheu, 2003; Sarmiento et al., 2006; etc.). However, strategic choices cover a wide variety of manufacturing aspects ranging from production capability, processes, degree of centralization to planning, supervision, organization, human resources, and so on (Hill, 1993). Technology choices is one of the many “subsystems” of strategic choices, and this research scopes technology choices as the representative of strategic choices to construct the concept of manufacturing strategy – as seen in Figure 2. Therefore, it is important to investigate whether or not technology choices are also guided by competitive priorities, similar to how strategic choices in general are orientated by competitive priorities. Subsequently, the second hypothesis was formulated as follows:
H2. Competitive priorities impact decisions on technology choices.
Third, competitive priorities – the first component of manufacturing strategy – has been concluded in many studies to have significant impact on competitive performance of manufacturers (Christiansen et al., 2003; Kroes & Ghosh, 2009; Lagace & Bourgault, 2002). It means that the mere orientation of manufacturing strategy focusing on high quality, low cost, fast delivery or flexibility with customer needs can already help businesses achieve better results. In fact, various authors such as Youndt et al. (1996), Amoako-Gyampah and Acquaah (2007), Lin et al. (2012) tended to employ only the 4 competitive priorities when building measurements for manufacturing strategy, and they also found the positive impact that manufacturing strategy (composed of competitive priorities) has on a firm’s performance. Accordingly, it is necessary to continue verifying the role of competitive priorities in defining firms’ competitive performance in the Vietnamese context to see if this relationship still holds true. This leads to the formation of the third hypothesis as follows:
H3. Competitive priorities impact firms’ competitive performance.
Forth, technology choices, placed in the lens of this study as the representative subsystem of strategic choices, was newly built based on previous theories of Sonntag (2003), Tuominen et al. (2004), Tracey et al. (1999), and Kotha and Swamidass (1999). However, technology choices itself as a concept has not been widely used in other scientific studies on manufacturing strategy or on the relationship between manufacturing strategy and firm performance. Furthermore, according to Chatha and Butt (2015), technology choices is among the least researched subsystems of strategic choices in the geographical areas outside Europe and North America. Consequently, understanding the impact of technology choices on Vietnamese manufacturers’ competitive performance is necessary to demonstrate the actual role of this element. This is also particularly important for the situation of Vietnamese manufacturing enterprises that are perceived to be on the sideline of Industry 4.0. Thus, the forth hypothesis was established as follows:
H4. Technology choices impact a firm’s competitive performance.
Last but not least, technology choices – being one subsystems of strategic choices (Chatha & Butt, 2015) – also play the mediating role within the relationship between competitive priorities and firm’s performance (Hayes & Wheelwright, 1985; Hill, 1993). In other words, competitive priorities impact strategic choices – including technology choices – which in turn, impact a firm’s performance. Yet, in the current context of technology advancement, technology choices is expected to play not only the mediating role but also the moderating role in realizing the impact that competitive priorities have on business performance. More specifically, focusing on certain competitive priority could be more effective in impacting performance if the companies implement also the ever-more-important catalytic technological applications. Hence, this unique role of technology choices is to be tested with the last hypothesis articulated as follows:
H5. Technology choices impacts the relationship between competitive priorities and competitive performance.
4. Data collection and measurement test
4.1. Data collection
This study employs both qualitative and quantitative methods, surveying 25 Vietnamese manufacturers to collect numerical data while conducting case studies at two Case companies to enrich statistical findings. In terms of quantitative research, in order to test the five hypotheses, the authors intended to collect an exploitable set of data which is not only close to international standards but also suitable to local practices, i.e., easy for local manufacturers to comprehend, because the concept of manufacturing strategy is still new in Vietnam. As a result, the authors based the questionnaire of this study on an international academic project - the High Performance Manufacturing (HPM)- which is similar to the method employed by Ang et al. (2015). The authors selected 40 Vietnamese manufacturers certified both ISO 9000 and ISO 14000 during the 2010-2015 period, then sent letters of invitation to their management. The authors also obtained contacts to call and set up direct meetings with top managers of the firms to explain further about the project, asking for their dedicated participation. One plant from each company was proposed to take part in the survey; questionnaires were then sent to suitable staff to give answers. Responding staff members range from management to process and manufacturing positions as described in Table 1. For the questions related to several staff roles (such as competitive priorities, competitive performance, etc.), more than one respondents could be asked to discuss together to agree on the final answers. The given questionnaires were completed by 25 out of the 40 surveyed companies. Those 25 companies belong to 3 industries: electronics and electricity (10), transportation (8) and machinery (7). Companies’ sizes are on average 1,266 in terms of employees and $16 million in terms of revenue. The operational experience is 12.3 years on average.
TABLE 1. Survey instruments
|
Domains |
Measurement scales |
No. of questions |
Survey Respondents |
|
Competitive |
Quality |
1 |
Plant manager |
|
Cost |
1 |
Plant manager |
|
|
Delivery |
3 |
Plant manager |
|
|
Flexibility |
4 |
Plant manager |
|
|
Technology choices |
Technology adaptation |
4 |
Process engineer |
|
Technology anticipation |
5 |
Process engineer |
|
|
Proprietary equipment |
8 |
Process engineer |
|
|
Performance |
Competitive performance |
27 |
Plant manager |
When it comes to qualitative research, case studies have been found to be a good complementary method to statistical analysis, adding valuable exploratory insights to quantitative findings (Dangayach & Deshmukh, 2006). The authors wanted to learn further about manufacturing strategy, technology choices and competitive performance to gain more in-depth insights, formulating more valuable recommendations for both academic researchers and companies’ management. The case studies strive to find out practices on different aspects of manufacturers related to manufacturing strategy, for example, what companies carry out in order to realize their chosen competitive priorities; what is the specific role of manufacturing strategy, competitive priorities and technology choices within firms; how technology has benefited the companies; etc. Results of these examinations will help make more thorough understanding of manufacturing strategy and its relationship to firms’ competitive performance. Two case companies were selected so that they are well differentiated on various aspects such as type, operational practices, market, industry, product, life cycle, development phase, and so on, in order to keep up the objectivity of this research by studying manufacturing strategy from different perspectives. The authors reached the management of the two case companies directly to propose research collaboration. The initial discussions were followed by interviews with top management and staff at manufacturing functions to review the whole process of manufacturing strategy activities from formulation to execution.
4.2. Statistical analysis
Before hypotheses testing, the collected data was checked, refined and mildly processed to ensure its quality, validity and usability. The first analytical step is to test the validity of the collected data and give a brief description of the variables, which are synthesized in Table 2. Overall, all of the scales reached high validity levels (Cronbach’s alpha values > 0.65) and as a result could be used as variables to test the research hypotheses. Especially, technology choices, the new variable computed by averaging the three initial technology scales, has Cronbach’s alpha value of 0.85, fulfilling the validity and usability requirement. Beside calculating Cronbach’s apha value, in order to ensure that the three technology scales all contribute to the measurement of the new scale, Exploratory Factor Analysis was also conducted. Result from the Varimax rotation computation strongly showed that the three constituent variables all belong to the same factor set, measuring technology choices consistently.
When it comes to descriptive analysis, all the variables have rather high maximum values being close to 5.0; the minimum values of technology variables seem to be higher than those of the competitive priorities. Mean value of proprietary equipment is the lowest among the technology variables, which indicates that the surveyed manufacturers might be overlooking the need for developing their own machinery and equipment for manufacturing, while they seem to pursue latest technology and adapt well to new technology (mean value > 4.0). Quality has the lowest mean value (3.77) as well as highest standard deviation (1.07) among the competitive priorities. This suggests that even though many companies are less concerned regarding manufacturing quality, still their priorities for Quality differ greatly.
TABLE 2. Descriptive analysis results
|
Scales |
Cronbach’s |
Min |
Max |
Mean |
Standard |
|
Quality |
|
1.00 |
5.00 |
3.77 |
1.07 |
|
Cost |
|
2.00 |
5.00 |
4.21 |
0.83 |
|
Delivery |
0.79 |
2.01 |
5.00 |
4.32 |
0.81 |
|
Flexibility |
0.85 |
1.72 |
5.00 |
4.39 |
0.87 |
|
Competitive performance |
0.97 |
2.61 |
5.00 |
4.11 |
0.77 |
|
Technology adaptation |
0.77 |
2.02 |
5.00 |
4.02 |
0.78 |
|
Technology anticipation |
0.66 |
3.00 |
5.00 |
4.08 |
0.63 |
|
Proprietary equipment |
0.74 |
2.43 |
4.88 |
3.55 |
0.70 |
|
Technology choices |
0.85 |
2.49 |
4.92 |
3.93 |
0.62 |
Following descriptive analysis, the research continues with Compare Means analysis of the four competitive priorities variables. First, means are compared to value 3, the neutral-value answer about the priorities in the questionnaire (5- Very important, 4- Important, 3- Normal, 2- Not too important, 1- Not important at all). Results shown in Table 3 indicate that all competitive priorities are positioned significantly higher than the neutral value 3, meaning that the surveyed companies seem to consider all the four priorities (quality, cost, delivery, flexibility) as important. This suggests that Vietnamese manufacturers might be pursuing multiple goals at the same time, which, according to Boyer and Lewis (2002), is ineffective because firms would then lose focus in terms of resources and lack differentiation in terms of competitive strategy.
TABLE 3. Compare Means of the Competitive Priorities
|
Competitive Priorities |
Compared to 3 |
Compared to 4 |
||
|
P value |
Std Dev. |
P value |
Std Dev. |
|
|
Quality |
0.00 |
0.84 |
0.46 |
-0.16 |
|
Cost |
0.00 |
1.24 |
0.16 |
0.24 |
|
Delivery |
0.00 |
1.29 |
0.08 |
0.29 |
|
Flexibility |
0.00 |
1.36 |
0.04 |
0.36 |
When compared to value 4, only flexibility was shown as significantly higher, meaning Vietnamese manufacturers generally put “important” or “very important” as the answers for flexibility and thus, they are prioritizing flexibility as the highest among the competitive priorities. This in an interesting finding as Chi et al. (2009) alleged that flexibility is a difficult priority that requires substantial trade-offs from other priorities; manufacturers tend to pursue flexibility only when the markets and competitions are too hostile.
In the next step, to analyze the relationships presented in Figure 2, correlation analysis was conducted first to explore their possible initial linkages; the correlation analysis also serves as an important foundation for regression analysis later. Results of correlation analysis between all variables are shown in Table 4.
ABLE 4. Pearson correlation analysis
|
|
Tech Adapt |
Tech Anticip |
Propr Equip |
Tech choices |
Quality |
Cost |
Deliv. |
Flex. |
Comp. Perf. |
|
|
Tech Adapt |
Pearson Correlation |
1 |
|
|
|
|
|
|
|
|
|
Sig. (2-tailed) |
|
|
|
|
|
|
|
|
|
|
|
Tech Anticip |
Pearson Correlation |
0.66** |
1 |
|
|
|
|
|
|
|
|
Sig. (2-tailed) |
0.00 |
|
|
|
|
|
|
|
|
|
|
Propr Equip |
Pearson Correlation |
0.64** |
0.68** |
1 |
|
|
|
|
|
|
|
Sig. (2-tailed) |
0.00 |
0.00 |
|
|
|
|
|
|
|
|
|
Tech choices |
Pearson Correlation |
0.89** |
0.87** |
0.88** |
1 |
|
|
|
|
|
|
Sig. (2-tailed) |
0.00 |
0.00 |
0.00 |
|
|
|
|
|
|
|
|
Quality |
Pearson Correlation |
0.22 |
0.27 |
0.42* |
0.34 |
1 |
|
|
|
|
|
Sig. (2-tailed) |
0.30 |
0.19 |
0.04 |
0.10 |
|
|
|
|
|
|
|
Cost |
Pearson Correlation |
0.32 |
0.36 |
0.34 |
0.38 |
0.47* |
1 |
|
|
|
|
Sig. (2-tailed) |
0.12 |
0.08 |
0.10 |
0.06 |
0.02 |
|
|
|
|
|
|
Delivery |
Pearson Correlation |
0.53** |
0.34 |
0.37 |
0.48* |
0.57** |
0.76** |
1 |
|
|
|
Sig. (2-tailed) |
0.01 |
0.10 |
0.07 |
0.02 |
0.00 |
0.00 |
|
|
|
|
|
Flexibility |
Pearson Correlation |
0.44* |
0.50* |
0.37 |
0.49* |
0.52** |
0.78** |
0.76** |
1 |
|
|
Sig. (2-tailed) |
0.03 |
0.01 |
0.07 |
0.01 |
0.01 |
0.00 |
0.00 |
|
|
|
|
Comp. Perf. |
Pearson Correlation |
0.58** |
0.55** |
0.44* |
0.60** |
0.48* |
0.60** |
0.79** |
0.80** |
1 |
|
Sig. (2-tailed) |
0.00 |
0.00 |
0.03 |
0.00 |
0.02 |
0.00 |
0.00 |
0.00 |
|
|
** Correlation significant at 0.01 (2-tailed).
* Correlation significant at 0.05 (2-tailed).
As can be seen from the above results, competitive performance has statistically significant (most of the statistical values are significant at level 0.01) and positive (Pearson Correlation coefficient is greater than zero) correlations with all variable components of manufacturing strategy. This means that there is a positive linkage between manufacturing strategy and a firm’s competitive performance. Although it is not possible at this point to conclude a causal relationship between these two factors, positive correlations between the variables show that the model is eligible to perform linear regression analysis, with independent variables being manufacturing strategy components and the dependent variable being competitive performance. As one can observe, the two competitive priorities, delivery and flexibility, are lightly correlated to the new variable – technology choices. Meanwhile, each competitive priority has certain statistical links with the components of technology choices such as: delivery and flexibility is correlated to technology adaptation; flexibility is correlated to technology anticipation; quality is correlated to proprietary equipment. However, competitive priority on cost does not show any statistical correlation with technology choices or its variables. The high correlations between the four competitive priorities once again suggest that the surveyed enterprises are pursuing multiple strategic targets, demonstrating the risks of strategic ineffectiveness and inconsistency due to the “trade-off” nature of competitive priorities. In contrast, the high correlations between the variables of technology choices display the uniformity of technological activities, meaning companies have strong awareness of technology’s importance in their business. In a nutshell, it could be initially said that the surveyed enterprises have shown systematic implementation regarding manufacturing strategy and technological activities.
Later, linear regression analysis was carried out to further examine the cause-effect relationships as shown in Figure 2. It should be noted that linear regression analysis is only conducted for relationships that have statistical correlations because in order to have a causal relationship, the two variables must first be statistically linked. In addition, due to the limited sample size (25 responses), which is difficult to serve this study’s complex analytical models, the authors found the need to perform individual analysis for each constituent to ensure the quality, validity and reliability of the result. Accordingly, the authors proceed to build sub-models for each relationship. The analysis results of the four relationships are presented more specifically in Table 5.
TABLE 5. Summary of linear regression analyses
|
Independent Variables |
Dependent Variables |
Beta |
Sig. |
VIF |
R2 |
ANOVA Sig. |
|
Relationship 1: Competitive priorities have an impact on technology choices |
||||||
|
Delivery |
Technology choices |
0.24 |
0.00 |
1.52 |
0.20 |
0.03 |
|
Flexibility |
0.31 |
0.00 |
1.98 |
|||
|
Delivery |
Technology adaptation |
0.18 |
0.03 |
1.52 |
0.27 |
0.02 |
|
Flexibility |
0.23 |
0.01 |
1.98 |
|||
|
Flexibility |
Technology anticipation |
0.50 |
0.00 |
|
0.21 |
0.00 |
|
Quality |
Proprietary equipment |
0.43 |
0.01 |
|
0.14 |
0.01 |
|
Relationship 2: Competitive priorities impact competitive performance |
||||||
|
No significant relationship found |
||||||
|
Relationship 3: Technology choices impact competitive performance |
||||||
|
Technology adaptation |
Competitive performance |
0.58 |
0.02 |
1.32 |
0.30 |
0.00 |
|
Technology anticipation |
0.65 |
0.00 |
1.22 |
|||
|
Proprietary equipment |
0.43 |
0.03 |
1.87 |
|||
|
Relationship 4: Technology choices have moderating impact on the relationship between competitive priorities and performance Analyzed using PROCESS – an SPSS tool for analysis of moderation effect – created by Hayes (2012) |
||||||
|
Technology choices |
Competitive performance |
0.67 |
0.00 |
|
0.57 |
0.00 |
|
Quality |
0.14 |
0.43 |
|
|||
|
Moderating intervention (Tech choices x Quality) |
0.49 |
0.03 |
|
|||
The results of linear regression analysis confirmed that the above causal relationships are statistically significant (p <0.05, with no multi-correlation effect – all VIF values smaller than 2), except for the relationship between competitive priorities and competitive performance. A summary of these causal relationships is shown in Figure 3.
In short, the relationships within this research analytical framework have been analyzed and proven from the statistical perspective, helping to test the five research hypotheses to clarify the relationship between manufacturing strategy and competitive performance at Vietnamese manufacturing enterprises. Based on the results presented, it could be concluded that all research hypotheses were accepted except for Hypothesis 3.
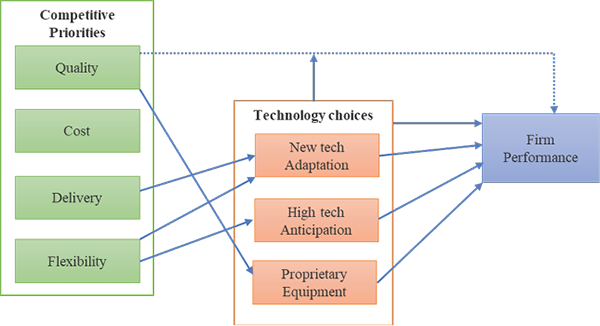
FIGURE 3. Regression analysis results indicating a number of significant cause-effect relationships
4.3. Case studies on manufacturing strategy implementation in Vietnamese manufacturing companies
The qualitative part of this research aims to gain more in-depth understanding of manufacturing strategy at Vietnamese manufacturing enterprises, also to help explain and clarify the preliminary results that quantitative research has obtained. Accordingly, the case studies will examine the relationship between manufacturing strategy and competitive performance, the process of developing, orienting competitive priorities and implementing manufacturing strategy, together with the role of technology factors in realizing competitive priorities and improving business performance. The authors conducted a case study at two case companies and summarized the findings in Table 6.
TABLE 6. Summary of findings from two case studies
|
Topics |
Case Company 1 |
Case Company 2 |
|
Founded |
1994 |
1968 |
|
Forerunner |
Electricity co-operative |
Mechanic plant in coal-mining industry |
|
Type |
Private firm |
Member of state-owned coal & mine corporation (named TKV) |
|
Plants |
3 plants |
1 large manufacturing site, 8 factories |
|
Products |
Light mechanics: Automobile wires, electric wires, low-voltage cables, welding cables, rubber cables |
Mechanical and industrial machines: Excavators, wagons, drills, mills, concrete pipes |
|
Customers |
A number of large strategic partners, stable demand |
Many customers who also are Group members of TKV; demands vary |
|
Competitive edges |
Strong experience; low cost; stable quality |
Abundant and available customers with strong demands; strong resources; state support |
|
Developing manufacturing strategy |
Not really called out the concept of manufacturing strategy but subtly integrated it into the overall strategy activities |
Not really called out the concept of manufacturing strategy but have very clear steps of formulating and implementing manufacturing strategy |
|
Competitive priorities |
Quality and Cost |
Quality, Cost and Flexibility |
|
Realizing the Competitive Priorities |
Optimizing processes, improving HR practices and applying management & monitoring tools to realize Quality and Cost. Case Company 2 organizes separate production workshops to realize Flexibility – which is hard and resource-consuming. |
|
|
Technological choices |
Not really interested in pursuing and adapting to new technology. However, there have been many developments regarding proprietary equipment to serve the enterprise‘s own manufacturing activities. |
|
|
Competitive performance |
Competitive performance is at good and stable level during a long period |
Competitive performance recovers only recently thanks to implementation of manufacturing strategy |
|
The relationship between manufacturing strategy and competitive performance |
Manufacturing strategy (though not yet named) has helped the two Case Companies improve and maintain competitive performance. For Case Company 2, building and implementing manufacturing strategy has brought strong and positive results after a long period of poor performing. |
|
|
Role of technological factors |
Though the use of technology at Case Companies is still limited, both have shown vibrant activities in constructing, upgrading and using proprietary equipment to optimize their manufacturing functions. Besides, the initial technological applications such as new IT and management tools and systems are common among firms. |
|
One could draw remarkable insights from the above summaries. First, the two Case Companies have not only distinctive operating contexts but also different approaches when it comes to manufacturing strategy: While Case Company 1 is still ambiguous about manufacturing strategy, Case Company 2, although not yet officially calling out the concept, has conducted very specific steps in planning and implementing manufacturing strategy such as orientating competitive priorities and constructing detailed solutions to realize the priorities. Overall, manufacturing strategy at these two Case Companies is as follows: first, an important part of firms’ strategy involves competitive strategy, which is consistent with findings from previous researchers such as Skinner (1969), Hayes và Wheelwright (1984), and Dangayach and Deshmukh (2006); and second, it has had positive impact on competitive performance, which is consistent with the findings from the quantitative analysis.
Second, both companies have similar competitive priorities orientation, with quality and cost at the center. Only Case Company 2 has flexibility as an extra priority due to the fact that as a member of the state-owned corporation TKV, it is obliged to serve many different customers within the corporations with diverse needs. While quantitative analysis previously showed that Vietnamese manufacturers tend to put flexibility at the highest priority, and quality and cost are at the lowest, this is not contradictory because the arrangement and combination of competitive priorities depends greatly on the specific situations of each business. Case Company 2 can likely be in the same situation as many other Vietnamese manufacturers, where flexibility is considered an answer to the changing needs of customers (Chi et al., 2009). This priority negatively affects the firm’s strategic execution for consuming more resources and conflicting with the two other priorities – quality and cost.
Third, on the actualization of their competitive priorities, Case Company 1 and Case Company 2 also exhibit similarities. To achieve better quality and lower cost, both firms implemented various solutions to optimize processes, improve HR practices, and apply management and monitoring tools. Although the analytical framework of this research focuses on technology choices, it can be seen that the activities of the two Case Companies to realize competitive priorities clearly reflect the findings from previous studies (Hayes & Wheelwright, 1985; Hill, 1993) about strategic choices - the second component of manufacturing strategy, where technology choices is a subsystem. It is apparent that manufacturing strategy is a system of competitive priorities realized by the strategic choices.
Finally, it can be seen that technology application in both businesses is still at early stage, with technological activities mostly limited to upgrading IT systems and management tools; both Case Companies have not yet gone further into extensive adoption of Industry 4.0. Such technological shortage has been reported by the Ministry of Planning and Investment (2019) who claimed that Vietnamese manufacturing enterprises appear to be still on the sidelines of the current global technology revolution. Although the results in quantitative research showed that Vietnamese manufacturers evaluated their own technological activities to be relatively high, it is important to recognize that in reality, their technological side might be well in need of improvements. Nonetheless, the two Case Companies have indicated certain efforts in technological advancement with the development of proprietary equipment. More specifically, both enterprises alleged that instead of purchasing new technologies and machinery to upgrade their manufacturing lines, in many occasions they would just learn and educate themselves of the new technologies, then suitably modify and adjust their manufacturing systems and equipment on their own. This is said to be a less expensive option for them yet, “still good enough”.
5. Main findings, discussion, implication, and limitation
This study has yielded some preliminary results about manufacturing strategy and its relationship with competitive performance at Vietnamese manufacturers. Important remarks have been found. First, manufacturing strategy has a positive relationship with competitive performance. Manufacturers who have manufacturing strategy formally and effectively formulated and executed tend to have better performance. Second, Vietnamese manufacturers place the highest emphasis on flexibility among the competitive priorities, although basically, they still seem to pursue all four priorities instantaneously. Such orientation of competitive priorities might lessen the effectiveness when companies execute manufacturing strategy. Third, technology factor expressed by high technology anticipation, new technology adaptation and development of proprietary equipment - has a particularly important role with Vietnamese manufacturers, simultaneously realizing multiple competitive priorities and significantly improving competitive performance.
5.1. Limitations and future research
Besides its achieved results, the research also has a number of limitations. Firstly, the survey sent to Vietnamese manufacturers was built based on the High Performance Manufacturing (HPM) project. However, the structure and contents of this survey is designed to research manufacturing activities in general, not focusing on manufacturing strategy in particular. Thus, the scales and questions used in this study might not fit its purposes perfectly. Therefore, the questionnaire in future research should be adjusted to better suit the topic of manufacturing strategy. Secondly, due to limited resources for large-scale surveys, this study was kept at the humble sample size of 25 manufacturers for quantitative analysis, although this shortage was partly compensated by the 2 case studies. Nevertheless, this still reduces the representativeness of the sample and affects the reliability of the research analysis and results. Therefore, in future research, the sample needs to be well expanded to cover more manufacturing enterprises from more diverse industries.
5.2. Management implications
In terms of management implications, there are four valuable recommendations proposed to managers of Vietnamese manufacturing enterprises to achieve better operating and business results. First of all, it is necessary for management to be aware of the vital role of manufacturing strategy so that they should introduce manufacturing strategy into the firm’s overall strategy in an effective and systematic manner. Secondly, it is necessary to be aware of the trade-off nature of competitive priorities as well as the viable order of the priorities so that manufacturers could create a more focused and effective competitive priority system, emphasizing a small number of priorities, avoiding spreading out resources, pursuing many goals at the same time. Thirdly, it is necessary to build a comprehensive system of strategic choices to actualize the competitive priorities in order for this system to be synchronously effective, serving the exact purposes as intended. Finally, Vietnamese manufacturers need to end the “sideline” status when it comes to taking part in Industry 4.0. Though the companies seem to have taken certain initial steps adopting new technology and IT systems, their path to Industry 4.0 is still far ahead. As a result, Vietnamese manufacturers should be well-prepared and informed of the possible pros and cons in the short and long term when entering a road map to upgrade their technology. In doing so, their journey to Industry 4.0 would be less risky and more in line with their practical operations and resources.
6. Conclusion
This study was conducted to explore the current practices of manufacturing strategy with focus on technology, and the relationship between manufacturing strategy and competitive performance of Vietnamese manufacturers. The authors have investigated manufacturing strategy practices at Vietnamese manufacturing companies on both the width and the depth by conducting both quantitative and qualitative research to showcase the positive impact that manufacturing strategy has on a firm’s competitive performance. Results vividly illustrate how Vietnamese manufacturers formulate and execute their manufacturing strategy to achieve better performance. Technological factors – with 3 pillars namely anticipating high technology, adapting to new technology and owning proprietary equipment - also demonstrated crucial roles with Vietnamese manufacturers. In addition, the 2 case studies further displayed that technology application can bring outstanding benefits to enterprises by helping them achieve multiple competitive priorities at once. Useful proposals have been made accordingly for Vietnamese manufacturers to effectively adopt manufacturing strategy and modernize their technology to improve competitive performance.
References
1. Amoako-Gyampah, K., & Acquaah, M. (2008). Manufacturing strategy, competitive strategy and firm performance: An empirical study in a developing economy environment. International Journal of Production Economics, 111(2), 575-592.
2. Ang, J. S., Shimada, T., Quek, S. A., & Lim, E. (2015). Manufacturing strategy and competitive performance–An ACE analysis. International Journal of Production Economics, 169, 240-252.
3. Athukorala, P. C. (2009). Economic transition and export performance in Vietnam. ASEAN Economic Bulletin, 96-114.
4. Baur, C., & Wee, D. (2015). Manufacturing’s next act. Munich: McKinsey & Company.
5. Berry, W. L., Hill, T., & Klompmaker, J. E. (1999). Aligning marketing and manufacturing strategies with the market. International Journal of Production Research, 37(16), 3599-3618.
6. Boyer, K. K., & Lewis, M. W. (2002). Competitive priorities: investigating the need for trade‐offs in operations strategy. Production and Operations Management, 11(1), 9-20.
7. Brown, S. (1998). Manufacturing strategy, manufacturing seniority and plant performance in quality. International Journal of Operations & Production Management, 18(6), 565-587.
8. Chatha, K. A., & Butt, I. (2015). Themes of study in manufacturing strategy literature. International Journal of Operations & Production Management, 35(4), 604-698.
9. Chi, T., Kilduff, P. P., & Gargeya, V. B. (2009). Alignment between business environment characteristics, competitive priorities, supply chain structures, and firm business performance. International Journal of Productivity and Performance management, 58(7), 645-669
10. Christiansen, T., Berry, W. L., Bruun, P., & Ward, P. (2003). A mapping of competitive priorities, manufacturing practices, and operational performance in groups of Danish manufacturing companies. International Journal of Operations & Production Management, 23(10), 1163-1183.
11. Dangayach, G. S., & Deshmukh, S. G. (2001a). Manufacturing strategy: literature review and some issues. International Journal of Operations & Production Management, 21(7), 884-932.
12. Dangayach, G. S., & Deshmukh, S. G. (2001b). Manufacturing strategy: experiences from Indian manufacturing companies. Production Planning and Control, 12(8), 775-786.
13. Dangayach, G. S., & Deshmukh, S. G. (2006). An exploratory study of manufacturing strategy practices of machinery manufacturing companies of India. OMEGA, 34(3), 254-273.
14. Flynn B. B., Schroeder R. G., Flynn E. J., Sakakibara S., & Bates K. A. (1997). World-class manufacturing project: Overview and selected results. International Journal of Operations and Production Management, 17(7) 671-685.
15. General Statistics Office of Vietnam (2020). Report on Socio-economic situation in 2019. Accessed on 14/4/2020 at: https://www.gso.gov.vn/default_en.aspx?tabid=622& ItemID =19463
16. Hayes, A. F. (2012). PROCESS: A versatile computational tool for observed variable mediation, moderation, and conditional process modelling. White paper. Retrieved from http://www.afhayes.com/public/process2012.pdf.
17. Hayes, R. H., & Pisano, G. P. (1994). Beyond world-class: the new manufacturing strategy. Harvard Business Review, 72(1), 77-86.
18. Hayes, R. H., & Wheelwright, S. C. (1984). Restoring our Competitive Edge: Competing Through Manufacturing. New York, NY: John Wiley & Sons.
19. Hill, T. (2017). Manufacturing strategy: the strategic management of the manufacturing function. Macmillan International Higher Education.
20. Kikuchi, T., Yanagida, K., & Vo, H. (2018). The effects of mega-regional trade agreements on Vietnam. Journal of Asian Economics, 55, 4-19.
21. Kotha, S., & Swamidass, P. M. (2000). Strategy, advanced manufacturing technology and performance: Empirical evidence from US manufacturing firms. Journal of Operations Management, 18(3), 257-277.
22. Kroes, J. R., & Ghosh, S. (2010). Outsourcing congruence with competitive priorities: Impact on supply chain and firm performance. Journal of Operations Management, 28(2), 124-143.
23. Laureano Paiva, E., Revilla Gutierrez, E., & Roth, A. V. (2012). Manufacturing strategy process and organizational knowledge: A cross-country analysis. Journal of Knowledge Management, 16(2), 302-328.
24. Lagacé, D., & Bourgault, M. (2003). Linking manufacturing improvement programs to the competitive priorities of Canadian SMEs. Technovation, 23(8), 705-715.
25. Lin, Y., Ma, S., & Zhou, L. (2012). Manufacturing strategies for time based competitive advantages. Industrial Management & Data Systems, 112(5), 729-747.
26. McGrath, M., & Bequillard, R. (1989). International manufacturing strategies and infrastructural considerations in the electronics industry. In K. Ferdows (Ed.), Managing International Manufacturing (pp. 23-40). Elsevier Publishers.
27. Ministry of Planning and Investment of Vietnam. (2019). White book on Vietnamese enterprises. Statistical Publishing House.
28. Ministry of Planning and Investment of Vietnam. (2020). Brief on foreign direct investment of 2019. News. Accessed on 7/2/2020 at http://www.mpi.gov.vn/en/Pages/ tinbai.aspx?idTin=45020& idcm=122
29. Nguyen, D. P., Ho, V. T., & Vo, X. V. (2018). Challenges for Vietnam in the globalization Era. Asian Journal of Law and Economics, 9(1).
30. Nguyen, Q. T., Bui, T., Vu Tuan, A., & Nhung, N. H. (2019). Some Issues on Vietnam Economy. Journal of Economics and Business, 2(3).
31. Quoc, C. H., & Thi, C. D. (2018). Analysis of Foreign Direct Investment and Economic Growth in Vietnam. International Journal of Business, Economics and Law, 15(5), 2289-1552.
32. Sarmiento, R., Sarkis, J., Byrne, M., & Rich, N. (2006). A critical analysis of manufacturing capabilities measurement in manufacturing strategy studies. Boston: Cardiff University, Innovative Manufacturing Research Centre.
33. Schroeder, R. G., & Flynn, B. B. (Eds.). (2002). High performance manufacturing: Global perspectives. John Wiley & Sons.
34. Schroeder, R. G., Bates, K. A., & Junttila, M. A. (2002). A resource‐based view of manufacturing strategy and the relationship to manufacturing performance. Strategic Management Journal, 23(2), 105-117.
35. Singh, H., & Mahmood, R. (2014). Aligning manufacturing strategy to export performance of manufacturing small and medium enterprises in Malaysia. Procedia-Social and Behavioral Sciences, 130, 85-95.
36. Skinner, W. (1969). Manufacturing: Missing Link in Corporate Strategy. Harvard Business Review, May-June, 136-145.
37. Sonntag, V. (2003). The role of manufacturing strategy in adapting to technological change. Integrated Manufacturing Systems, 14(4), 312-323.
38. Swamidass, P. M., & Newell, W. T. (1987). Manufacturing strategy, environmental uncertainty and performance: A path analytic model. Management Science, 33(4), 509-524.
39. Swink, M., & Way, M. H. (1995). Manufacturing strategy: propositions, current research, renewed directions. International Journal of Operations & Production Management, 15(7).
40. Tallaki, M., & Bracci, E. (2017). International manufacturing strategy: the impact of misalignment between national culture and organizational structure. In International Manufacturing Strategy in a Time of Great Flux (pp. 43-61). Springer, Cham.
41. Tracey, M., Vonderembse, M. A., & Lim, J. S. (1999). Manufacturing technology and strategy formulation: Keys to enhancing competitiveness and improving performance. Journal of Operations Management, 17(4), 411-428.
42. Tuominen, M., Rajala, A., & Möller, K. (2004). How does adaptability drive firm innovativeness? Journal of Business Research, 57(5), 495-506.
43. Vietnam Academy of Social Sciences. (2019). Productivity and Competitiveness of Viet Nam’s enterprises - Volume 1 on manufacturing. United Nations Development Program. Accessed on 16/2/2020 at: https://www.undp.org/content/dam/vietnam/docs/ Publications/Bao%20cao%20En.pdf
44. Ward, P. T., & Duray, R. (2000). Manufacturing strategy in context: environment, competitive strategy and manufacturing strategy. Journal of Operations Management, 18(2), 123-138.
45. Ward, P. T., McCreery, J. K., Ritzman, L. P., & Sharma, D. (1998). Competitive priorities in operations management. Decision Sciences, 29(4), 1035-1046.
46. Yen, H. R., & Sheu, C. (2004). Aligning ERP implementation with competitive priorities of manufacturing firms: An exploratory study. International Journal of Production Economics, 92(3), 207-220.
47. Youndt, M. A., Snell, S. A., Dean Jr, J. W., & Lepak, D. P. (1996). Human resource management, manufacturing strategy, and firm performance. Academy of Management Journal, 39(4), 836-866.
Appendix: Survey Question Items
Manufacturing Goals
Quality
• High conformance to product specifications
Cost
• Low manufacturing unit costs
Delivery
• Short manufacturing cycle time, from raw materials to delivery
• On-time product launch
• High degree of responsiveness
Flexibility
• Ability to rapidly change over products on short notice
• Ability to vary volume of product produced on short notice
• Fast ramp-up for new products
• Rapid customization of orders
Anticipation of New Technologies
• We pursue long-range programs, in order to acquire manufacturing capabilities in advance of our needs.
• We make an effort to anticipate the potential of new manufacturing practices and technologies.
• Our plant stays on the leading edge of new technology in our industry.
• We are constantly thinking of the next generation of manufacturing technology.
Proprietary Equipment
• We actively develop proprietary equipment.
• We have equipment that is protected by our firm’s patents.
• Proprietary equipment helps us gain a competitive advantage.
• We frequently modify equipment to meet our specific needs.
• We primarily rely on outside suppliers for equipment development.
• We produce a substantial amount of our equipment in-house.
• Developing our own equipment helps us to know more than our suppliers about everything that is critical to our business.
• We develop some of our own equipment in-house, so that we are close to state-of-the-art for that equipment.
Adaptation to New Technologies
• We have a good understanding of where our production technology stands, in terms of technology life cycles.
• As new technologies emerge, we modify our production technology.
• Our current production technology is protected by patents.
• Established technology forms the foundation for our production technology.
• There are no substitutes for our production technology.
Firm Performance
• Unit cost of manufacturing
• Conformance to product specifications
• On time delivery performance
• Fast delivery
• Flexibility to change product mix
• Flexibility to change volume
• Inventory turnover
• Cycle time (from raw materials to delivery)
• Speed of new product introduction into the plant (development lead time)
• Product capability and performance
• On time new product launch
• Product innovativeness
• Customer support and service
• Employee relations
• Degree of vertical integration
• Supplier collaboration
• Customer collaboration
• Enterprise resource planning
• Quality improvement program
• Degree of mass customization
• Web-based interfaces with customers and suppliers
• JIT and lean manufacturing
• Labor cost
• Labor productivity
• Throughput: the rate at which the plant generates money through sales
• Inventory: raw materials, work-in-process and finished goods
• Operating expense: funds spent to generate turnover, including direct labor, indirect labor, rent, utility expenses and depreciation