Organizations and Markets in Emerging Economies ISSN 2029-4581 eISSN 2345-0037
2020, vol. 11, no. 2(22), pp. 305–326 DOI: https://doi.org/10.15388/omee.2020.11.35
Macroeconomic Effects of Trade Tariffs: A Case Study of the U.S.-China Trade War Effects on the Economy of the United States
Sandra Žemaitytė (corresponding author)
Vilnius University, Lithuania
san.zemaityte96@gmail.com
https://orcid.org/0000-0003-2900-4999
Laimutė Urbšienė
Vilnius University, Lithuania
laima.urbsiene@gmail.com
https://orcid.org/0000-0001-9024-1323
Abstract. This paper explores the macroeconomic effects of trade tariffs in the context of the recent trade conflict between the United States and China. The focus is laid on two trade war scenarios, and one of them takes into account the effects of the COVID-19 pandemic on the global trade flows. After deploying the partial equilibrium SMART model, the authors conclude that solely due to the trade war with China, in 2020, the US total trade balance will improve by 41,020 million USD (0.21% of real GDP), while 43,777 million USD (0.22% of real GDP) of the US imports will have to be sourced from other countries. The US trade intensity with China and welfare will decline. However, our study has found that the potential economic consequences of COVID-19 will reduce the relative effects of the trade war. The study has revealed that the United States economy will benefit from the trade war, which can be explained by a relatively weak China’s retaliatory response. Nevertheless, the US agriculture and automotive sectors will suffer most.
Keywords: trade tariffs, US-China trade war, trade balance, welfare.
Received: 8/9/2019. Accepted: 11/11/2020
Copyright © 2020 Sandra Žemaitytė, Laimutė Urbšienė. Published by Vilnius University Press. This is an Open Access article distributed under the terms of the Creative Commons Attribution Licence, which permits unrestricted use, distribution, and reproduction in any medium, provided the original author and source are credited.
1. Introduction
Despite generally diverse scholars’ views on global issues, the majority of economists tend to agree that international trade should be free. This perspective dates back to at least Adam Smith’s “Wealth of Nations” (1776). Today, the idea of an open international trading system has also been advocated for by the World Trade Organization (WTO). Over the period of the first 25 years following the Second World War, the tariffs on manufactured goods fell to as low as 5% in the industrial countries boosting the growth of the world economy and trade by 5% and 8%, respectively (WTO, 2005). The data indicates a link between the free international trade and the economic growth, backed by a simple theory of a comparative advantage introduced by a classical economist David Ricardo. In general, a free flow of goods and services increases competition, innovation, an efficient allocation of resources, and allows maximizing the output by directing resources to their most productive uses. But what happens when the restrictions for free trade such as trade tariffs are put in place?
At first, it would seem that the imposition of a trade tariff should create a stimulus to the domestic economy by promoting production and employment (Reitz & Slopek, 2005). Apart from that, the governments enforce import tariffs not only to protect the selected industries but also to raise their revenues or to exert their political and economic leverage over another country. For example, in 1980, the US tariffs on Italian wine and French cheese persuaded the European Union (EU) to start negotiations in terms of the Common Agricultural Policy (Fetzer & Schwarz, 2019). Unfortunately, the tariffs can have the unintended side effects. These barriers to free trade trigger the inefficiency of domestic producers, evasion, and reduction in welfare. Most importantly, increased protectionism provokes retaliation resulting in elevated prices, reduced output, and a substantial shock to supply chains, as trades have to be redirected to avoid tariff costs (Furceri et al., 2019).
The economic effects of trade tariffs have always been of primary concern to the society, therefore the US-China trade war has gained a lot of attention. Numerous studies have examined this trade war, yet most of them seem to be theoretical and calibrating different scenarios models or limited to micro-level analysis. The effects of trade war receive even less scholarly attention in the times of the global COVID-19 pandemic. The absence of the empirical evidence on the economic effects of the US-China trade war based on the most recent data was the main stimulus of this paper.
In this study, the authors aim to ascertain whether and how the bilateral tariffs imposed between the United States and China in 2018 and 2019 have affected the main economic indicators of the US, such as trade diversion from China, trade balance, welfare, and trade intensity. The SMART model calibration results have shown that in 2020, the US total trade balance will improve by 0.21% of real GDP, while the US imports worth 0.22% of real GDP will have to be sourced from other countries. The US trade intensity with China will consequently decline. Moreover, the US welfare will decrease by 0.011% of real GDP. The findings of this research are of particular importance not only to the policymakers in the United States, but also to other countries in identifying the potential effects that the initiated trade war can have on the US economy or on any economy who will opt to impose trade tariffs on its trading partners.
The paper is structured as follows: literature review, an analysis of the current situation of the US-China trade war, a description of research methodology, the results obtained after applying the SMART model to two trade war scenarios, the interpretation of the results and the comparison with other scientific papers, the robustness analysis based on the sensitivity to changes in elasticity parameters, and concluding remarks.
2. Literature review
Many studies about the effects of trade tariffs are microeconomic in nature and focus on individual industries. This makes sense as tariffs have gradually decreased since World War II and later were targeted to specific industries only. However, the US-China trade war calls for the assessment of the macroeconomic effects.
The import imposition increases the price of the imported goods in the domestic market and reduces the demand for imports. If the home economy is big, this reduced demand could even decrease the world prices of such imports (Metzler, 1949). If imports have a perfectly elastic supply, and the supply curve of the foreign country exports is horizontal, the tariff increase has no effect on foreign prices and is fully observed by home consumers. Macera and Divino (2015) employed a dynamic stochastic general equilibrium (DSGE) model to study the case of Brazil, where from 2010 to 2013 high import tariffs were imposed on more than 100 products, and found that 20% of import tariff shock increased the domestic price of the imported goods by 15%. This indicates an incomplete pass-through from import tariffs to domestic prices.
Trade tariffs are also found to reduce real GDP. Kawasaki (2018) used a Computable General Equilibrium (CGE) model to estimate the economic impact of the US import tariffs on steel and aluminium and concluded that the US real GDP would shrink by 0.2%. Bollen and Rojas-Romagosa (2018) employed a WorldScan model to estimate the effects of the full-scale US-China trade war scenario. Their results suggested that China and the US would experience 1.2% and 0.3% real GDP losses, respectively.
When import tariffs are imposed, a loss in deadweight and welfare occurs due to a shift to less efficient market outcomes as the participants are forced to waste or underutilize resources (Evans, 2019). Theoretically, an optimal tariff could result in an increased nation’s welfare when the domestic economy is large and has monopsony power in the market, which forces the exporters to reduce their prices to maintain the same export size and allows the importing countries to capture the revenue that the exporters previously received (Irwin, 2014). In such a case, the marginal gain in terms of trade is equal to the marginal loss from the distortion of consumption and production (Krugman & Obstfeld, 2009). According to Amiti et al. (2019), the domestic economy benefits from the import tariff imposition when gains in terms of trade exceed welfare loss. Tu et al. (2020) used a Single Market Partial Equilibrium Simulation Tool (SMART) model and estimated that the US-China trade war could generate welfare losses of 1,437 and 2,193 million USD in the US and China, respectively.
The theory does not deliver any strong conclusions of what would be the effect of trade tariff imposition on the trade balance. Under the income-expenditure approach (Ostry & Rose, 1992), the tariff will switch expenditure from foreign to domestic goods, which in turn will improve the trade balance. However, this approach assumes that foreigners do not retaliate against the tariff. If they did, the effects on the trade balance, in general, would be ambiguous. An alternative approach is a monetary approach to the balance of payments introduced by Mussa (1974). It assumes that the economy’s long-run equilibrium is given by the Heckscher-Ohlin model. In this model, import tariffs for certain products increase the relative prices of domestic goods that used to compete with them. The acceleration in the prices of domestic goods results in an increased domestic production and fallen consumption of imported goods. Consequently, under the monetary approach, tariffs reduce both the volume of imports and exports but the total trade balance is unaffected (Mussa, 1974). Lastly, the intertemporal approach suggested by Razin and Svensson (1983) assumes that the effects of trade tariffs depend on whether the tariff is temporary or permanent. Temporary tariffs affect the intertemporal relative prices and make the consumers cut spending in the present for the increased spending in the future. Permanent tariffs do not lead to an intertemporal consumption substitution and thus the tariffs have negligible effects on the trade balance.
Kawasaki (2018) concluded that the US import tariffs on steel and aluminium would improve the US metal trade balance by 59.4 billion USD. However, exports of automobiles, electronics, and other machines would drop by 3.4%, 5.1%, and 5.8%, respectively and thus, the overall improvement of the trade balance would be relatively small (1.3 billion USD). Tu et al. (2020) suggested that the US-China trade war should result in the reduction of the US imports from China and China’s imports from the US by 91,459 and 36,706 million USD, respectively. Also, they found that the trade tariffs increased trade diversion. A total of 36,783 million USD US imports and 17,207 million USD of Chinese imports were estimated to be diverted from China or the US to other trading partners, respectively.
Researchers found that the effects of tariffs significantly depended on many economic factors. Furceri et al. (2019) demonstrated how large economies that chose to impose import tariffs faced more extreme decreases in the domestic output and labour productivity when compared to the emerging markets and the developing economies. Furthermore, Furceri et al. (2019) found that the rise of tariffs impacted the medium-term losses in output and labour productivity which tended to be more sizeable when the economy was in an upturn rather than in a recession. The United States is a large economy that according to the National Bureau of Economic Research (NBER), reached its peak in February 2020 and is in decline now. Consequently, it might experience less severe effects from the trade war with China than it would have experienced if the global COVID-19 pandemic had not hit the economy.
3. Analysis of the situation
During his campaign rally in 2016, Donald Trump accused China of the greatest theft in the world and promised to fight unfair trading partners’ practices if he was elected. After Donald Trump took the office, Section 232 of the Trade Expansion Act of 1962 investigations were launched in June 2017 that concluded that the imported steel and aluminium “were threatening to impair the national security” and recommended to “take action to protect a long-term viability of the nation’s steel and aluminium industries” (Presidential Memorandum, 2018). The method selected to fight unfair trading partners’ practices – import tariffs – breached global trading rules and put the idea of free trade on a test. The import tariffs on all steel and aluminium imports amounting to nearly 18 billion USD were implemented in March 2018. The first China-specific tariffs were imposed after the Section 301 of the Trade Expansion Act of 1974 investigation on July 6, 2018.
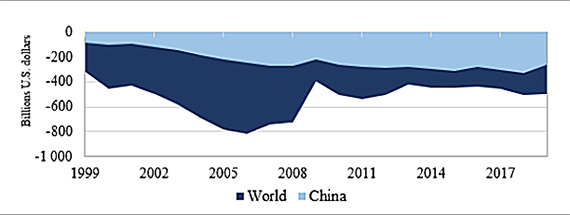
FIGURE 1. Real trade balance of the U.S. with the world and China
Source: compiled by authors, based on the data of the U.S. Bureau of Economic Analysis and International Monetary Fund data.
Overall, the economists see the current trade deficit (Figure 1) as a weak argument for the US to start a trade war. The study prepared by Oxford Economics (2017) to the US-China Business Council demonstrated that the negative aspects of trade with China were overstated. First of all, despite huge efforts to move up the value-added chain, China still uses roughly 50% of the intermediate goods in computer equipment, electronics, and electrical machinery assembly imported from foreign countries. Consequently, the US trade deficit with China adjusted for the value-added content is twice lower. Also, despite the trade deficit in goods, the US actually experiences a significant and growing trade surplus in services. The intention to get Beijing to widely open its market for American goods and services to provide American companies with more favourable conditions and curb the Chinese high-tech sectors that are backed by the state via the “Made in China 2025” strategy is seen as a more realistic rationale to start the trade war (Ibrahim & Benjamin, 2019).
The import tariffs imposed by the US are summarized in Table 1. The products that were targeted first belong to such strategic Chinese sectors as machinery, mechanical appliances, electrical equipment, information technology, robotics, and high-technology medicine. Later, intermediate outputs and consumer goods were targeted. China responded with a kind of tit-for-tat retaliation, targeting not necessarily the same (but also strategic) industries and products, and smaller amounts of total imports from the US.
TABLE 1. The U.S. import tariffs imposed under Sections 232 and 301
|
Investigation |
Effective Date |
Imposed Tariffs |
|
Section 232 |
March 23, 2018 |
Tariffs on all imports of steel (25%) and aluminium (10%). |
|
Section 301 |
July 6, 2018 |
25% tariffs on $34 billion of Chinese goods. List 1. |
|
August 8, 2018 |
25% tariffs on $16 billion of Chinese goods. List 2. |
|
|
September 18, 2018 |
10% tariffs on $200 billion of Chinese goods. List 3. |
|
|
May 13, 2019 |
Tariffs increased to 25% for List 3 ($200 billion worth of products). |
|
|
Section 301 |
September 1, 2019 |
Part of the remaining goods get 15% tariff. List 4A starts ($112 billion worth of products). |
|
December 15, 2019* |
15% tariffs on the remaining List 4B goods (*suspended indefinitely). |
|
|
February 14, 2020 |
Tariff rate was reduced from 15% to 7.5% for List 4A goods. |
Source: compiled by authors, data retrieved from Li, M. (2018) CARD Trade War Tariffs Database. Accessed on 25th of April 2020.
Both countries have already experienced the increasingly negative effects of the trade war that particularly hit the farmers - a very important political constituency for President Trump. For that reason, a subs idy program was created under which the farmers received 8.5 and 14.3 billion USD for 2018 and 2019, respectively. No trade-related subsidies were paid out for 2020. In the context of the forthcoming U.S. presidential election campaign, the pressure for the President to reach a consensus with China increased, and the negotiations to start phasing out the import tariffs started. On January 15, 2020, the US and China signed Phase 1 deal that cut the US tariffs for List 4A1 goods by half in exchange for China’s pledge to increase the purchases of American products and services by at least 200 billion USD over the next two years. The tariffs on List 4B2 that were scheduled to come into effect on December 15, 2019 were suspended indefinitely as well as China’s retaliatory actions to them.
The main features of the trade war make it a great natural experiment for measuring the economic effects of tariffs. First of all, an increase in import tariffs was highly unanticipated, as most observers believed that Hillary Clinton, with a supposedly different approach to the trade policy, would win the election. In addition, import tariffs extensively vary across products and time. This specific feature simplifies the measurement of import tariff economic effects using conventional datasets (Amiti et al., 2019).
COVID-19 economic effects cannot be overlooked when talking about the trade war and calls for the additional assessment. Compared to the “regular” recessions, the 2020 global downturn is extraordinary in a way that it originated not from the financial markets. McKibbin and Fernando (2020) used a hybrid global intertemporal general equilibrium model to find that the global real GDP in 2020 would shrink by 2.4 trillion USD and 9 trillion USD in case of a low-end and serious pandemic outbreak, respectively. International trade is one of the leading mechanisms through which the virus damages domestic economies. According to Baldwin and Weder di Mauro (2020), the COVID-19 pandemic is a supply shock (factory closures, border closings) that will reduce exports and a demand shock that will reduce imports. Boone (2020) suggested that world trade would be substantially weakened: under the best-case scenario (with the epidemic contained in China with limited clusters elsewhere) global trade would shrink by 0.9% in 2020, while under the downside scenario it could decline by around 3.75% in 2020. Baldwin and Tomiura (2020) suggested relying on the historical lessons from global trade shocks such as the dotcom bubble in 2001, when the US imports fell by 2.8%, or the financial crisis of 2009, when the global imports fell by 11.79% and the imports in the US dropped by 13.08%. Based on those conclusions, the authors assumed that global trade during 2020 might shrink between 5% to 15%.
4. Methodology of the research
The effects of trade tariffs can be empirically assessed with either equilibrium or regression models. The general equilibrium (GE) and partial equilibrium (PE) models are used more widely. According to Rosyadi and Widodo (2018), the main advantage of such models is that they provide an economy-wide examination of the trade policy and more theoretically sound results in comparison to econometric estimations. The PE models are vulnerable to criticism because they are said not to be able to capture the economy-wide effects of the trade policy changes (Jammes & Olareagga, 2005). The GE models can take into account the second-round effects such as the exchange rate and the inter-industry effects, all the markets are modelled simultaneously and interact. However, the GE models are significantly dependent on the extensive underlying assumptions, and their results are very sensitive to the changes in these assumptions. In addition, the GE models work with large inter-industry aggregates, thus are not able to capture the intra-industry details. Contrary to that, the partial equilibrium models have the advantage of working at a very fine level of detail and thus avoiding this aggregation bias.
The Single Market Partial Equilibrium Simulation Tool (SMART) developed by the World Bank and UNCTAD was selected for further analysis of this paper due to its ability to trace the complex effects of multilateral trade conflicts on a very detailed level. The authors accept the shortcoming of the PE model – its sensitivity to elasticity values, which will be eliminated by checking the model results with different elasticity values (robustness analysis).
Even though the consumers in the home country can choose to buy products from all over the world, and all the countries export at the same price worldwide, the prices that the domestic consumers pay can vary due to the differences in tariffs. The model relies on Armington’s (Armington, 1969) assumption of an imperfect substitution between the different import sources. Therefore, the consumers, when making consumption decisions, will not necessarily choose import goods from the cheapest markets only and will follow Armington’s two-step optimization process. Another important assumption of the model is a perfect competition, which means that the increases or cuts of tariff rates will be fully reflected in the prices paid by the consumers.
The SMART model requires three main variables as an input: trade tariff rates, trade values, and elasticities.
Trade tariff rates. During the US-China trade war, import tariffs were imposed in several waves across 2018 and 2019. The lists of currently effective trade tariffs are lengthy and difficult to interpret. Li (2019) created a harmonized database - CARD Trade War Tariffs Database – by including all the tariff increases during the US-China trade war. This dataset provides raw tariff increase data collected from the official sources aggregated to the six-digit Harmonized System (HS) codes. In addition to the US-China trade tariffs, the model requires current duty rates for all the United States trading partners on a six-digit HS product codes level. The information about the import tariff rates that were applicable in 2019 was extracted from the United Nations’ UNCTAD’s TRAINS database.
Trade values. All the trade values between the US and its trading partners were extracted from the UN Comtrade database. For the simulations around COVID-19 scenario, those values were reduced according to the findings in the Situation analysis and inserted into the SMART model under the “SMART with User’s Data” function.
Elasticities. The SMART model incorporates three kinds of elasticities: import demand, export supply, and import substitution. The import demand elasticity shows how demand responds to a shift in import price. It varies between the different HS 6-digit product codes in the SMART model. The export supply elasticity is considered infinite (i.e. 99). This means that the export supply curves are flat, and the world prices for each product are given exogenously – the price taker assumption. The import substitution elasticity is set to 1.5 by default in SMART following Armington’s (Armington, 1969) assumption, and it indicates that similar goods from different countries are not perfect substitutes.
After estimating the trade tariff effects on the selected macroeconomic variables with default elasticities, the sensitivity analysis was carried out to check the robustness of the results. The substitution elasticity was halved and then doubled according to Table 2.
TABLE 2. Elasticities used in the sensitivity analysis
|
Elasticity |
Lower bound |
Base case |
Upper bound |
Best case |
|
Substitution elasticity |
0.75 |
1.5 |
2.25 |
3 |
|
Export supply elasticity |
99 |
99 |
99 |
99 |
Source: compiled by authors, according to Tu et al. (2020).
The empirical research focused on assessing the trade war effects on four US macroeconomic indicators: trade diversion from China, trade balance, welfare, and trade intensity. Furthermore, model output values for the selected variables were compared with the US real GDP, which according to IMF projections, should decline by 8% in 2020 when compared to 2019 (US real GDP should be around 19,990.8 billion USD in 2020) (IMF, 2020).
Trade creation effect results from the increase in the domestic demand for imports from the trading partner after the imported good becomes less pricy than the domestically produced substitute depending on the tariff rates decrease. The trade creation effect is negative when the price of import or tariff increases.
Trade diversion effect refers to the substitution of goods coming from one foreign supplier to another due to the changes in import prices and the difference between the tariff rates offered to different foreign suppliers. The model captures the amounts of trades and the countries where these trades will have to be diverted. A greater substitution elasticity set in the model results in higher trade diversion effects. In the US-China trade war case, the trade diversion from China showed the amount of imports that the United States will have to source from other countries due to the increased tariffs. Consequently, the trade diversion from China is neutral towards the total trade balance of the US (it has effects only on trade balance with China).
The price effect. The model simulation will assume the infinite export supply elasticity. Consequently, there will be no price effects.
The trade balance effect refers to a change in import and export values that result from the trade tariff imposition. The effect on the US trade balance with China is the difference between changes in the US imports and exports from and to China. The change in the US trade balance with the world is comparably smaller because of the trade diversion from the China effect.
The welfare effect refers to a change in deadweight loss. It sums up the changes in the producer and consumer surplus and the changes in tariff revenues. The consumer surplus losses and the producer surplus increase derive from the higher domestic prices after the imposition of the tariffs due to the reduction of demand. In addition, the new domestic price does not incline to the full extent of the tariff change.
The trade intensity effect refers to a change in the trade volumes with a given trading partner. Tariffs are expected to reduce the trade intensity between the countries. According to Frankel and Rose (1998), the US trade intensity with China can be calculated by normalising the bilateral trade flows by the total trade (1)
 (1)
(1)
or by nominal GDP in the two countries (2)
 (2)
(2)
The empirical research focused on two main scenarios: the trade war scenario and the COVID-19 scenario.
The trade war scenario analysed the effects that the trade tariffs imposed between the United States and China had on the selected variables (including Phase 1 deal). The trade values from the UN-Comtrade database and the default sensitivity values were used.
The COVID-19 scenario included the tariffs from the Trade war scenario but the data was also impacted by the potential implications of the COVID-19 global pandemic. It was achieved by taking the 2019 trade values from the UN-Comtrade database at the disaggregated HS codes level and reducing them by 5% (optimistic case), 10% (mild case), and 15% (downside case).
The SMART model reports are lengthy and present trade tariff effects per each HS6 product code and trading partner separately. Seeking to simplify the interpretation of the results, the model output was consolidated into 15 broader categories according to the HS2 product codes (Appendix A).
5. Results of the empirical research
5.1. The results of the Trade war scenario simulation and the sensitivity analysis
The utilization of the SMART model to simulate the impact of the trade war on the United States economy (Table 3) revealed that the trade war entailed significant declines in US exports and imports from China. The tariff increase simulation showed that approximately 43,777 million USD of US imports would have to be obtained from other trading partners than China. The US imports from China were projected to decrease by 108,458 million USD, and US exports to China were supposed to decrease by 23,661 million USD, which would make a positive effect on the total US trade balance with China of 84,797 million USD. The significant difference between the changes in imports and exports could be explained by the fact that China had imposed relatively lower tariffs and far shorter lists of products. The US trade balance with the world was calculated to improve by 41,020 million USD. As for the US welfare, it was calculated to decrease by 2,193 million USD in 2020 solely due to the trade war. Amiti et al. (2019) suggested deducting welfare losses from the trade balance improvement to reveal if the domestic economy benefited from the import tariff imposition. According to the results shown in Table 3, the United States economy will benefit from the trade war.
TABLE 3. The model output for the Trade war scenario (in millions of USD and % of GDP)
|
Trade diversion from China |
US imports from China |
US exports to China |
Trade balance with China |
Trade balance with world |
Welfare |
|
43,777 (0.22%) |
-108,458 (0.54%) |
-23,661 (0.12%) |
84,797 (0.42%) |
41,020 (0.21%) |
-2,193 (0.011%) |
Source: compiled by authors, based on SMART model simulations and IMF GDP projections for 2020.
Also, based on the model results, the authors calculated that the US trade intensity with China would decrease by 1.13% and 0.29% when normalising the bilateral trade flows by the total trade and nominal GDPs, respectively.
Appendix B shows that the US targeted China’s machinery and electrical products, while China targeted America’s agricultural and automobile sector products with its imposed tariffs. The latter consequences were already visible in the market given the many complaints from the US farmers and car producers, who claimed that the trade war had cost them China’s market. On the other hand, it is evident from Appendix B that the US will significantly improve trade balance with China not only for machinery and electrical products but also for miscellaneous products. This includes medical instruments, arms, and ammunition, furniture, etc. Unfortunately, the US welfare will be hurt the most by the product categories that received the heaviest import tariff burden.
Our results are close to the results obtained by Tu et al. (2020) who also employed the SMART model on the three lists of the US-China tariffs (List 4 and Phase 1 deal excluded) and found that the US imports from China and the US exports to China were expected to be reduced by 91,459 and 36,706 million USD, respectively, and the trade diversion would be 36,783 million USD. In addition, they estimated that the US welfare was likely to shrink by 1,437 million USD. Taking into account that the authors of this paper included lengthier import tariff lists, the projected declines in the US imports and welfare were found to be more sizable, accordingly.
The sensitivity analysis of the Trade war scenario presented in Table 4 shows that the lower substitution elasticity resulted in smaller trade war effects on trade diversion and trade balance, and a higher decrease in welfare. The higher substitution elasticity had the opposite effect.
TABLE 4. The sensitivity analysis of the Trade war scenario (in millions of USD and % of GDP)
|
Substitution elasticity |
Trade diversion from China |
US imports from China |
US exports to China |
Trade balance with China |
Trade balance with world |
Welfare |
|
0.75 |
21,575 (0.11%) |
-86,256 (0.43%) |
-22,479 (0.11%) |
63,777 (0.32%) |
42,202 (0.21%) |
-2,399 (0.012%) |
|
1.5 (base scenario) |
43,777 (0.22%) |
-108,458 (0.54%) |
-23,661 (0.12%) |
84,797 (0.42%) |
41,020 (0.21%) |
-2,193 (0.011%) |
|
2.25 |
66,749 (0.33%) |
-130,880 (0.65%) |
-24,843 (0.12%) |
106,037 (0.53%) |
39,288 (0.20%) |
-1,831 (0.009%) |
|
3 |
90,342 (0.45%) |
-154,473 (0.77%) |
-26,027 (0.13%) |
128,446 (0.64%) |
38,104 (0.19%) |
-1,625 (0.008%) |
Source: compiled by authors, based on SMART model simulations and IMF GDP projections for 2020.
The direction of changes in the model values was expected. For example, under the higher substitution elasticity, the loss in welfare was lower because the consumers could more easily switch to other goods. The disaggregated model results also suggested that changing substitution elasticity did not affect the weights of each product category in the total change of the macroeconomic indicators. The comparison of the results of the sensitivity analysis with the base case showed that the results of the cases under the lower bound and the upper bound (substitution elasticity 0.75 and 2.25, respectively) varied from the base scenario by approximately the same amount (Table 5).
TABLE 5. Changes from the base case in the sensitivity test of the Trade war scenario (by percentage)
|
Substitution elasticity |
Trade diversion from China |
US imports from China |
US exports to China |
Trade balance with China |
Trade balance with world |
Welfare |
|
0.75 |
-50.72% |
20.47% |
4.996% |
-24.79% |
2.88% |
-9.40% |
|
2.25 |
52.48% |
-20.67% |
-4.999% |
25.05% |
-4.22% |
16.51% |
|
3 |
106.37% |
-42.43% |
-10.001% |
51.47% |
-7.11% |
25.90% |
Source: calculated by authors.
The trade diversion from China was found to be the most sensitive to the selected substitution elasticity value. On the other hand, the changes in the trade balance with the world and welfare adjusted by only 2.88% to 16.51% by halving and doubling the substitution elasticity value. This suggests the robustness of the model results.
In line with the economic theory, the US-China trade war leads to significant decreases in the US bilateral trade flows and trade intensity with China. Both the US trade balances with China and the whole world were calculated to improve significantly. Moreover, the gains in terms of trade were found to outweigh the losses in the country’s welfare. This might be explained by the relatively weak China’s retaliatory response in avoiding to deepen the trade conflict. China is still a middle-income economy that greatly relies on the US products, technologies, and the workplaces they create. China’s unemployment is relatively high, and Beijing is hesitant to take any actions that would cost jobs.
5.2. The results of the COVID-19 scenario simulation and the sensitivity analysis
The utilization of the SMART model to simulate the impact of the trade war on the United States economy under the three different cases of the COVID-19 scenario (Table 6) showed that the potential economic consequences of the COVID-19 pandemic reduced the relative effects of the US-China trade war. Moreover, the harsher the COVID-19 pandemic hits the global trade, the smaller impact the trade war is relatively likely to have on the US trade diversion from China, trade balance, and welfare. In all the three cases, the US economy was found to be benefiting from the trade war as gains in terms of trade outweigh welfare losses.
TABLE 6. The model output for the COVID-19 scenario (in millions of USD and % of GDP)
|
Substitution elasticity |
Trade diversion from China |
US imports from China |
US exports to China |
Trade balance with China |
Trade balance with world |
Welfare |
|
Optimistic case (-5%) |
||||||
|
0.75 |
20,589 (0.10%) |
-82,036 (0.41%) |
-21,355 (0.11%) |
60,681 (0.30%) |
40,092 (0.20%) |
-2,212 (0.011%) |
|
1.5 (base scenario) |
41,777 (0.21%) |
-103,224 (0.52%) |
-22,478 (0.11%) |
80,746 (0.40%) |
38,969 (0.19%) |
-2,017 (0.010%) |
|
2.25 |
63,532 (0.32%) |
-124,978 (0.63%) |
-23,601 (0.12%) |
101,377 (0.51%) |
37,846 (0.19%) |
-1,804 (0.009%) |
|
3 |
85,800 (0.43%) |
-147,246 (0.74%) |
-24,726 (0.12%) |
122,521 (0.61%) |
36,722 (0.18%) |
-1,610 (0.008%) |
|
Mild case (-10%) |
||||||
|
0.75 |
19,505 (0.10%) |
-77,718 (0.39%) |
-20,104 (0.10%) |
57,614 (0.29%) |
38,109 (0.19%) |
-2,096 (0.010%) |
|
1.5 (base scenario) |
39,578 (0.20%) |
-97,791 (0.49%) |
-21,041 (0.11%) |
76,749 (0.38%) |
37,172 (0.19%) |
-1,911 (0.010%) |
|
2.25 |
60,188 (0.30%) |
-118,401 (0.59%) |
-21,979 (0.11%) |
96,422 (0.48%) |
36,233,760 (0.18%) |
-1,709 (0.009%) |
|
3 |
81,284 (0.41%) |
-139,497 (0.70%) |
-22,918 (0.11%) |
116,579 (0.58%) |
35,295,322 (0.18%) |
-1,525 (0.008%) |
|
Downside case (-15%) |
||||||
|
0.75 |
18,303 (0.09%) |
-72,814 (0.36%) |
-19,107 (0.10%) |
53,707 (0.27%) |
35,405 (0.18%) |
-1,948 (0.010%) |
|
1.5 (base scenario) |
37,139 (0.19%) |
-91,650 (0.46%) |
-20,111 (0.10%) |
71,538 (0.36%) |
34,400 (0.17%) |
-1,773 (0.009%) |
|
2.25 |
56,477 (0.28%) |
-110,988 (0.56%) |
-21,117 (0.11%) |
89,872 (0.45%) |
33,395 (0.17%) |
-1,583 (0.008%) |
|
3 |
76,427 (0.38%) |
-130,938 (0.65%) |
-22,123 (0.11%) |
108,816 (0.54%) |
32,389 (0.16%) |
-1,408 (0.007%) |
Source: compiled by authors, based on SMART model simulations and IMF GDP projections for 2020.
Appendix C provides the COVID-19 scenario trade effects disaggregated into fifteen product categories. The proportions by which each product line contributes to the absolute trade effect value in the COVID-19 scenario did not differ much from those of the Trade war scenario. This can be explained by the fact that the trade values were the only thing that was different from the Trade war scenario. The results of the sensitivity analysis (Table 6) showed that a lower substitution elasticity made a smaller impact on trade diversion, imports, exports, trade balance, and welfare values. The opposite also appeared to be true. These findings corresponded to those of the Trade war scenario and once again proved the accurateness of the model: when elasticity and trade values were exposed to change.
Furthermore, to identify the main trends, the results of the sensitivity analysis were compared with the base case, and the percentage changes were calculated (Table 7).
In line with the analysis of the sensitivity results of the Trade war scenario, the changing substitution elasticity did not significantly affect the US exports and the trade balance with the world’s figures. Consequently, it can be concluded that the US exports and trade balance with the world estimations tend to be robust. In relative terms, the estimations of other trade effects were found to be not significant in absolute terms.
All things considered, the potential economic effects of the COVID-19 global pandemic reduced the US-China trade war effects. Despite that, the changes to the US trade diversion from China, trade balance with the world, and welfare still comprised 0.009% to 0.21% of the forecasted 2020 real GDP. Moreover, even taking into account the potential effects of the global COVID-19 pandemic, the US will still able to benefit from the trade war, as under all the three cases, the gains from the improved trade balance were more significant than welfare losses. Nevertheless, the COVID-19 scenario was constructed based on the economists’ projections that were made at the beginning of the summer 2020. These predictions might have radically changed with another COVID-19 pandemic wave hitting in the autumn. Thus, the actual picture is prone to change and may overtake the one predicted in the downside case.
TABLE 7. Changes from the base case in the sensitivity test of the COVID-19 scenario (by percentage)
|
Substitution elasticity |
Trade diversion from China |
US imports from China |
US exports to China |
Trade balance with China |
Trade balance with world |
Welfare |
|
Optimistic case (-5%) |
||||||
|
0.75 |
50.72% |
20.53% |
4.996% |
-24.85% |
2.881% |
-9.70% |
|
2.25 |
-52.07% |
-21.08% |
-4.999% |
25.55% |
-2.883% |
10.55% |
|
3 |
-105.38% |
-42.65% |
-10.001% |
51.74% |
-5.769% |
20.19% |
|
Mild case (-10%) |
||||||
|
0.75 |
50.72% |
20.53% |
4.454% |
-24.93% |
2.521% |
-9.70% |
|
2.25 |
-52.07% |
-21.08% |
-4.457% |
25.63% |
-2.523% |
10.55% |
|
3 |
-105.38% |
-42.65% |
-8.917% |
51.90% |
-5.048% |
20.19% |
|
Downside case (-15%) |
||||||
|
0.75 |
50.72% |
20.55% |
4.995% |
-24.93% |
2.920% |
-9.83% |
|
2.25 |
-52.07% |
-21.10% |
-4.999% |
25.63% |
-2.922% |
10.71% |
|
3 |
-105.79% |
-42.87% |
-10.001% |
52.11% |
-5.847% |
20.58% |
Source: calculated by authors.
6. Conclusions
The partial equilibrium SMART model simulations suggest that the United States’ total trade balance will improve by 41,020 million USD (0.21% of real GDP) in 2020, while 43,777 million USD (0.22% of real GDP) of US imports will have to be sourced from other countries. In addition, the welfare will decrease by 2,193 million USD (0.011% of real GDP). The US trade intensity with China will decline by 1.13% and 0.29% when normalising bilateral trade flows by the total trade and nominal GDPs, respectively. The potential COVID-19 economic consequences were found to reduce the trade war’s relative effects. The model estimations passed the robustness tests.
As for the wider implications, the US seems to benefit from the trade war. This is mainly associated with the greater US market power and a relatively weak China’s retaliatory response – a fear to escalate the trade conflict that would further hurt its domestic companies and employment figures. However, the trade war effects between the US industries are uneven. The US agricultural and automotive industries are hurt more than others. If the trade conflict continues to escalate, not only the consumers will suffer from the increasing prices, but also the fractured input-output linkages and the economic uncertainty will hurt some industries even further. This research is especially important for policymakers considering the potential effects of the trade tariffs imposition. The success of such protectionist policies is proven to considerably depend on the trading partner’s retaliatory actions. In addition, a careful examination of the trade policy’s possible effects on the country’s welfare, supply chains, and trade flows should be performed before taking any actions. After all, trade wars are neither good nor easy to win.
References
Amiti, M., Redding, S. J., & Weinstein, D. E. (2019). The Impact of the 2018 tariffs on prices and welfare. Journal of Economic Perspectives, 33(4), 187-210. DOI: 10.1257/jep.33.4.187.
Armington, P. S. (1969). A Theory of Demand for Products Distinguished by Place of Production. Staff Papers, 16(1), 159–178. DOI: 10.2307/3866403.
Baldwin, R., & Tomiura, E. (2020). Thinking ahead about the trade impact of COVID-19. In R. Baldwin & B. Weder di Mauro (Eds.), Economics in the Time of COVID-19 (pp. 59-71). CEPR Press.
Baldwin. R., & Weder di Mauro, B. (Eds.). (2020). Economics in the Time of COVID-19. CEPR Press.
Bollen, J., & Rojas-Romagosa, H. (2018). Trade wars: Economic impacts of US tariff increases and retaliations - An international perspective. CPB Background Document, 1–43. Retrieved from: https://www.cpb.nl/sites/default/files/omnidownload/CPB-Background-Document-November2018-Trade-Wars-update.pdf.
Boone, L. (2020). Tackling the fallout from COVID-19. In R. Baldwin & B. Weder di Mauro (Eds.), Economics in the Time of COVID-19 (pp.37–44). CEPR Press.
Evans, O. (2019). The effects of US-China trade war and Trumponomics. Forum Scientiae Oeconomia, 7(1), 47-55. Retrieved from: https://mpra.ub.uni-muenchen.de/93682/1/MPRA_paper_93682.pdf.
Fetzer, T., & Schwarz, C. (2019). Tariffs and Politics: Evidence from Trump’s Trade Wars. CEPR Discussion Paper, No. DP13579. Retrieved from: https://ssrn.com/abstract=3354445.
Frankel, J. A., & Rose, A. K. (1998). The endogeneity of the optimum currency area criteria. The Economic Journal, 108(449), 1009-1025. DOI: 10.1111/1468-0297.00327.
Furceri, D., Hannan, S. A., Ostry, J. D., & Rose, A. K. (2019). Macroeconomic Consequences of Tariffs. IMF Working Paper WP/19/9. DOI: 10.3386/w25402.
Harmonized Commodity Description and Coding Systems (HS). UN trade Statistics. Retrieved from: https://unstats.un.org/unsd/tradekb/Knowledgebase/50018/Harmonized-Commodity-Description-and-Coding-Systems-HS.
Ibrahim, S. G., & Benjamin, M. U. (2019). US-China Trade War: Making America Great Again or a Symbolic Decline of an Empire? African Journal of Economics and Sustainable Development, 2(2), 39 – 55.
Irwin, D. A. (2014). Tariff Incidence: Evidence from US Sugar Duties, 1890-1930 (No. w20635). National Bureau of Economic Research.
Jammes, J., & Olareagga, M. (2005). Explaining SMART and GSIM. World Bank: Mimeo.
Kawasaki, K. (2018). Economic Impact of Tariff Hikes. A CGE Model Analysis. National Graduate Institute for Policy Studies. Discussion Paper 18-05. Retrieved from: https://grips.repo.nii.ac.jp/?action=repository_action_common_download&item_id=1628&item_no=1&attribute_id=20&file_no=1.
Krugman, P. R., & Obstfeld, M. (2009). International economics: Theory and policy. Pearson Education.
Li, M. (2019). CARD Trade War Tariff Database. Center for Agriculture and Rural Development, Iowa State University. Retrieved from: https://www.card.iastate.edu/china/trade-war-data/ (accessed on 29th of March, 2020).
Li, M., Balistreri, E. J., & Zhang, W. (2019). The U.S. – China trade war: Tariff data and general equilibrium analysis. Journal of Asian Economics, 69, 101216. DOI: 10.1016/j.asieco.2020.101216.
Macera, A. P., & Divino, J. A. (2015). Import Tariff and Exchange Rate Transmission in a Small Open Economy. Emerging Markets Finance and Trade, 51, 61–79. DOI: 10.1080/1540496X.2015.1080556.
McKibbin, W., & Fernando, R. (2020). The Global Macroeconomic Impacts of COVID-19: Seven Scenarios. CAMA Working Paper No. 19/2020. DOI: 10.2139/ssrn.3547729.
Metzler, L. A. (1949). Tariffs, the terms of trade, and the distribution of national income. Journal of Political Economy, 57(1), 1-29. DOI: 10.1086/256766.
Mussa, M. (1974). A Monetary Approach to Balance of Payments Analysis. Journal of Money, Credit and Banking, August 1974, 6(3), 333 – 351. DOI: 10.2307/1991173.
Ostry, J. D., & Rose, A. K. (1992). An Empirical Evaluation of the Macroeconomic Effects of Tariffs. Journal of International Money and Finance (1992),11, 63-79. DOI: 10.1016/0261-5606(92)90021-O.
Oxford Economics. (2017). Understanding the US-China Trade Relationship. Prepared for the US-China Business Council. Retrieved from: https://www.uschina.org/sites/default/files/Oxford%20Economics%20US%20Jobs%20and%20China%20Trade%20Report.pdf.
Presidential Memorandum on the Actions by the United States Related to the Section 301 Investigation (March 22, 2018). Retrieved from: https://www.whitehouse.gov/presidential-actions/presidential-memorandum-actions-united-states-related-section-301-investigation/.
Razin, A., & Svensson, L.E.O (1983). Trade Taxes and the Current Account. Economics Letters, 13, 55 – 57. DOI: 10.1016/0165-1765(83)90011-3.
Reitz, S., & Slopek, U. D. (2005). Macroeconomic Effects of Tariffs: Insights from a New Open Economy Macroeconomic Model. Schweizerische Zeitschrift für Volkswirtschaft und Statistik,.141(2), 285-311. Retrieved from http://www.sjes.ch/papers/2005-II-5.pdf.
Rosyadi, S. A., & Widodo, T. (2018). Impact of Donald Trump’s tariff increase against Chinese imports on global economy: Global Trade Analysis Project (GTAP) model. Journal of Chinese Economic and Business Studies, 16(2), 125–145. DOI: 10.1080/14765284.2018.1427930.
Smith, A. (1776). The Wealth of Nations. Edited by Edwin Cannan, 1904. Reprint. New York: Modern Library, 1937.
The United States and China Nominal GDP. Retrieved from: https://data.oecd.org/gdp/gross-domestic-product-gdp.htm#indicator-chart (accessed on 4thof September 2020).
The United States and China trade flows for trade intensity calculations. Retrieved from: https://data.imf.org/?sk=388DFA60-1D26-4ADE-B505-A05A558D9A42&sId=1479329132316 (accessed on 4thof September 2020).
The United States GDP deflator. Retrieved from: https://data.imf.org/regular.aspx?key=61545852 (accessed on 25th of October 2020).
The United States Real GDP. Retrieved from: https://apps.bea.gov/iTable/iTable.cfm?reqid=19&step=2#reqid=19&step=2&isuri=1&1921=survey (accessed on 27th of June, 2020).
The United States Real GDP forecast for 2020. World Economic Outlook Update, June 2020. Retrieved from: https://www.imf.org/en/Publications/WEO/Issues/2020/06/24/WEOUpdateJune2020.
The United States Trade Balance with World and China. Retrieved from: https://www.bea.gov/data/intl-trade-investment/international-trade-goods-and-services (accessed on 25th of October, 2020).
The US Business Cycle Expansions and Contractions. The National Bureau of Economic Research (NBER). Retrieved from: https://www.nber.org/cycles.html (accessed on 27th of June 2020).
Thu, V. T., Hoa, L. Q., & Hang, H. T. (2018). Effects of EVFTA on Vietnam’s apparel exports: An application of WITS-SMART simulation model. Journal of Asian Business and Economic Studies, 25, special issue 02, 04-28.
Tu, X., Du, Y., Lu, Y., & Lou, C. (2020). US-China Trade War: Is Winter Coming for Global Trade? Journal of Chinese Political Science. DOI: 10.1007/s11366-020-09659-7.
World Integrated Trade Solution (WITS) software database information on tariffs. Retrieved from: https://wits.worldbank.org/wits/wits/witshelp/Content/Data_Retrieval/P/Intro/C2.Background_on_Trade_Policy.htm.
World Trade Organization (2005). Understanding the WTO (3rd ed.). Retrieved from: https://www.wto.org/english/thewto_e/whatis_e/tif_e/understanding_e.doc.
APPENDICES
Appendix A
Harmonized System (HS2) product categories
|
HS2 |
Product categories |
HS2 |
Product categories |
|
01-05 |
Animal & Animal Products |
50-63 |
Textiles |
|
06-15 |
Vegetable Products |
64-67 |
Footwear / Headgear |
|
16-24 |
Prepared Foodstuffs |
68-71 |
Stone / Glass |
|
25-27 |
Mineral Products |
72-83 |
Metals |
|
28-38 |
Chemicals & Allied Industries |
84-85 |
Machinery / Electrical |
|
39-40 |
Plastics / Rubbers |
86-89 |
Transport Equipment |
|
41-43 |
Raw Hides, Skins, Leather, & Furs |
90-97 |
Miscellaneous (medical instruments, arms and ammunition, furniture, toys, works of art, etc.) |
|
44-49 |
Wood & Wood Products |
Source: compiled by authors, according to Harmonized Systems 2017 description presented in the UN Trade Statistics website.
Appendix B
The model output for the Trade war scenario (in thousands of USD)
|
Product |
Trade diversion from China |
US imports from China |
US exports to China |
Trade balance with China |
Welfare |
|||||
|
Animal & Animal Products |
268,900 |
0.61% |
-766,032 |
0.71% |
-159,629 |
0.67% |
606,402 |
0.72% |
-29,559 |
1.35% |
|
Chemicals & Allied Industries |
1,721,716 |
3.93% |
-4,158,034 |
3.83% |
1,038,063 |
-4.39% |
5,196,096 |
6.13% |
-94,298 |
4.30% |
|
Foodstuffs |
389,213 |
0.89% |
-800,328 |
0.74% |
-2,089,189 |
8.83% |
-1,288,861 |
-1.52% |
-15,380 |
0.70% |
|
Footwear / Headgear |
688,315 |
1.57% |
-1,952,965 |
1.80% |
-61,402 |
0.26% |
1,891,563 |
2.23% |
-74,077 |
3.38% |
|
Machinery / Electrical |
19,902,644 |
45.46% |
-45,894,726 |
42.32% |
-2,944,410 |
12.44% |
42,950,316 |
50.65% |
-575,179 |
26.23% |
|
Metals |
3,236,708 |
7.39% |
-9,067,614 |
8.36% |
-1,174,336 |
4.96% |
7,893,278 |
9.31% |
-167,167 |
7.62% |
|
Mineral Products |
124,673 |
0.28% |
-315,833 |
0.29% |
-540,092 |
2.28% |
-224,258 |
-0.26% |
-5,707 |
0.26% |
|
Miscellaneous |
5,935,357 |
13.56% |
-14,129,402 |
13.03% |
-1,246,242 |
5.27% |
12,883,161 |
15.19% |
-343,744 |
15.68% |
|
Plastics / Rubbers |
2,304,735 |
5.26% |
-7,030,268 |
6.48% |
759,085 |
-3.21% |
7,789,353 |
9.19% |
-241,264 |
11.00% |
|
Raw Hides, Skins, Leather, & Furs |
860,391 |
1.97% |
-2,218,253 |
2.05% |
-73,713 |
0.31% |
2,144,539 |
2.53% |
-116,838 |
5.33% |
|
Stone / Glass |
977,512 |
2.23% |
-3,093,063 |
2.85% |
-257,087 |
1.09% |
2,835,976 |
3.34% |
-76,728 |
3.50% |
|
Textiles |
2,393,209 |
5.47% |
-6,895,839 |
6.36% |
-104,279 |
0.44% |
6,791,559 |
8.01% |
-258,485 |
11.79% |
|
Transportation |
3,983,717 |
9.10% |
-8,008,579 |
7.38% |
-6,384,090 |
26.98% |
1,624,489 |
1.92% |
-120,804 |
5.51% |
|
Vegetable Products |
176,710 |
0.40% |
-470,868 |
0.43% |
-9,466,951 |
40.01% |
-8,996,083 |
-10.61% |
-6,831 |
0.31% |
|
Wood & Wood Products |
812,905 |
1.86% |
-3,655,894 |
3.37% |
-956,282 |
4.04% |
2,699,612 |
3.18% |
-66,582 |
3.04% |
|
TOTAL |
43,776,706 |
100% |
-108,457,697 |
100% |
-23,660,554 |
100% |
84,797,143 |
100% |
-2,192,644 |
100% |
Source: compiled by authors, based on SMART model simulations.
Appendix C
The model output for the COVID-19 scenario (in thousands of USD)
Optimistic case (-5%)
|
Product |
Trade diversion from China |
US imports from China |
US exports to China |
Trade balance with China |
Welfare |
|||||
|
Animal & Animal Products |
255,455 |
0.61% |
-727,730 |
0.71% |
-151,648 |
0.67% |
576,082 |
0.71% |
-28,081 |
1.39% |
|
Chemicals & Allied Industries |
6,627,026 |
15.86% |
-17,276,810 |
16.74% |
986,159 |
-4.39% |
18,262,970 |
22.62% |
-213,417 |
10.58% |
|
Foodstuffs |
59,724 |
0.14% |
-190,950 |
0.18% |
-1,984,729 |
8.83% |
-1,793,779 |
-2.22% |
-782 |
0.04% |
|
Footwear / Headgear |
33,999 |
0.08% |
-87,227 |
0.08% |
-58,332 |
0.26% |
28,895 |
0.04% |
-821 |
0.04% |
|
Machinery / Electrical |
2,062,063 |
4.94% |
-7,451,890 |
7.22% |
-2,797,183 |
12.44% |
4,654,707 |
5.76% |
-209,377 |
10.38% |
|
Metals |
3,339,301 |
7.99% |
-9,299,409 |
9.01% |
-1,115,619 |
4.96% |
8,183,790 |
10.14% |
-270,318 |
13.40% |
|
Mineral Products |
1,055,148 |
2.53% |
-3,049,247 |
2.95% |
-513,087 |
2.28% |
2,536,159 |
3.14% |
-38,584 |
1.91% |
|
Miscellaneous |
2,682,154 |
6.42% |
-6,926,918 |
6.71% |
-1,183,929 |
5.27% |
5,742,989 |
7.11% |
-228,898 |
11.35% |
|
Plastics / Rubbers |
6,547,624 |
15.67% |
-14,289,314 |
13.84% |
721,130 |
-3.21% |
15,010,444 |
18.59% |
-182,373 |
9.04% |
|
Raw Hides, Skins, Leather, & Furs |
2,400,294 |
5.75% |
-5,749,041 |
5.57% |
-70,026 |
0.31% |
5,679,015 |
7.03% |
-119,948 |
5.95% |
|
Stone / Glass |
324,473 |
0.78% |
-925,240 |
0.90% |
-244,233 |
1.09% |
681,008 |
0.84% |
-23,890 |
1.18% |
|
Textiles |
6,695,865 |
16.03% |
-15,843,759 |
15.35% |
-99,066 |
0.44% |
15,744,693 |
19.50% |
-366,575 |
18.18% |
|
Transportation |
310,009 |
0.74% |
-844,137 |
0.82% |
-6,064,868 |
26.98% |
-5,220,731 |
-6.47% |
-36,887 |
1.83% |
|
Vegetable Products |
653,896 |
1.57% |
-2,143,995 |
2.08% |
-8,993,603 |
40.01% |
-6,849,608 |
-8.48% |
-49,467 |
2.45% |
|
Wood & Wood Products |
8,729,604 |
20.90% |
-18,417,908 |
17.84% |
-908,468 |
4.04% |
17,509,439 |
21.68% |
-247,329 |
12.26% |
|
TOTAL |
41,776,634 |
100% |
-103,223,575 |
100% |
-22,477,503 |
100% |
80,746,072 |
100% |
-2,016,747 |
100% |
Source: compiled by authors, based on SMART model simulations.
Mild case (-10%)
|
Product |
Trade diversion from China |
US imports from China |
US exports to China |
Trade balance with China |
Welfare |
|||||
|
Animal & Animal Products |
242,010 |
0.61% |
-689,428 |
0.71% |
-106,924 |
0.51% |
582,504 |
0.76% |
-26,603 |
1.39% |
|
Chemicals & Allied Industries |
1,571,764 |
3.97% |
-3,764,450 |
3.85% |
-1,287,544 |
6.12% |
2,476,906 |
3.23% |
-76,844 |
4.02% |
|
Foodstuffs |
355,438 |
0.90% |
-725,441 |
0.74% |
-2,063,234 |
9.81% |
-1,337,793 |
-1.74% |
-10,394 |
0.54% |
|
Footwear / Headgear |
654,085 |
1.65% |
-1,792,271 |
1.83% |
-66,164 |
0.31% |
1,726,107 |
2.25% |
-62,462 |
3.27% |
|
Machinery / Electrical |
17,912,380 |
45.26% |
-41,305,253 |
42.24% |
-497,879 |
2.37% |
40,807,374 |
53.17% |
-517,661 |
27.09% |
|
Metals |
2,913,037 |
7.36% |
-8,160,852 |
8.35% |
-597,629 |
2.84% |
7,563,224 |
9.85% |
-150,451 |
7.87% |
|
Mineral Products |
112,223 |
0.28% |
-284,266 |
0.29% |
-530,245 |
2.52% |
-245,978 |
-0.32% |
-5,131 |
0.27% |
|
Miscellaneous |
5,341,821 |
13.50% |
-12,716,462 |
13.00% |
234,100 |
-1.11% |
12,950,562 |
16.87% |
-309,369 |
16.19% |
|
Plastics / Rubbers |
2,097,744 |
5.30% |
-6,350,723 |
6.49% |
-694,537 |
3.30% |
5,656,186 |
7.37% |
-207,381 |
10.85% |
|
Raw Hides, Skins, Leather, & Furs |
786,014 |
1.99% |
-2,008,089 |
2.05% |
-247,999 |
1.18% |
1,760,090 |
2.29% |
-97,652 |
5.11% |
|
Stone / Glass |
883,997 |
2.23% |
-2,787,993 |
2.85% |
-210,388 |
1.00% |
2,577,605 |
3.36% |
-65,361 |
3.42% |
|
Textiles |
2,228,630 |
5.63% |
-6,280,996 |
6.42% |
-489,738 |
2.33% |
5,791,258 |
7.55% |
-208,197 |
10.90% |
|
Transportation |
3,585,345 |
9.06% |
-7,207,722 |
7.37% |
-4,931,226 |
23.44% |
2,276,496 |
2.97% |
-108,724 |
5.69% |
|
Vegetable Products |
159,712 |
0.40% |
-424,455 |
0.43% |
-8,585,310 |
40.80% |
-8,160,855 |
-10.63% |
-5,582 |
0.29% |
|
Wood & Wood Products |
733,663 |
1.85% |
-3,292,353 |
3.37% |
-966,618 |
4.59% |
2,325,735 |
3.03% |
-58,789 |
3.08% |
|
TOTAL |
39,577,863 |
100% |
-97,790,755 |
100% |
-21,041,334 |
100% |
76,749,422 |
100% |
-1,910,603 |
100% |
Source: compiled by authors, based on SMART model simulations.
Downside case (-15%)
|
Product |
Trade diversion from China |
US imports from China |
US exports to China |
Trade balance with China |
Welfare |
|||||
|
Animal & Animal Products |
142,419 |
0.38% |
-397,465 |
0.43% |
-135,685 |
0.67% |
261,780 |
0.37% |
-6,741 |
0.38% |
|
Chemicals & Allied Industries |
3,800,466 |
10.23% |
-10,448,684 |
11.40% |
882,353 |
-4.39% |
11,331,036 |
15.84% |
-346,312 |
19.53% |
|
Foodstuffs |
218,747 |
0.59% |
-564,761 |
0.62% |
-1,775,812 |
8.83% |
-1,211,051 |
-1.69% |
-9,180 |
0.52% |
|
Footwear / Headgear |
37,015 |
0.10% |
-107,020 |
0.12% |
-52,192 |
0.26% |
54,827 |
0.08% |
-2,867 |
0.16% |
|
Machinery / Electrical |
16,831,752 |
45.32% |
-38,613,698 |
42.13% |
-2,502,741 |
12.44% |
36,110,957 |
50.48% |
-460,317 |
25.96% |
|
Metals |
2,758,286 |
7.43% |
-7,676,799 |
8.38% |
-998,186 |
4.96% |
6,678,613 |
9.34% |
-134,461 |
7.58% |
|
Mineral Products |
125,540 |
0.34% |
-361,105 |
0.39% |
-459,078 |
2.28% |
-97,973 |
-0.14% |
-11,580 |
0.65% |
|
Miscellaneous |
5,020,939 |
13.52% |
-11,899,560 |
12.98% |
-1,059,306 |
5.27% |
10,840,255 |
15.15% |
-285,612 |
16.11% |
|
Plastics / Rubbers |
512,103 |
1.38% |
-2,535,918 |
2.77% |
645,223 |
-3.21% |
3,181,140 |
4.45% |
-49,033 |
2.77% |
|
Raw Hides, Skins, Leather, & Furs |
190,669 |
0.51% |
-598,836 |
0.65% |
-62,655 |
0.31% |
536,181 |
0.75% |
-7,077 |
0.40% |
|
Stone / Glass |
544,980 |
1.47% |
-1,770,590 |
1.93% |
-218,524 |
1.09% |
1,552,067 |
2.17% |
-35,923 |
2.03% |
|
Textiles |
3,078,006 |
8.29% |
-8,683,236 |
9.47% |
-88,638 |
0.44% |
8,594,598 |
12.01% |
-302,396 |
17.05% |
|
Transportation |
3,416,306 |
9.20% |
-6,836,119 |
7.46% |
-5,426,402 |
26.98% |
1,409,717 |
1.97% |
-92,327 |
5.21% |
|
Vegetable Products |
363,095 |
0.98% |
-726,528 |
0.79% |
-8,046,909 |
40.01% |
-7,320,381 |
-10.23% |
-11,939 |
0.67% |
|
Wood & Wood Products |
98,187 |
0.26% |
-429,401 |
0.47% |
-812,841 |
4.04% |
-383,440 |
-0.54% |
-17,537 |
0.99% |
|
TOTAL |
37,138,511 |
100% |
-91,649,721 |
100% |
-20,111,393 |
100% |
71,538,327 |
100% |
-1,773,301 |
100% |
Source: compiled by authors, based on SMART model simulations.
1 List 4A consists of 3,230 Harmonized Tariff Schedule of the US (HTSUS) subheadings, mainly iron and steel products, consumer electronics, motor vehicle products, telecommunications equipment, beverages, chemicals, clothing, and footwear.
2 List 4B consists of 540 HTSUS subheadings, mainly clothing, toys, chemicals, cell phones, laptop computers, small appliances, watches, and sports equipment.