Organizations and Markets in Emerging Economies ISSN 2029-4581 eISSN 2345-0037
2021, vol. 12, no. 1(23), pp. 131–159 DOI: https://doi.org/10.15388/omee.2021.12.51
Indian Stock Market during the COVID-19 Pandemic: Vulnerable or Resilient?: Sectoral analysis
Rishika Shankar
Faculty of Management Studies, University of Delhi, India
rishikashankar.17@fms.edu
https://orcid.org/0000-0001-9279-0561
Priti Dubey (corresponding author)
Faculty of Management Studies, University of Delhi, India
pritidubey.17@fms.edu
https://orcid.org/0000-0002-3077-2074
Abstract. This study examines the impact of COVID-19 pandemic on the performance of Indian stock market, measured by daily average returns and trading volume. The analysis is aimed at discovering the vulnerability of the general market as well as nine crucial sectors to the pandemic while also checking the impact on overall volatility in the market. The findings suggest that all the sectors followed a consistent pattern of being significantly impacted by the pandemic. However, the benchmark index remained resilient in the context of average returns. The entire market witnessed decreased returns and increased liquidity, which is explained by reduced volatility in the market.
Keywords: average returns, COVID-19, Indian stock market, trading volume
Received: 19/9/2020. Accepted: 24/2/2021
Copyright © 2021 Rishika Shankar, Priti Dubey. Published by Vilnius University Press. This is an Open Access article distributed under the terms of the Creative Commons Attribution Licence, which permits unrestricted use, distribution, and reproduction in any medium, provided the original author and source are credited.
Introduction
COVID-19 is a game changing factor for all countries, be it the world’s superpower, the United States of America or the next in line for the title, China. COVID-19 was declared a pandemic by the World Health Organisation (WHO) on March 11, 2020. Since the inception of the pandemic COVID-19, all economies have been fully or partially shut down, and citizens have been forced into lockdown for months, deteriorating national income, employment rate and overall industry production of developing as well as developed countries. Even the most secure country in terms of health and sanitisation, Italy, has not been left out of the declining economic trends due to the ongoing pandemic (Reuters, 2020). Amidst all the chaos of economic, social and political meltdown, global financial markets have not been left unaffected (He at al., 2020; Liu et al., 2020b). The stock markets witnessed immediate fall in prices and sky-rocketing volatilities when the pandemic hit the countries (Baker et al., 2020). While the COVID-19 hit the developed economies most in the beginning, the emerging economies such as India, Brazil, Peru and Mexico were hit severely in the second wave of the pandemic. The developing countries witnessed a severe impact on their economic activities due to partial lockdowns and thus, on the financial markets. It was also seen in many countries that some sectors were performing contrarily better than other hard hit sectors such as Pharmaceuticals and Postal Services.
In crisis-like situations such as pandemics, the financial performance of the stock market is expected to deteriorate due to public fears of declining economic activity, reduced disposable income and investors’ negative sentiments. The general market benchmark reflects these effects in the form of reduced liquidity as well as returns. On the other hand, sectoral performance may vary from the benchmark index owing to industrial differences and difference in reaction to the macro economic stimulus. Hence, different industries can show either momentum or contrarian effects. Based on the theoretical underpinnings, the paper tests the hypothesis of declining stock market performance of crucial sectors in Indian economy as a result of the COVID-19 pandemic. Further, on the basis of performance analysis, it is seen which sectors follow contrarian and momentum effect. Therefore, this paper explores the performance measurement analysis during the COVID-19 pandemic. The analysis is aimed at studying the performance of the general market and examining which sectors have seen significant change in their market performance during the pandemic and which sectors have not witnessed any significant difference. Nine individual sectors have been studied along with the volatility index and benchmark NIFTY index. The performance measurements are three-fold, namely, stock returns, stock trading volume and equity market volatility. Such analysis can provide investors with additional information to formulate profitable investment strategies during crisis-like situations. It can also act as an indicator of relative distress in various sectors which can further aid policy formulation in crisis-like scenarios.
COVID-19 has turned out to be a critical event for the world, making it imperative to understand the influence of this event on global stock markets. This paper expands the research on COVID-19 by presenting a comprehensive study of how COVID-19 has altered the performance of the stock market in India and how the impact of important determinants of market return and volume has changed as a result of this pandemic. It explores the heterogeneity across the performance of sectors in terms of returns and volume while also incorporating the effect of VIX on the sectors in the presence of a global pandemic. The study highlights the sectors which have moved with the broad market index and those which have shown resilience to the pandemic. The analysis can guide investors in understanding market movements while also assisting them in formulating trading strategies. This study helps us understand how India market behaves when a pandemic hits it. It is a novel study, which addresses the issue of the impact of COVID-19 on Indian financial market sector-wise. The study revolves around a detailed analysis of the impact of the pandemic on the general market as well as important sectors of the economy. Using more than a single variable helps in deriving better and more robust conclusions from the paper. Other than using multiple variables for analysis, the methodology employed is also two-fold such that the results remain consistent from non-parametric as well as parametric tests. The equations are modelled in a manner that the results are homoscedastic and suffer neither from specification bias nor auto-correlation.
In our pursuit of literature survey, we found very few papers in the Indian context which had studied the consequences and effects of the COVID-19 pandemic. No study has focused on comparing the impact of COVID-19 between sectors and the overall market. Moreover, we could not come across any study that documents the effect of COVID-19 on stock market returns as well as volume that incorporates other important variables (VIX, oil, exchange rate, Foreign Portfolio Investment, S&P returns and bond yields) in the empirical models. This paper undertakes a more comprehensive empirical analysis to understand the impact of COVID-19 on stock market returns and volume while also observing how VIX, oil, exchange rate, Foreign Portfolio Investment, S&P returns and bond yields affect the returns and volume in the Indian context. The analysis is done for the broad market as well as for the sectors for a relatively longer time frame of 12 months. While several papers have analysed the impact of the COVID-19 pandemic on the stock market performance, this study has tried to elaborate the impact sector-wise. The effect seen in the stock market has not been studied by taking each sector in isolation. This study also tries to understand whether the sectors follow contrarian effect or show similar effects as the benchmark index of the market. This paper has studied the stock performances of nine different sectors along with the market benchmark by capturing trading volume and average returns of the stocks to conclude the impact of COVID-19. Furthermore, it has included the volatility index, which is a proxy for investors’ sentiments in a market. Its analysis has helped us understand how the investors’ sentiments and fears during the pandemic shaped the Indian stock market performance. Overall, the paper has marked a robust conclusion regarding the COVID-19 impact on different sectors and overall market in Indian economy.
The paper is categorized into four sections. Section I discusses the literature review of the impact of COVID-19 on the financial market. Section II enlists data and methodology used in the analysis. In section III, we describe the trends of the data set studied and portray results and their analysis. In section IV, we conclude the findings of the paper.
1. Literature Review
Various studies have come to surface concerning the impact of the pandemic on the advanced as well as emerging economies since COVID-19 has penetrated every country in such a short span of time. Baker et al. (2020) has provided that the pandemic has contributed to an economic crisis globally. It led to slumped prices and spiked volatilities in the US stock market. Daube (2020) and Dev and Sengupta (2020) have explained that the financial markets were already toxic, and introduction of COVID-19 in the market gave the price slumps a greater push thus leading to stock market crashes across nations. Such a crisis-like situation can lead to unexpected movements in the stock market, thereby challenging the conventional relationships among variables. This gives us the motivation to study the impact of the pandemic on market return and volume. Some studies have explored the relationship between COVID-19 and stock markets (Phan & Narayan, 2020) and some have also studied industrial response to the pandemic (Xiong et al., 2020). The effect of COVID-19 on stock market volatility has also been documented (Chen at al., 2020). He et al. (2020c) examined the effect of COVID-19 on stock returns in China, Italy, South Korea, France, Spain, Germany, Japan and USA. Their results imply that the financial markets witnessed negative returns due to COVID-19, and there were also bi-directional spill-over effects across nations. The stock markets in all the countries analyzed fell immediately after the pandemic hit global world (Ali et al., 2020; Liu et al., 2020b). Asian countries faced worse effects of the pandemic than advanced economies (Liu et al., 2020b; Topcu & Gulal, 2020). Negative investor sentiment caused by the virus acted as a transmission channel leading to deterioration in stock returns (Liu et al., 2020b). Ozili and Arun (2020) tested the effects of COVID-19 on the economic situations and Financial Sector performance in US, UK, Japan and South Africa. Their results show that lockdown days, monetary policy decisions and international travel restrictions significantly contributed to price change in stock markets of all the countries studied. Gormsen and Koijen (2020) investigated the impact of COVID-19 on economy growth and stock prices, and found that the impact is negative on stock dividends. However, the dividend performance improved when the economic stimulus package was introduced by the government. Studies find that the stock market responded quickly to the COVID-19 outbreak, and the returns declined significantly with the news and increasing number of COVID-19 cases (Ashraf, 2020; Mishra et al., 2020; Yilmazkudey, 2020). Barro et al. (2020), on the other hand, found that stock market returns declined significantly because of the flu related deaths in 48 countries. Contrary to many of the results, some papers show a positive relationship between COVID-19 and stock returns (Liu et al., 2020c; Prabheesh et al., 2020).
Results by Topcu and Gulal (2020) indicate that the pandemic had a negative effect on stock markets until April 10. When the time period is extended further, the impact of COVID-19 becomes insignificant. Using different measures representing the COVID-19 pandemic, Alber (2020) investigated how the stock markets of six worst affected countries react to the pandemic, and the results indicate that stock market return showed more sensitivity to coronavirus cases rather than deaths while also being more impacted by cumulative cases than the new ones. On a different note, Ortmann et al. (2020) focused on retail investor reaction to the COVID-19 pandemic. Regression analysis exposes that when the number of COVID-19 cases doubled, the trading intensity of investors jumped by 13.9%. Brokerage deposits by investors also increased along with the number of new accounts as the pandemic unfolded. However, a fall in the Dow Jones Industrial Average and FTSE indices increased investor fear, which prompted them to avert risk by reducing the use of leverage.
In March 2020, National Stock Exchange (NSE) and Bombay Stock Exchange (BSE) lost 23% market capitalisation of listed companies each. Overall, the financial market saw continuous decline in stock prices in the month of March 2020. In agreement to these declining trends of Indian stock market, Singh and Neog (2020) enlisted the trend of Sensex and NIFTY, in which it is seen that the decline is more rapid after the first week of March 2020. They also showed that the Financial, Real Estate and Banking sector faced nearly complete disruption owing to estimated loss of 2.81 lakh crore. Alam et al. (2020) investigated the impact of COVID-19 lockdown period on the stock market in India. Their findings imply that during the pandemic pre-lockdown, the public panicked, and abnormal returns declined due to fear. However, during the lockdown, the public gained trust, which was reflected in the positive and significant abnormal returns.
Donadelli et al. (2016) found that during the times of disease-related news (DRNs), investor sentiments turn positive towards pharmaceuticals companies, which improves the returns of pharmaceuticals stocks. Fu and Shen (2020) examined the corporate performance of the Energy sector during COVID-19 and found negative impact on energy companies’ performance. Mazur et al. (2021) conducted the analysis across various sectors and found that natural gas, food, healthcare and software are the winning sectors in terms of increased returns while petroleum, real estate, entertainment and hospitality are the loser stocks. He et al. (2020b) studied industry-wise impact of the pandemic in China and found that four out of eight industries studied have remained resilient, while other four industries have been adversely affected by the pandemic.
Studies have found significant negative impact of COVID-19 on the performance of energy companies (Fun & Shen, 2020; Polemis & Soursou, 2020). Similarly, various studies have examined the COVID-19 impact on oil market also and found a negative impact (Qin et al., 2020). However, contradictory results are also seen on the crude oil market and US stock market suggesting that COVID-19 had a significant positive impact on returns of both the markets (Iyke, 2020a; Liu et al., 2020c; Narayan, 2020c). It is witnessed that during the COVID-19 period, the oil price volatility significantly increased (Devpura & Narayan, 2020; Salisu & Adediran, 2020). Huang and Zheng (2020), on the other hand, found that the elasticity of crude oil futures price decline further post COVID-19 as compared to pre-COVID-19 period. Findings of Prabheesh et al. (2020) offer that during the pandemic, stock market and oil prices follow a co-movement. Narayan (2020b) has found that COVID-19 has significantly impacted the nature of shock resistance by exchange rate. On the other hand, some studies have found that the exchange rate market became inefficient during the COVID-19 period (Narayan, 2020a). Devpura (2020) found that oil prices do not play any significant role in predicting Japanese Yen during the COVID-19 period.
Salisu and Sikiru (2020) have shown that Asia-Pacific Islamic stocks have proven to be an efficient hedge against uncertainty arisen due to the COVID-19 pandemic. On examining the impact of uncertainty due to COVID-19, Iyke (2020b) also found that three out of five Asian economies remained resilient, while China and Korea had positive and significant impact. Gil-Alana and Claudia-Quiroga (2020) have also conducted an examination of Asian stock markets and their reaction to COVID-19. It was found that the shocks in Korean and Chinese stock markets are permanent whereas, in Korean market, the shocks are only temporary in nature. Sharma (2020) has shown that during COVID-19, the volatility of Asian region has significant relationship with the volatility of five individual developed countries of Asia. Yan and Qian (2020) have conducted an event study to establish that the stock prices of consumer industry declined significantly in the initial few days of the pandemic and recovered later in reaction to government policies. In the case of financial industry, the systematic risk rose significantly during the COVID-19 outbreak. The increase in systematic risk exceeded the risk faced by Banking and Insurance sectors (Lan et al., 2020). He et al. (2020a) in their paper conducted an event study analysis to measure the impact of the COVID-19 pandemic on different sectors of the stock market. However, they studied the impact on stock prices of Chinese companies. Interestingly, their results point at a contradictory behaviour of stock prices on two different stock exchanges. While the impact of COVID-19 on share prices was negative on the Shanghai stock exchange, the impact was positive on the Shenzen stock exchange. Zaremba et al. (2020) explored the impact of government policy responses to novel coronavirus on stock market volatility for 67 countries. They ran panel regression on five different measures of volatility and concluded that stock market volatility increases as a result of government interventions to tackle COVID-19. Phan and Narayan (2020) documented the contemporaneous response of stock markets of 25 countries to different events related to COVID-19 including WHO declaration, lockdown, stimulus package and travel ban. In a descriptive analysis, they found that stock markets over-react during the initial phases due to higher uncertainty. However, as more and more information is made available, the markets enter into a correction phase. Salisu and Akanni (2020) compiled a Global Fear Index for the COVID-19 pandemic, which was then applied to the data from OECD nations to predict stock market returns. The fear index performs well in predicting stock returns during the pandemic. Using google search trends, Chen et al. (2020) created a proxy for coronavirus fear sentiment with the objective of measuring the influence of COVID-19 on stock market volatility represented by VIX while also studying the fluctuations in Bitcoin returns and volume. Vector autoregressive model results conclude a significant and positive effect of fear sentiment on VIX as well as on Bitcoin trading volume. However, Bitcoin returns experience a negative and significant effect of coronavirus. Looking into the liquidity of financial markets of 23 emerging market economies, Haroon and Rizvi (2020) concluded a deteriorating impact of increasing number of confirmed coronavirus cases on market liquidity. Besides, as the curve of COVID-19 related deaths flattens, the equity markets witness improved liquidity. Government policy intervention to control the pandemic also results in better market liquidity as it alleviates the uncertainty among investors. Han and Qian (2020) conducted a study to research the impact of COVID-19 on the innovation ability of Chinese companies across different sectors. It was found that companies of all sectors showed increased innovation abilities in China during the pandemic. Appiah-Otoo (2020) found that the credit extended by banks in China to private sector has significantly increased after the COVID-19 pandemic.
Liu et al. (2020a) examined the resilience of Chinese economy to the COVID-19 pandemic using wavelet based techniques. The study discovered that Chinese economy is indeed better off than other economies when it comes to handling the pandemic because China has decoupled from the global economic cycle. Continuing the analysis on Chinese economy, Liu et al. (2020d) employed OLS regression on survey data to check the impact of the pandemic on household consumption. The results indicate a significantly negative effect of the pandemic on household consumption, especially on urban household vis-à-vis rural ones. Interestingly, the study also discovered that mobile payments promote consumption in urban households even during the pandemic. Shen et al. (2020) deduced that firm performance is negatively affected by the COVID-19 pandemic. They used financial data of listed Chinese companies and discovered that the negative effect is stronger in areas which are hit hard by the pandemic. They also documented a more serious impact of the pandemic on tourism, catering and transportation industries. In a similar study, Xiong et al. (2020) established a significant impact of COVID-19 on firms in specific industries including transportation, food and beverage retail, hotel and tourism, postal warehouse, real estate, video entertainment, and construction industries. Firm-specific characteristics and financial condition of the firms play a significant role in determining a firm’s response to COVID-19.
Narayan et al. (2020) employed a GARCH model to check the impact of exchange rate on stock market returns in Japan using daily data for Japanese Yen-US Dollar exchange rate and Nikkei returns during the COVID-19 pandemic. They found that the relationship between exchange rates and stock returns holds such that one standard deviation depreciation of Yen leads to a 71% rise in stock market returns. Interestingly, the increase in stock market returns was found to lie between 24% and 49% during the pre-COVID-19 period. Thus, exchange rate displays a stronger influence on market return during the COVID-19 period. Using a Difference-in-Difference methodology, Gu et al. (2020) checked the impact of COVID-19 pandemic on economic activity of firms in different sectors. While the overall economic activity of firms declined by 57%, manufacturing sector firms faced adverse impact of the pandemic. However, a positive reaction was witnessed by firms in other sectors including construction, information transfer, computer services and software, and health care and social work.
In the Indian context, Prabheesh (2020) looked at the relationship between FPI and stock market returns during the COVID-19 period. On examining the relationship by conducting the Granger causality test, it was found that FPI is significant in predicting stock returns in Indian market. This explained the decline in stock returns when FPIs were withdrawn from the market in the pandemic period. Aravind and Manojkrishnan (2020) tested the impact of the COVID-19 outbreak on the pharmaceutical sector in India. Their results signify that only two out of ten Pharma companies that they studied showed a trend against the benchmark index. Overall, the findings imply that Indian Pharma sector did not follow the expected contrarian effect.
2. Data and Methodology
The daily data in the analysis is indicative of sector-wise performance of the Indian stock market over a period of twelve months. The time period covers the activity in the market prior to the COVID-19 pandemic (08/07/2019 to 10/03/2020) as well as during the pandemic (11/03/2020 to 07/07/2020). The time period is divided into two sections from 11/03/2020, as it is the date when COVID-19 was declared a worldwide pandemic by WHO. Performance and liquidity of NIFTY 50, the broad market index of the National Stock Exchange (NSE)1 is used to measure the stock market activity, while the sectoral activity is measured by NIFTY sectoral indices. The sectors analyzed in the study are Automobile, Pharmaceuticals, Information Technology (IT), Fast Moving Consumer Goods (FMCG), Energy, Financial Services, Realty, Banking and Metal. The Volatility Index (VIX) is also studied to factor-in the overall volatility of the Indian stock market. The overall and sectoral stock market performance was gauged with average return, while market liquidity was measured with trading volume (Lei, 2005). Change in VIX represents the changes in volatility, and a dummy variable was introduced to account for COVID-19, which takes the value 1 in the presence of COVID-19, i.e., March 11th, 2020 onward, and 0 otherwise. Apart from the interest variables, namely, return, volume, volatility and COVID-19 dummy, relevant control variables were included in the analysis based on the availability of daily data. These include change in oil price, exchange rate growth, Foreign Portfolio Investment growth rate, S&P 500 return and growth in government bond-yield. The missing values in the data were replaced with the mean of the corresponding series (Peng & Lei, 2005). Table 1 gives the description of all the variables.
For a cursory look at the impact of the COVID-19 pandemic on stock market activity, the study draws on the mean comparison test. This test looks for a significant difference between the mean of the variables in different time periods, that is, before and during the COVID-19 pandemic. It indicates whether there is a significant increase or decrease in the mean return and volume of the indices in the COVID-19 period from the pre-COVID-19 period. For the purpose of applying this test, the data is sorted into two time series for every variable, the pre-COVID-19 series (19/11/2019 to 10/03/2020) and the COVID-19 series (11/03/2020 to 07/07/2020), consisting of 79 observations each.
Table 1. Description of Variables
|
Variable |
Variable |
Definition |
Source |
|
NR |
NIFTY Return |
The daily return* of NIFTY 50 index |
NSE |
|
NV |
Logged NIFTY Volume |
The daily trading volume** of NIFTY 50 index |
NSE |
|
Cov |
COVID-19 dummy |
The value is 1 for all days post 11/03/2020 and 0 otherwise |
- |
|
VIX |
Change in Volatility Index |
Daily Percentage change in the Volatility Index |
NSE |
|
AR |
Auto Return |
The daily return of NIFTY Auto index |
NSE |
|
AV |
Logged Auto Volume |
The daily trading volume of NIFTY Auto index |
NSE |
|
PR |
Pharmaceutical Return |
The daily return of NIFTY Pharma index |
NSE |
|
PV |
Logged Pharmaceutical Volume |
The daily trading volume of NIFTY Pharma index |
NSE |
|
IR |
IT Return |
The daily return of NIFTY IT index |
NSE |
|
IV |
Logged IT Volume |
The daily trading volume of NIFTY IT index |
NSE |
|
FR |
FMCG Return |
The daily return of NIFTY FMCG index |
NSE |
|
FV |
Logged FMCG Volume |
The daily trading volume of NIFTY FMCG index |
NSE |
|
ER |
Energy Return |
The daily return of NIFTY Energy index |
NSE |
|
EV |
Logged Energy Volume |
The daily trading volume of NIFTY Energy index |
NSE |
|
MR |
Metal Return |
The daily return of NIFTY Metal index |
NSE |
|
MV |
Logged Metal Volume |
The daily trading volume of NIFTY Metal index |
NSE |
|
FSR |
Financial Services Return |
The daily return of NIFTY Financial services index |
NSE |
|
FSV |
Logged Financial Service Volume |
The daily trading volume of NIFTY Financial services index |
NSE |
|
RR |
Realty Return |
The daily return of NIFTY Realty index |
NSE |
|
RV |
Logged Realty Volume |
The daily trading volume of NIFTY Realty index |
NSE |
|
BR |
Banking Return |
The daily return of NIFTY bank index |
NSE |
|
BV |
Logged Banking Volume |
The daily trading volume of NIFTY bank index |
NSE |
|
Oil |
Change in Oil Price |
Daily percentage change in Europe Brent Spot Price FOB ($/barrel) |
|
|
EX |
Growth in Exchange Rate |
Daily percentage change in INR-USD Exchange Rate (INR/USD) |
Yahoo Finance |
|
FPI |
Growth in Foreign Portfolio Investment |
Daily percentage change in Net FPI investment in equity (Rs. Crore) |
NSDL |
|
SP |
S&P Index Return |
The daily return of S&P 500 index |
Yahoo Finance |
|
BY |
Growth in Bond Yield |
Daily percentage change in 1-year Indian Government Bond Yield |
*Daily Return %= [(Pt – Pt-1)/ Pt-1]*100 where Pt is the current closing price, and Pt-1 is the previous day’s closing price. **Volume in INR
Aiming for a thorough investigation, the paper further employs Ordinary Least Squares (OLS) method of estimation to discover the associative relationship between the Indian stock market performance and the COVID-19 pandemic. Precisely, the analysis aims to unearth the effect of the Coronavirus pandemic on the return and volume of NIFTY 50 and NIFTY sectoral indices as well as on the fluctuations in VIX. A particular reason for employing time-series regression analysis as against panel data analysis is to appropriately account for the sector-specific factors. This method establishes a linear relationship between the dependent variable (index return or volume) and the independent variable (COVID-19 dummy), which can reveal whether the pandemic has any significant effect on the stock market. Studying each sector separately can take care of the sector specific factors. Though many studies (Liu et al., 2020b; Mirza et al., 2020) apply event study approach to COVID-19 research, this paper applies OLS regression in line with Ortmann et al. (2020) to analyse the impact of COVID-19 on stock market over a period of months.
This study follows a pattern while applying regressions to the data. Firstly, COVID-19 impact was examined on the performance of the broad market by regressing NIFTY 50 return on the COVID-19 dummy, logged NIFTY 50 volume, change in VIX and other control variables, represented by Equation 1.1 as follows:

Here, NRt is the dependent variable. Since today’s return is expected to be influenced by last period’s return, lag of the dependent variable, NRt– 1, is included as one of the regressors to avoid autocorrelation problem. NVt , Covt and VIXt are the main regressors, and ß1 , ß3 ʌ ß4 are their respective coefficients. Other variables are included to control for their impact on NRt. Interaction terms in the equation are indicative of the joint impact of two regressors on the regressand. On similar lines, COVID-19 effect on broad market liquidity was measured by regressing logged NIFTY-50 volume on COVID-19 dummy, NIFTY 50 return, change in VIX and control variables (Equation 2.1). Further, the analysis was repeated for each sector separately. Finally, the influence of COVID-19 was checked on VIX returns, using COVID-19 dummy, NIFTY 50 return and logged NIFTY 50 volume as independent variables (Equation 3.1). Table 2 enlists all the equations studied.
Table 2. Regression Equations

The analysis checks all the variables for stationarity by conducting the breakpoint unit root test using Augmented Dickey Fuller (ADF) statistic. Correlation coefficient between the independent variables is either low or moderate in all the cases, i.e., below 0.7 (Hinkle et al., 2003), which ensures the absence of multicollinearity in the regression models (Appendix 1). For diagnostic analysis, Breusch-Godfrey serial correlation LM test was conducted, which looks for autocorrelation in the data, while the Breush-Pagan-Godfrey test was applied to confirm the presence or absence of homoscedasticity in the variables. Further, Ramsey RESET test was conducted to check the model specification. Wherever applicable, robust estimations were made using heteroscedasticity-consistent (Huber-White) and heteroscedasticity and auto-correlation consistent (Newey & West, 1987) standard errors. For a better interpretation of the ‘fit’ of the regression models, graphs indicating residual versus fitted and actual values can be referred to in Appendix 2. Leverage Plots have also been included for each of the regression equations in Appendix 3 as a measure of indicating the stability of the models.
3. Empirical Results and Analysis
On conducting paired mean comparison t-test, it was found that after the news of COVID-19 being a pandemic was introduced in the market, the total trading volume of the stocks significantly increased in eight out of nine sectors analyzed. In one of the sectors, namely realty sector, the change is seen to be significant in trading volume after the pandemic but the direction of such change remains unknown. The trading volume of the market benchmark index, NIFTY-50, also increased after the pandemic was announced. Additionally, the analysis also found that the returns in all nine sectors changed significantly after the COVID-19 pandemic, however, the direction of change is not known. Similar findings are seen in the case of NIFTY-50 index wherein the change in returns before and during COVID-19 is significant. On comparing the mean returns before and during the pandemic, it was found that returns during COVID-19 are higher than the returns reaped before COVID-19 in eight sectors, namely, Metal, Financial Services, Bank, Energy, FMCG, IT, Pharmaceuticals and Auto. As opposed to these results, in the realty sector, the mean returns after COVID-19 decreased. In the case of NIFTY-50, the returns during COVID-19 increased as compared to pre- COVID-19 mean returns.
Moving forward with the analysis, we elaborate the general market impact and sector-wise impact of the COVID-19 pandemic and VIX change on the interest variables. To begin the analysis, we first tested for the stationarity of all the time series, and it was found that all variables used in the study are stationary at a level (Appendix 1, Table 3).
The results for Equation 1.1 (Table 4) indicate that the coefficient of COVID-19 is negative, and it has significant effect on NIFTY 50 return at the 10% significance level. COVID-19 also affects the market return in the presence of other explanatory variables. Change in VIX was found to have a significantly negative impact on NIFTY 50 return, while the interaction between VIX and COVID-19 is significant, implying a stronger impact of VIX change in the presence of COVID-19. Though the coefficient of S&P return alone is not significant, increase in S&P return leads to a positive change in NIFTY 50 return in the presence of COVID-19. Therefore, with change in VIX and S&P returns, COVID-19 has greater significant impact on the broad market return.
For Equation 2.1 (Table 4), the regression coefficients of the constant term and NIFTY 50 return were found to be significant along with the lag of NIFTY 50 volume, which was also found to have a positive and significant impact on the volume. The effect of COVID-19 on NIFTY 50 volume is positive as well as significant, indicating greater liquidity in the market during the pandemic vis-à-vis no pandemic. Among the control variables, increase in oil price change decreases the market volume but this effect is offset when oil price change interacts with COVID-19, wherein a rise in oil price change increases the market liquidity.
The Auto sector results (Table 5) indicate a strong impact of COVID-19 on returns as well as volume. Constant term is significant in both cases, and Auto volume shows a positive influence on Auto return. Auto return, on the other hand, shows a strongly positive impact on Auto volume. While the lag of return displays a negative impact on return, the lag of volume impacts the volume positively. Interestingly, presence of COVID-19 has a significantly negative effect on Auto return, when VIX and S&P return do not change. An appreciation in VIX change shows a decrease in Auto return, and this effect strengthens in the presence of COVID-19 as shown by the interaction. Change in oil price manifests a significantly positive influence on Auto return, and S&P return coefficient becomes significant when it interacts with COVID-19. Auto volume is affected positively with an increment in VIX change and COVID-19. Thus, Auto sector performance seems to have taken a hit during COVID-19 despite experiencing greater liquidity due to the same.
As far as the pharmaceutical industry is concerned, COVID-19 shows a significantly negative effect on NIFTY Pharma index return (Table 6). Pharma volume, on the contrary, experiences a significantly positive impact of COVID-19. Change in VIX is also found to be significant in predicting Pharma returns, exerting a negative impact. Though volume has an insignificant impact on return, in the presence of COVID-19, the impact of volume becomes significantly positive. The interaction between change in oil price and COVID-19 shows a significant and negative relationship with Pharma performance. Pharma volume is affected positively by its own lag, and the presence of COVID-19 improves the liquidity in this sector in isolation as well as with interaction with sector return, and also when change in VIX appreciates.
For NIFTY IT index (Table 7), the return is significantly lower during the COVID-19 pandemic, compared to the no pandemic situation. The coefficient of VIX is significant and negative, implying a fall in return when volatility increases. Moreover, in the presence of COVID-19, an increment in VIX change decreases the return further. The interaction between COVID-19 and IT volume shows a positive influence on return, while change in exchange rate is seen to reduce return when it interacts with COVID-19. Volume in the IT sector experiences a positive relationship with its own lag. The coefficient of COVID-19 is significant and positive, highlighting the increased level of liquidity in IT sector during the Coronavirus pandemic.
The impact of COVID-19 on FMCG return (Table 8) is significant and negative, while its impact on FMCG volume is significantly positive. The constant term is significant in both cases, and so are the respective lags in predicting the two variables. The coefficient of change in VIX shows a significantly negative influence on FMCG return. VIX shows further impact on return in the presence of COVID-19, intensifying the decline in return. On the liquidity front, change in VIX and FMCG return both have a positive and significant impact on FMCG volume.
The energy sector (Table 9) exhibits different results from most other sectors in terms of COVID-19 impact on NIFTY Energy return. Though the coefficient of COVID-19 is still negative, it is no longer significant in impacting Energy return. Energy return is negatively affected by its own lag as well as by change in VIX. In the presence of COVID-19, an appreciation in VIX change leads to a further reduction in return. Looking at the interaction term, the positive effect of oil price change is almost nullified by a negative impact in the presence of COVID-19. The liquidity in the energy sector witnesses a positive and significant influence of COVID-19. The direction of impact of Energy return and VIX change on Energy volume is positive. The constant term as well as volume’s own lag are significant in determining Energy volume, and both exhibit a positive impact.
COVID-19 shows a significant impact on NIFTY Metal index (Table 10) return as well as on its volume. The interaction terms are significant, indicating that the regressors exert a stronger impact on the metal sector returns during the COVID-19 pandemic. VIX change shows a significantly negative effect on Metal return, while the impact of VIX change on Metal volume is significant and positive. Change in oil price shows a positive relationship with Metal return while impacting the volume of this sector negatively. In the presence of COVID-19, the influence of oil price change reverses, as it exerts a negative pressure on Metal return and a positive impact on the volume. Further, the interaction term between COVID-19 and exchange rate change is significant, showing a negative impact of high magnitude on the return. COVID-19 also interacts with S&P return to cause a positive impact on Metal return.
Regression results of the Financial Services sector (Table 11) indicate a strong effect of COVID-19 on sector return as well as on volume. During COVID-19, Financial Services index experiences lower return relative to a no COVID-19 situation. The volume, on the other hand, sees a positive impact of COVID-19. The coefficient of the constant term is significant in both cases, while the lag shows significance only in the case of volume. Financial Services volume displays a positive and significant impact on return. The significant coefficient of Change in VIX indicates that an appreciation in VIX change causes sector return to fall. Volume in this sector witnesses a significant positive effect of sector return and insignificant effect due to change in VIX.
The Realty sector (Table 12) return goes through no significant impact from the sector volume or even its own lag. Interestingly, change in VIX is significant in determining the returns performance but insignificant in affecting liquidity in the Realty sector. The presence of COVID-19 has a significantly negative effect on Realty return, which is further significant when it interacts with VIX change as well as volume. Surprisingly, Realty volume sees no significant impact of COVID-19. Sector volume is not affected significantly by any of the control variables.
Regression results of the Banking sector (Table 13) indicate a significantly negative impact of COVID-19 on the returns. Though sector volume impact is not significant, its interaction with COVID-19 is significant with a positive coefficient. VIX change shows a significantly negative effect on sector return but not on sector volume, and in the presence of COVID-19, rise in VIX change pushes the return further downwards. VIX change is not significant in the case of Bank volume. The constant term is significant for Bank volume but not for Bank return. Bank volume is affected positively and significantly when there is a rise in bond yield change in the presence of COVID-19. Apart from the interaction term, Banking sector’s trading volume sees a significantly positive impact of Bank return and its own lag. No other regressor is significant in determining Banking sector liquidity.
Change in Volatility Index (Table 14) experiences a negative and significant impact of NIFTY return as well as the occurrence of COVID-19. In the presence of COVID-19, VIX change experiences a humongous decline. NIFTY volume and its interaction with COVID-19 is significantly positive. S&P return has a negative and significant impact on VIX change, but in the presence of COVID-19, this effect is negated as the coefficient becomes positive.
The overall analysis has been represented using forest plots in Figure 1 and Figure 2. The horizontal lines indicate the coefficients and the lower and upper 95% confidence intervals for each of the dependent variable. Horizontal lines to the left of 0 signal negative impact of COVID-19, while those towards the right indicate a positive impact. It is observed that the liquidity of equity stocks in NIFTY 50 index as well as the majority of the sectors, namely, Auto, Pharmaceuticals, IT, FMCG, Energy, Metal, Financial Services have been impacted significantly during the COVID-19 pandemic. The only sectors which remained unaffected during this time period are Banking and Realty. All the industries have shown consistent effects of COVID-19 on the liquidity, as all of them witnessed positive change in trading volume. The liquidity of Realty and Banking sectors, despite positive during the pandemic, was insignificant to the impact of the COVID-19.
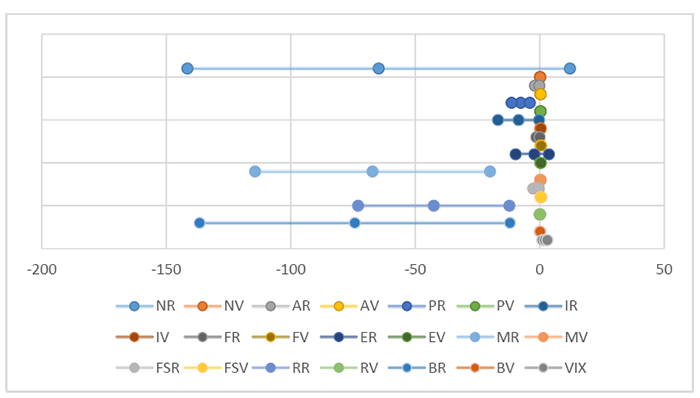
Figure 1. Forest Plot summarizing the impact of COVID-19 on sector return and volume
Financial performance of NIFTY 50 in the context of average returns saw no significant effect during COVID-19 at 5% significance level, and it seems to have remained resilient. However, COVID-19 impact is seen to be significant at the 10% significance level. As opposed to this, the majority of the sectors, namely, Banking, Realty, Financial Services, Metal, FMCG, IT, Pharmaceuticals and Auto showed significant negative impact on returns owing to the COVID-19 pandemic. Nevertheless, COVID-19 coefficient for Energy sector returns was negative, it was insignificant, which is in contradiction to the findings of Fun and Shen (2020) and Polemis and Soursou (2020). Therefore, only the Energy sector remained in line with NIFTY 50 as the pandemic did not decrease its returns significantly.
The insignificant impact of COVID-19 on NIFTY 50 return indicates that while most other markets have already seen a major dip in performance, the overall stock market return has shown resilience to the expected crisis induced by the worldwide pandemic. Most of the sectoral indices report a negative influence of COVID-19 on return as concluded by He et al. (2020b) for Shanghai stock exchange and a positive influence on volume, contradicting the findings of Haroon and Rizvi (2020), who documented a negative influence of COVID-19 on market liquidity. The sectors following this pattern of reduced returns and increased volume are Auto, Pharma, IT, FMCG, Metal and Financial Services. The return in these sectors has taken a hit due to COVID-19, highlighting bearish investor sentiment. This could be the consequence of reduced sales revenue of companies belonging to these sectors, especially in the case of Automobiles and Metal, as their demand can be delayed in times of uncertainty. Moreover, the manufacturing shut down has added to the woes. The inability of Pharma industry to come up with a convincing solution for the COVID-19 virus could be sending a negative signal to the investors. Though IT seems to be the ultimate hope for companies to continue their operations during the pandemic, this is not reflected in IT sector return during the initial phases of COVID-19. The demand for essential goods cannot be delayed, which is a good news for the FMCG sector but consumers can opt for lower price substitutes, and they may skip buying a lot of extra things, which ultimately reduces sales revenue of the companies. Thus, even this sector may witness lower return. Financial Services sector and Banking sector also experience negative return as consumer preferences shift towards essentials due to lower incomes. Similarly, demand for housing and land has become stagnant causing lower Realty sector return. Energy is the only sector where COVID-19 has not shown a significant negative impact on the return. Reduced energy demand due to economic shutdowns has led to a dramatic fall in oil prices, which may be seen as an opportunity by investors to take long positions in equity shares of Energy firms. This collective buying and bullish sentiment increases the price and improves the return. On the liquidity front, COVID-19 has increased the activity in the market, which can be a direct result of rising investor interest in equity. The market regulator, Securities and Exchange Board of India (SEBI) has provided various relaxations regarding rights issue, follow-on public offering, simplified pricing framework etc., which facilitated the fund raising process for firms while attracting new investors (The Asian Age, 2020). According to SEBI chairman, the participation of retail investors has increased during the COVID-19 lockdown and many new Demat accounts have also been created (The Asian Age, 2020). Besides, the 115 basis points Repo rate cut by the Reserve Bank of India has also shifted investor preference from fixed-income assets to equity (NDTV Profit, 2020). Only two sectors see no significant impact of COVID-19 on volume, i.e. Realty and Banking. Thus, no sector is completely resilient to the pandemic, despite the increased liquidity in the market. Surprisingly, VIX change sees a negative effect of COVID-19, contrary to the expectation that pandemic should increase volatility in the market.
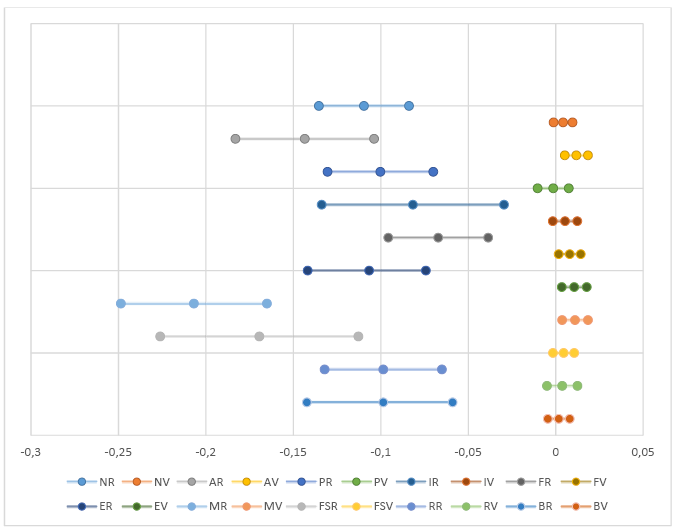
Figure 2. Forest Plot summarizing the impact of VIX on sector return and volume
The NIFTY 50 index remained resilient to COVID-19 pandemic, while sectoral returns were hit adversely because the NIFTY 50 index is composed of all the top performing firms across all the industries. This industrial diversification in NIFTY 50 index can reduce the negative effect of the pandemic. Sectoral indices comprise sector specific companies which can show a stronger and undiversified response (positive or negative) to the pandemic. While top performers of stock market can pull off good performance in a pandemic, the same cannot be said about the medium or slow growth firms which are present in the sectoral indices. Sectoral indices, thus, show significant impact of the pandemic, and the general benchmark index does not.
To sum up, the COVID-19 pandemic can heighten market’s uncertainty, which can make investors lose confidence in the market, pushing them to exit long positions. The selling pressure can decrease the prices and therefore, reduce market return. If we pay attention to average returns, NIFTY 50 experienced a decline, but the effect is insignificant. On the other hand, individual sectors ended up bearing the negative impact of pandemic significantly. However, these same sectors gained liquidity during this time and gave a hope of recovery to the investors. General market index did not stay behind either in gaining liquidity during the pandemic. Therefore, it can be concluded that all the sectors remained consistent with the benchmark index in respect to liquidity and showed a momentum effect in the market.
4. Conclusion
Our results are consistent with the findings by Ashraf (2020), Yilmazkudey (2020) and Barro et al. (2020) wherein the stock market performance in terms of average returns has declined due to the outbreak of COVID-19. According to the analysis, some sectors in India, due to perception of market going bullish once the pandemic is over, are actually gaining trading volume but losing average returns. Interestingly, COVID-19 has not shown a significant impact on Volatility Index, which implies that the risk perception of investors had decreased, which encouraged them to enter the market at low prices, thus improving market volumes. As opposed to economic factors being on a declining trend, stock market is becoming a hot-spot for investors. This can also hint a bubble forming as people are investing more in equity in the times of continuing recession. Owing to such contrary performance of the Financial sector as compared to the rest of the economy, the average returns can fall dramatically in near future instead of rising up again.
The pandemic has created a financial crisis situation in countries due to partial shutdowns of entire nations. Due to reduced or negligible economic activities happening, companies as well as the government faced financial crunch in the form of low or no revenue. Companies faced a double-edged sword in lock-down because due to no operations, they faced reduced revenue, which further contributed to decreased stock prices, as seen in our analysis. On the other hand, our study also shows a positive effect of the pandemic on trading volume, which could be attributed to investors’ improved confidence in the market. During the time of COVID-19, volatility declined in the Indian stock market, which is inversely linked to investor’s confidence. Therefore, it can be inferred from the reduced VIX that the investors’ confidence in market uplifted during the pandemic. The reason behind such anomaly could be that investors wish to enter the market when stock prices were low in order to earn profits in near future when the health and economic crisis faced by India ends. Another explanation for higher investor confidence could be the diversion of funds from debt based instruments to equity markets in response to RBI’s measures to boost demand.
Due to reduced VIX and improved investor sentiments, trading activity increased thus leading to increased trading volume. The results from this study remain consistent with investor risk aversion theory. The behavioural aspect of this effect can be a scope of future study.
Despite a decent performance, the Indian stock market does not reflect the real picture of the economy. It may, indeed, prove to be good news for investors as they can take advantage of the resilience in NIFTY 50 return by taking a long position to offset the losses incurred on other asset classes vulnerable to COVID-19. For the policymakers also, it has a positive side as their initiatives to keep the market going have taken effect in the form of NIFTY- 50 returns not reacting to the pandemic significantly while most sectors gaining trading volume. However, the study could be further elaborated by understanding the direct causal linkage from COVID-19 to stock market performance.
References
An introduction to the Indian Stock Market. (2020). Investopedia. Retrieved from https://www.investopedia.com/articles/stocks/09/indian-stock-market.asp
Alam, M. N., Alam, M. S., & Chavali, K. (2020). Stock market response during COVID-19 lockdown period in India: An event study. Journal of Asian Finance, Economics and Business, 7 (7), 131–137.
Alber, N. (2020). The Effect of Coronavirus Spread on Stock Markets: The Case of the Worst 6 Countries, Available at SSRN: https://ssrn.com/abstract=3578080 or http://dx.doi.org/10.2139/ssrn.3578080
Ali. M., Alam. N., & Rizvi, S. A. R. (2020). Coronavirus (COVID-19) – An epidemic or pandemic for financial markets. Journal of Behavioral and Experimental Finance, 27, 100341.
Appiah-Otoo, I. (2020). Does COVID-19 Affect Domestic Credit? Aggregate and Bank Level Evidence From China. Asian Economics Letters, 1(3), 1–5. https:/doi.org/10.46557/001c.18074
Ashraf, B. N. (2020). Stock markets’ reaction to COVID-19: Cases or fatalities? Research in International Business and Finance, 54, 101249. https://doi.org/10.1016/j.ribaf.2020.101249
Baker, S. R., Bloom, N., Davis, S. J., Kost, K., Sammon, M., & Viratyosin, T. (2020). The Unprecedented Stock Market Reaction to COVID-19. White paper. Becker Friedman Institute for Economics.
Barro R. J. (2020). The coronavirus and the great influenza pandemic: Lessons from the “Spanish flu” for the coronavirus’s potential effects on mortality and economic activity. NBER Working Paper Series Bo. 26866.
Chen, C., Liu, L., & Zhao, N. (2020). Fear sentiment, uncertainty, and bitcoin price dynamics: The case of COVID-19. Emerging Markets Finance and Trade, 56(10), 2298–2309. https://doi.org/10.1080/1540496X.2020.1787150
Daube, C. H. (2020). The Corona Virus Stock Exchange Crash. Leibniz Information Centre for Economics, Kiel, Hamburg.
Dev, S. M., & Sengupta, R. (2020). COVID-19: Impact on the Indian Economy. Working Paper. Indira Gandhi Institute of Development Research.
Devpura, N. (2020). Can Oil Prices Predict Japanese Yen? Asian Economics Letters, 1(3), 1–5. https://doi.org/10.46557/001c.17964
Devpura, N., & Narayan, P. K. (2020). Hourly oil price volatility: The role of COVID-19. Energy Research Letters, 1(2), 1–5. https:// doi.org/10.46557/001c.13683
Donadelli, M., Kizys, R., & Riedel, M. (2016). Dangerous infectious diseases: Bad news for Main street, good news for Wall Street? Journal of Financial Markets, 35(C), 84–103.
Fu, M., & Shen, N. (2020). COVID-19 and corporate performance in the Energy industry. Energy Research Letters, 1(1), 1–5. https://doi.org/10.46557/001c.12967
Gil-Alana, L. A., & Claudio-Quiroga, G. (2020). The COVID-19 IMPACT on the ASIAN STOCK MARKETS. Asian Economics Letters, 1(2), 1–5. https://doi.org/10.46557/001c.17656
Gormsen, N. J., & Koijen, R. S. J. (2020). Coronavirus: Impact on Stock Prices and Growth Expectations. University of Chicago, Becker Friedman Institute for Economics Working Paper No. 2020-22. https://ssrn.com/abstract=3555917.
Gu, X., Ying, S., Zhang, W., & Tao, Y., (2020) How do firms respond to COVID-19? First evidence from Suzhou, China. Emerging Markets Finance and Trade, 56(10), 2181–2197. https://doi.org/10.1080/1540496X.2020.1789455
Gujarati, D. N., (2009). Essentials of Econometrics. McGraw Hill Companies Inc.
Han, H., & Qian, Y. (2020). Did Enterprises’ Innovation Ability Increase During the COVID-19 Pandemic? Evidence From Chinese Listed Companies. Asian Economics Letters, 1(3), 1–5. https:// doi.org/10.46557/001c.18072
Haroon, O., & Rizvi, S. A. R. (2020). Flatten the curve and stock market liquidity—An Inquiry into emerging economies. Emerging Markets Finance and Trade, 56(10), 2151–2161. https://doi.org/10.1080/1540496X.2020.1784716.
He, P., Sun, Y., & Li, T. (2020a). COVID-19’s Impact on Stock Prices Across Different Sectors – An Event Study Based on the Chinese Stock Market. Emerging Markets Finance and Trade, 56(10), 2198–2212. Doi: 10.1080/1540496X.2020.1785865
He, P., Niu, H., Sun, Z., & Li, T. (2020b). Accounting index of COVID-19 impact on Chinese industries: A case study using big data portrait analysis. Emerging Markets Finance and Trade, 56(10), 2332–2349. https:// doi.org/10.1080/1540496X.2020.1785866
He, Q., Liu, J., Wang, S., & Yu, J. (2020c). The impact of COVID-19 on stock markets. Economic and Political Studies, 8(3), 275–288. https://doi.org/10.1080/20954816.2020.1757570
Hinkle, D. E., Wiersma, W., & Jurs, S. G. (2003). Applied Statistics for the Behavioral Sciences (5th ed.). Boston: Houghton Mifflin.
Huang, W., & Zheng, Y. (2020). COVID-19: Structural changes in the relationship between investor sentiment and crude oil futures price. Energy Research Letters, 1(2), 13685. https:// doi.org/10.46557/001c.13685
Iyke, B. (2020). COVID-19: The reaction of US oil and gas producers to the pandemic. Energy Research Letters, 1(2), 13912. https:// doi.org/10.46557/001c.13912
KP, P. (2020). Dynamics of Foreign Portfolio Investment and Stock Market Returns During the COVID-19 Pandemic: Evidence From India. Asian Economics Letters, 1(2), 1–5. https:// doi.org/10.46557/001c.17658
Lan, C., Huang, Z., & Huang, W. (2020). Systemic Risk in China’s Financial Industry Due to the COVID-19 Pandemic. Asian Economics Letters, 1(3), 1–5. https://doi.org/10.46557/001c.18070
Lei, Y. C. (2005). The trading volume trend, investor sentiment, and stock returns. LSU Doctoral Dissertations. https://digitalcommons.lsu.edu/gradschool_dissertations/2012
Liu, D., Sun, W., and Zhang, X. (2020a). Is the Chinese economy well positioned to fight the COVID-19 pandemic? The financial cycle perspective, Emerging Markets Finance and Trade, 56(10), 2259–2276. https:// doi.org/10.1080/1540496X.2020.1787152
Liu, H., Manzoor, A., Wang, C., Zhang, L., & Manzoor, Z. (2020b). The COVID-19 outbreak and affected countries stock market response. International Journal of Environmental Research and Public Health, 17, 2800.
Liu, L., Wang, E., & Lee, C. C. (2020c). Impact of the COVID-19 pandemic on the crude oil and stock markets in the US: A time varying analysis. Energy Research Letters 1(1), 1–5. https://doi.org/10.46557/001c.13154
Liu, T., Pan, B., & Yin, Z. (2020d). Pandemic, mobile payment, and household consumption: micro-evidence from China. Emerging Markets Finance and Trade, 56(10), 2378–2389. https:// doi.org/10.1080/1540496X.2020.1788539
Manojkrishnan, C. G. & Aravind, M. (2020). COVID-19: Effect on leading pharmaceutical stock listed with NSE. International Journal of Research in Pharmaceutical Sciences, 11(1), 31–36.
Mazur, M., Dang, M., & Vega, M. (2020). COVID-19 and the March 2020 stock market crash. Evidence from S&P1500. Finance Research Letters, 38, 101690. https://doi.org/10.1016/j.frl.2020.101690
Mirza, N., Naqvi, B., Rahat, B. & Rizvi, S.K.A. (2020). Price reaction, volatility timing and funds’ performance during COVID-19. Finance Research Letters, 36, 101657. https://doi.org/10.1016/j.frl.2020.101657
Mishra, A.K., Rath, B.N., & Dash, A.K. (2020). Does the Indian Financial Market Nosedive because of the COVID-19 Outbreak, in Comparison to after Demonetization and the GST?, Emerging Markets Finance and Trade, 56(10), 2162–2180. https:// doi.org/10.1080/1540496X.2020.1785425
Narayan, P. K. (2020a). Did Bubble Activity Intensify During COVID-19? Asian Economics Letters, 1(2), 1–5. https:// doi.org/10.46557/001c.17654
Narayan, P. K. (2020b). Has COVID-19 Changed Exchange Rate Resistance to Shocks? Asian Economics Letters, 1(1), 1–5. https://doi.org/10.46557/001c.17389
Narayan, P. K. (2020c). Oil price news and COVID-19 – Is there any connection? Energy Research Letters, 1(1), 13176. https:// doi.org/10.46557/001c.13176
Narayan, P.K., Devpura, N., & Wang, H. (2020). Japanese currency and stock market- what happened during the COVID-19 pandemic? Economic Analysis and Policy, 68, 191–198. https:// doi.org/10.1016/j.eap.2020.09.014
NDTV Profit. (2020). With inflation ticking higher it may be time for RBI to pause rate-cutting cycle.
Newey, W. K., & West, K. D. (1987). A simple positive semi-definite, heteroskedasticity and autocorrelation consistent covariance matrix. NBER Working Paper No. t0055. Available at SSRN: https://ssrn.com/abstract=225071
Njindan Iyke, B. (2020). Economic Policy Uncertainty in Times of COVID-19 Pandemic. Asian Economics Letters, 1(2), 1–5. https://doi.org/10.46557/001c.17665
Ortmann, R., Pelster, M., & Wengerek, S. T. (2020). Finance Research Letters, 37, 101717, https:// doi.org/10.1016/j.frl.2020.101717
Ozili, P., & Arun, T. (2020). Spillover of COVID-19: Impact on the global economy. Available at: https://ssrn.com/abstract=3562570.
Peng, L., & Lei, L. (2005). A review of missing data treatment methods. Intelligent Information Management System Technology, 2(2), 2349–3976.
Phan, D. H. K., & Narayan, P. K. (2020). Country responses and the reaction of the stock market to COVID-19 – a Preliminary Exposition. Emerging Markets Finance and Trade, 56(10), 2138–2150. https:// doi.org/10.1080/1540496X.2020.1784719
Polemis, M., & Soursou, S. (2020). Assessing the Impact of the COVID-19 Pandemic on the Greek Energy Firms: An Event Study Analysis. Energy Research Letters, 1(3), 1–5. https:// doi.org/10.46557/001c.17238
Prabheesh, K. P., Padhan, R., & Garg, B. (2020). COVID-19 and the oil price—stock market nexus: Evidence from net oil-importing countries. Energy Research Letters, 1(2), 13745. https:// doi.org/10.46557/001c.13745
Qin, M., Zhang, Y. C., & Su, C. W. (2020). The Essential Role of Pandemics: A Fresh Insight into the Oil Market. Energy Research Letters, 1(1), 13166. https:// doi.org/10.46557/001c.13166
Reuters. (2020). Italy statistics bureau forecasts GDP to fall 8.3% in 2020 on coronavirus hit.
Salisu, A., & Adediran, I. (2020). Uncertainty due to infectious diseases and Energy market volatility. Energy Research Letters, 1(2), 14185. https:// doi.org/10.46557/001c.14185
Salisu, A. A., & Akanni, L. O. (2020). Constructing a global fear index for COVID-19 pandemic. Emerging Markets Finance and Trade, 56(10), 2213–2230. https:// doi.org/10.1080/1540496X.2020.1785424
Salisu, A. A., & Sikiru, A. A. (2020). Pandemics and the Asia-Pacific Islamic Stocks. Asian Economics Letters, 1(1), 1–5. https:// doi.org/10.46557/001c.17413
Sha, Y., & Sharma, S. S. (2020). Research on Pandemics Special Issue of the Journal Emerging Markets Finance and Trade. Emerging Markets Finance And Trade, 56(10), 2133–2137. https:// doi.org/10.1080/1540496X.2020.1795467
Sharma, S. S. (2020). A Note on the Asian Market Volatility During the COVID-19 Pandemic. Asian Economics Letters, 1(2), 1–5. https:doi.org/10.46557/001c.17661
Shen, H., Fu, M., Pan, H., Yu, Z., & Chen, Y. (2020). The impact of the COVID-19 pandemic on firm performance. Emerging Markets Finance and Trade, 56(10), 2213–2230. https:// doi.org/10.1080/1540496X.2020.1785863
Singh, M.K., & Neog, Y. (2020). Contagion effect of COVID-19 outbreak: Another recipe for disaster on Indian Economy. Journal of Public Affairs, 20(4), 1–8. https://10.1002/pa.2171
The Asian Age. (2020, July22). Retail investors flocking to stock markets amid COVID-19 crisis: SEBI Chief. The Asian Age. https://www.asianage.com/business/market/220720/retail-investors-flocking-to-stock-markets-amid-covid-19-crisis-sebi-chief.html
Topcu, M.. & Gulal, O. S. (2020). The impact of COVID-19 on emerging stock markets. Finance Research Letters, 36, 101691. https://doi.org/10.1016/j.frl.2020.101691
Xiong, H., Wu, Z., Hou, F., & Zhang, J. (2020). Which firm-specific characteristics affect the market reaction of Chinese listed companies to the COVID-19 pandemic? Emerging Markets Finance and Trade, 56(10), 2231–2242. https:// doi.org/10.1080/1540496X.2020.1787151
Yan, L., & Qian, Y. (2020). The Impact of COVID-19 on the Chinese Stock Market: An Event Study Based on the Consumer Industry. Asian Economics Letters, 1(3), 1–5. https:// doi.org/10.46557/001c.18068
Yilmazkuday, H. (2020). COVID-19 effects on the S&P 500 index. SSRN Electronic Journal. https://doi.org/10.2139/ssrn.3555433
Zaremba, A., Kizys, R., Aharon, D. Y., Demir, E. (2020). Infected markets: Novel coronavirus, government interventions, and stock return volatility around the globe. Finance Research Letters, 101597. http://dx.doi.org/10.1016/j.frl.2020.101597.
Appendix 1. Empirical Results
Table 3. Breakpoint ADF Unit Root Test Results
|
Variables |
Test statistic |
p-value at I(0) |
Variables |
Test statistic |
p-value at I(0) |
|
NR |
–18.5524 |
<0.01* |
MR |
–18.6035 |
<0.01* |
|
NV |
–7.7319 |
<0.01* |
MV |
–10.8148 |
<0.01* |
|
VIX |
–13.5546 |
<0.01* |
FSR |
–17.1033 |
<0.01* |
|
AR |
–17.5438 |
<0.01* |
FSV |
–5.5375 |
<0.01* |
|
AV |
–8.8558 |
<0.01* |
RR |
–15.7274 |
<0.01* |
|
PR |
–16.6215 |
<0.01* |
RV |
–10.6375 |
<0.01* |
|
PV |
–7.3491 |
<0.01* |
BR |
–16.9967 |
<0.01* |
|
IR |
–20.5356 |
<0.01* |
BV |
–7.2000 |
<0.01* |
|
IV |
–7.0746 |
<0.01* |
Oil |
–21.9112 |
<0.01* |
|
FR |
–18.7481 |
<0.01* |
EX |
–21.5819 |
<0.01* |
|
FV |
–9.4985 |
<0.01* |
FPI |
–21.2489 |
<0.01* |
|
ER |
–20.1098 |
<0.01* |
SP |
–10.5749 |
<0.01* |
|
EV |
–8.5922 |
<0.01* |
BY |
–16.9822 |
<0.01* |
*At 5% level of significance
Table 4. Regression results for Equation 1.1 and Equation 2.1
|
Dependent Variable: Nifty Return |
Dependent Variable: Nifty Volume |
||||
|
Independent |
Coefficient |
p-value |
Independent |
Coefficient |
p-value |
|
NV |
0.299261 |
0.4438 |
VIX |
0.004179 |
0.131 |
|
COV |
–64.7255 |
0.0982* |
SP |
–0.00944 |
0.2537 |
|
VIX |
–0.10967 |
0** |
OIL |
–0.01547 |
0.0168** |
|
OIL |
0.023136 |
0.3339 |
NR |
0.038073 |
0.0502* |
|
EX |
–0.27904 |
0.0765* |
FPI |
–1.38E-05 |
0.2587 |
|
FPI |
–1.57E–06 |
0.9681 |
EX |
0.022269 |
0.3864 |
|
SP |
0.087638 |
0.2652 |
COV |
0.074022 |
0.0258** |
|
BY |
–0.0605 |
0.2786 |
BY |
0.000395 |
0.9622 |
|
NR(-1) |
–0.17628 |
0.0499** |
NV(–1) |
0.621152 |
0** |
|
COV*NV |
3.164472 |
0.0996* |
COV*NR |
–0.01609 |
0.4156 |
|
COV*VIX |
–0.13341 |
0.0024** |
COV*OIL |
0.015204 |
0.023** |
|
COV*EX |
–0.65124 |
0.1666 |
C |
7.653711 |
0** |
|
COV*SP |
0.336566 |
0.0048** |
|
|
|
|
C |
–6.01278 |
0.4436 |
|
|
|
|
Durbin Watson Stat |
1.8902 |
Durbin Watson Stat |
2.1927 |
||
|
R-squared |
0.529498 |
R-squared |
0.530261 |
||
* and ** indicate statistical significance at the 10% and 5 % levels respectively.
Table 5. Regression results for Equation 1.2 and Equation 2.2
|
Dependent Variable: Auto Sector Returns |
Dependent Variable: Auto Sector Volume |
||||
|
Independent |
Coefficient |
p- value |
Independent |
Coefficient |
p- value |
|
OIL |
0.083609 |
0.0827* |
OIL |
0.000438 |
0.8871 |
|
AV |
2.19E+00 |
0** |
FPI |
–3.20E-05 |
0.0487** |
|
FPI |
5.45E-05 |
0.4955 |
EX |
–0.00283 |
0.9334 |
|
EX |
–0.23618 |
0.3746 |
COV |
0.253074 |
0** |
|
COV |
–1.07538 |
0.0161** |
BY |
–0.01372 |
0.2168 |
|
BY |
–0.07046 |
0.279 |
SP |
–0.01056 |
0.3084 |
|
SP |
–0.11192 |
0.3426 |
VIX |
0.011775 |
0.0006** |
|
VIX |
–0.1435 |
0** |
AR |
0.056935 |
0** |
|
AR(–1) |
–0.11997 |
0.0678* |
AV(–1) |
0.516988 |
0** |
|
COV*VIX |
–0.10407 |
0.0218** |
C |
2.20627 |
0** |
|
COV*OIL |
–0.06544 |
0.2561 |
|
|
|
|
COV*EX |
–0.83485 |
0.1704 |
|
|
|
|
COV*SP |
0.543091 |
0.0022** |
|
|
|
|
C |
–9.95219 |
0** |
|
|
|
|
Durbin Watson Stat |
1.7343 |
Durbin Watson Stat |
2.1647 |
||
|
R-squared |
0.464813 |
R-squared |
0.623841 |
||
* and ** indicate statistical significance at the 10% and 5 % levels respectively.
Table 6. Regression results for Equation 1.3 and Equation 2.3
|
Dependent Variable: Pharma Sector Returns |
Dependent Variable: Pharma Sector Volume |
||||
|
Independent |
Coefficient |
p- value |
Independent |
Coefficient |
p- value |
|
PV |
0.409693 |
0.1854 |
SP |
–0.0305 |
0.0083** |
|
VIX |
–0.10026 |
0** |
VIX |
–0.00147 |
0.7451 |
|
SP |
–0.00318 |
0.9766 |
PR |
0.026542 |
0.1823 |
|
OIL |
0.065366 |
0.1525 |
OIL |
0.000589 |
0.8532 |
|
FPI |
–5.61E-06 |
0.9451 |
FPI |
–2.23E-05 |
0.1739 |
|
EX |
0.061108 |
0.7227 |
EX |
2.01E-02 |
0.554 |
|
COV |
–7.68333 |
0.0001** |
COV |
0.242935 |
0** |
|
BY |
–0.03754 |
0.5071 |
BY |
–0.02194 |
0.0515* |
|
PR(–1) |
–0.02352 |
0.6889 |
PV(–1) |
0.627147 |
0** |
|
COV*OIL |
–0.10765 |
0.026** |
COV*PR |
0.047603 |
0.0567* |
|
COV*SP |
0.422696 |
0.0009** |
COV*VIX |
0.012601 |
0.053* |
|
COV*PV |
1.92E+00 |
0.0002** |
C |
1.187532 |
0** |
|
C |
–1.22E+00 |
0.2187 |
|
|
|
|
Durbin Watson Stat |
1.8724 |
Durbin Watson Stat |
2.2210 |
||
|
R-squared |
0.413223 |
R-squared |
0.731519 |
||
* and ** indicate statistical significance at the 10% and 5 % levels respectively.
Table 7. Regression results for Equation 1.4 and Equation 2.4
|
Dependent Variable: IT Sector Returns |
Dependent Variable: IT Sector Volume |
||||
|
Independent |
Coefficient |
p- value |
Independent |
Coefficient |
p- value |
|
IV |
–0.04473 |
0.9084 |
VIX |
0.00531 |
0.137 |
|
VIX |
–0.08169 |
0.0023** |
SP |
–0.01583 |
0.1775 |
|
SP |
0.294889 |
0.0026** |
OIL |
–0.0045 |
0.1862 |
|
OIL |
0.02321 |
0.3121 |
FPI |
–1.38E–06 |
0.9388 |
|
FPI |
0.000131 |
0.1215 |
EX |
0.059864 |
0.1117 |
|
EX |
0.033186 |
0.8653 |
COV |
0.296812 |
0** |
|
COV |
–8.55876 |
0.0417** |
BY |
0.015188 |
0.2145 |
|
BY |
–0.01438 |
0.8176 |
IR |
0.022847 |
0.0618* |
|
IR(–1) |
–0.30747 |
0.0013** |
IV(–1) |
0.363907 |
0** |
|
COV*IV |
2.372529 |
0.0482** |
C |
2.038507 |
0** |
|
COV*VIX |
–0.11918 |
0.0067** |
|
|
|
|
COV*EX |
–1.11738 |
0.0199** |
|
|
|
|
C |
0.202245 |
0.8674 |
|
|
|
|
Durbin Watson Stat |
1.8986 |
Durbin Watson Stat |
2.1621 |
||
|
R-squared |
0.461646 |
R-squared |
0.408386 |
||
* and ** indicate statistical significance at the 10% and 5 % levels respectively.
Table 8. Regression results for Equation 1.5 and Equation 2.5
|
Dependent Variable: FMCG Sector Returns |
Dependent Variable: FMCG Sector Volume |
||||
|
Independent V |
Coefficient |
p- value |
Independent |
Coefficient |
p- value |
|
FV |
1.11653 |
0.0026** |
SP |
–0.00403 |
0.7002 |
|
SP |
0.056529 |
0.5032 |
VIX |
0.00798 |
0.0135** |
|
VIX |
–0.06718 |
0** |
OIL |
–0.00174 |
0.5721 |
|
OIL |
0.005204 |
0.8142 |
FPI |
–8.81E–06 |
0.5859 |
|
FPI |
5.57E–05 |
0.1223 |
EX |
0.038838 |
0.2485 |
|
EX |
–0.30744 |
0.0959* |
COV |
0.404269 |
0** |
|
COV |
–0.76268 |
0.0216** |
BY |
0.006776 |
0.5412 |
|
BY |
–0.04152 |
0.3625 |
FR |
0.040474 |
0.0017** |
|
FR(–1) |
–0.27489 |
0.0542* |
FV(–1) |
0.493526 |
0** |
|
COV*VIX |
–0.12048 |
0.005** |
C |
1.676401 |
0** |
|
COV*SP |
0.152478 |
0.2225 |
|
|
|
|
C |
–3.68427 |
0.0023** |
|
|
|
|
Durbin Watson Stat |
1.8077 |
Durbin Watson Stat |
2.2036 |
||
|
R-squared |
0.392142 |
R-squared |
0.697311 |
||
* and ** indicate statistical significance at the 10% and 5 % levels respectively.
Table 9. Regression results for Equation 1.6 and Equation 2.6
|
Dependent Variable: Energy Sector Returns |
Dependent Variable: Energy Sector Volume |
||||
|
Independent |
Coefficient |
p- value |
Independent |
Coefficient |
p- value |
|
EV |
0.096651 |
0.7612 |
VIX |
0.010574 |
0.0039** |
|
VIX |
–0.10666 |
0** |
SP |
–0.03519 |
0.0025** |
|
SP |
0.092235 |
0.4266 |
OIL |
0.00061 |
0.8539 |
|
OIL |
0.111217 |
0.0169** |
FPI |
–4.74E–06 |
0.7866 |
|
FPI |
–0.00015 |
0.0062** |
EX |
0.039527 |
0.2754 |
|
EX |
–0.08446 |
0.6666 |
COV |
0.270508 |
0** |
|
COV |
–9.71723 |
0.1637 |
BY |
0.001841 |
0.877 |
|
BY |
–0.07339 |
0.2664 |
ER |
0.034016 |
0.0061** |
|
ER(–1) |
–0.20969 |
0.0136** |
EV(–1) |
0.506841 |
0** |
|
COV*EV |
1.931872 |
0.1668 |
C |
2.240956 |
0** |
|
COV*VIX |
–0.0989 |
0.0495** |
|
|
|
|
COV*OIL |
–0.10941 |
0.0328** |
|
|
|
|
COV*EX |
–0.77611 |
0.0908* |
|
|
|
|
COV*SP |
0.322434 |
0.034** |
|
|
|
|
C |
–0.46778 |
0.7392 |
|
|
|
|
Durbin Watson Stat |
1.8783 |
Durbin Watson Stat |
2.1025 |
||
|
R-squared |
0.482496 |
R-squared |
0.578847 |
||
* and ** indicate statistical significance at the 10% and 5 % levels respectively.
Table 10. Regression results for Equation 1.7 and Equation 2.7
|
Dependent Variable: Metal Sector Returns |
Dependent Variable: Metal Sector Volume |
||||
|
Independent |
Coefficient |
p- value |
Independent |
Coefficient |
p- value |
|
MV |
1.897678 |
0.0004** |
VIX |
0.011029 |
0.0036** |
|
VIX |
–0.20688 |
0** |
SP |
0.01147 |
0.5246 |
|
SP |
–0.10727 |
0.4321 |
OIL |
–0.01361 |
0.0765* |
|
OIL |
0.18766 |
0.0001** |
FPI |
–2.18E–05 |
0.1084 |
|
FPI |
0.000157 |
0.0278** |
EX |
0.018032 |
0.5282 |
|
EX |
–0.01804 |
0.9461 |
COV |
0.196665 |
0** |
|
COV |
–67.2036 |
0.0054** |
BY |
–0.00684 |
0.463 |
|
BY |
–0.09475 |
0.0858* |
MR |
0.04695 |
0** |
|
MR(–1) |
–0.12781 |
0.0443** |
MV(–1) |
0.312559 |
0** |
|
COV*MV |
3.531358 |
0.006** |
COV*VIX |
0.006063 |
0.2267 |
|
COV*VIX |
–0.07301 |
0.1163 |
COV*OIL |
0.012922 |
0.1089 |
|
COV*OIL |
–0.17412 |
0.0012** |
COV*SP |
–0.03029 |
0.1473 |
|
COV*EX |
–1.06474 |
0.0388** |
C |
12.78862 |
0** |
|
COV*SP |
0.569778 |
0.0029** |
|
|
|
|
C |
–35.3301 |
0.0004** |
|
|
|
|
Durbin Watson Stat |
2.0100 |
Durbin Watson Stat |
1.9841 |
||
|
R-squared |
0.560834 |
R-squared |
0.441935 |
||
* and ** indicate statistical significance at the 10% and 5 % levels respectively.
Table 11. Regression results for Equation 1.8 and Equation 2.8
|
Dependent Variable: Financial Services Returns |
Dependent Variable: Financial Services Volume |
||||
|
Independent |
Coefficient |
p- value |
Independent |
Coefficient |
p- value |
|
FSV |
1.656354 |
0.0008** |
VIX |
0.004497 |
0.1462 |
|
OIL |
0.025032 |
0.4582 |
SP |
–0.01106 |
0.2635 |
|
SP |
0.331042 |
0.0042** |
OIL |
–0.00086 |
0.7664 |
|
VIX |
–0.16948 |
0** |
FSR |
0.027074 |
0.0012** |
|
FPI |
2.24E–05 |
0.6936 |
FPI |
–2.28E–05 |
0.1321 |
|
EX |
–0.70827 |
0.048** |
EX |
0.078037 |
0.0142** |
|
COV |
–1.50696 |
0.0107** |
COV |
0.399453 |
0** |
|
BY |
–0.05573 |
0.5908 |
BY |
0.016048 |
0.1225 |
|
FSR(–1) |
–0.10449 |
0.2231 |
FSV(–1) |
0.466922 |
0** |
|
C |
–31.0003 |
0.0007** |
C |
10.01625 |
0** |
|
Durbin Watson Stat |
1.8880 |
Durbin Watson Stat |
2.2176 |
||
|
R-squared |
0.356153 |
R-squared |
0.688333 |
||
* and ** indicate statistical significance at the 10% and 5 % levels respectively.
Table 12. Regression results for Equation 1.9 and Equation 2.9
|
Dependent Variable: Realty Sector Returns |
Dependent Variable: Realty Sector Volume |
||||
|
Independent |
Coefficient |
p- value |
Independent |
Coefficient |
p- value |
|
RV |
0.22438 |
0.645 |
BY |
0.011041 |
0.4554 |
|
VIX |
–0.09862 |
0** |
COV |
0.019336 |
0.7158 |
|
SP |
0.322376 |
0.0004** |
EX |
0.02893 |
0.5217 |
|
OIL |
–0.01036 |
0.7113 |
FPI |
–2.58E–05 |
0.2388 |
|
FPI |
–0.00016 |
0.0812* |
OIL |
9.70E–04 |
0.8135 |
|
EX |
–0.49257 |
0.0627* |
RR |
0.007826 |
0.6976 |
|
COV |
–42.6135 |
0.0062** |
SP |
–0.01365 |
0.3309 |
|
BY |
–0.03024 |
0.7289 |
VIX |
0.003696 |
0.4052 |
|
RR(–1) |
–0.04493 |
0.4729 |
RV(–1) |
0.407279 |
0** |
|
COV*RV |
2.556651 |
0.0066** |
COV*RR |
0.03451 |
0.1338 |
|
COV*VIX |
–0.13178 |
0.0009** |
C |
9.775192 |
0** |
|
C |
–3.59107 |
0.6526 |
|
|
|
|
Durbin Watson Stat |
1.7641 |
Durbin Watson Stat |
2.2064 |
||
|
R-squared |
0.407804 |
R-squared |
0.199623 |
||
* and ** indicate statistical significance at the 10% and 5 % levels respectively.
Table 13. Regression results for Equation 1.10 and Equation 2.10
|
Dependent Variable: Banking Sector Returns |
Dependent Variable: Banking Sector Volume |
||||
|
Independent |
Coefficient |
p- value |
Independent |
Coefficient |
p- value |
|
BV |
0.485275 |
0.224 |
VIX |
0.001726 |
0.5857 |
|
VIX |
–0.10063 |
0** |
SP |
–0.01205 |
0.2325 |
|
SP |
0.408752 |
0.0004** |
OIL |
–0.00226 |
0.4434 |
|
OIL |
0.028025 |
0.3128 |
FPI |
–9.23E–06 |
0.5479 |
|
FPI |
–2.96E–05 |
0.5592 |
EX |
0.015854 |
0.6227 |
|
EX |
–0.58783 |
0.0735* |
COV |
0.051535 |
0.1874 |
|
COV |
–74.3318 |
0.0196** |
BY |
–0.01433 |
0.4057 |
|
BY |
–0.07749 |
0.3951 |
BR |
0.021756 |
0.0073** |
|
BR(–1) |
–0.09244 |
0.2635 |
BV(–1) |
0.668359 |
0** |
|
COV*BV |
3.722041 |
0.0201** |
COV*BY |
0.042913 |
0.0481** |
|
COV*VIX |
–0.20162 |
0.0003** |
C |
6.55264 |
0** |
|
C |
–9.5662 |
0.2207 |
|
|
|
|
Durbin Watson Stat |
1.8404 |
Durbin Watson Stat |
2.0352 |
||
|
R-squared |
0.417006 |
R-squared |
0.509632 |
||
* and ** indicate statistical significance at the 10% and 5 % levels respectively.
Table 14. Regression results for Equation 3.1
|
Dependent Variable: VIX Returns |
||
|
Independent Variable |
Coefficient |
p- value |
|
SP |
–0.80219 |
0.0703* |
|
OIL |
0.007163 |
0.8914 |
|
NV |
–0.8802 |
0.608 |
|
NR |
–1.84187 |
0** |
|
EX |
–0.14722 |
0.83 |
|
COV |
–310.897 |
0.0029** |
|
BY |
–0.14356 |
0.3842 |
|
FPI |
0.000321 |
0.0747* |
|
NV(–1) |
2.825008 |
0.0907* |
|
COV*NV |
15.18069 |
0.0031** |
|
COV*SP |
1.741589 |
0.0027** |
|
C |
–38.6541 |
0.2078 |
|
Durbin Watson Stat |
1.9449 |
|
|
R-squared |
0.427058 |
|
* and ** indicate statistical significance at the 10% and 5 % levels respectively.
1 NSE is the largest stock exchange in India in terms of volume (Investopedia, 2020).