Organizations and Markets in Emerging Economies ISSN 2029-4581 eISSN 2345-0037
2021, vol. 12, no. 2(24), pp. 478–502 DOI: https://doi.org/10.15388/omee.2021.12.66
Consumer Entitlement Inventory: A Scale Extension and Application to the Vietnamese Retail Context
Si Van Nguyen (corresponding author)
University of Economics Ho Chi Minh City, Vietnam
nvs@ueh.edu.vn
https://orcid.org/0000-0003-0294-7831
Minh Vo
University of Economics Ho Chi Minh City, Vietnam
minhvo.ncs2020012@st.ueh.edu.vn
https://orcid.org/0000-0001-8507-4487
Abstract. The consumer entitlement (CE) construct is a key variable in the exchange process in retail environments. The original Consumer Entitlement Inventory (CEI) was developed and applied within Western cultural boundaries. The main contribution of this study is the extension of the original CEI to better fit the Vietnamese context and to demonstrate its applicability in the context of an emerging economy with a Confucian culture. The study also contributes to expanding the range of identified boycott motives in the literature and clarifying their mechanism via social exchange theory. The extended CEI scale was tested using exploratory factor analysis and confirmatory factor analysis, using a sample of 603 respondents. Qualitative and quantitative research results show that the extended CEI has two dimensions, namely intransigence, and demand and distinction, with adequate content, reliability, convergent validity, and discriminant validity. This study also aimed to apply the extended CEI to an exploration of the relationship between CE and willingness to boycott. Research results from another independent study with 450 respondents using a structural equation model confirmed the positive relationship between CE and willingness to boycott. In addition, theoretical implications are discussed.
Keywords: Consumer entitlement, social exchange theory, willingness to boycott, Confucian culture, extended CEI
Received: 31/12/2020. Accepted: 19/9/2021
Copyright © 2021 Si Van Nguyen, Minh Vo. Published by Vilnius University Press. This is an Open Access article distributed under the terms of the Creative Commons Attribution Licence, which permits unrestricted use, distribution, and reproduction in any medium, provided the original author and source are credited.
Introduction
The concept of consumer entitlement (CE) has been defined as “the expectation of special treatment and automatic compliance with one’s expectations by service personnel in the sales encounter” in a retail environment (Boyd & Helms, 2005, p. 277). Boyd and Helms first introduced the Consumer Entitlement Inventory (CEI) as a self-reported measure to capture the presentation of entitled customers in the buyer–seller interaction; the CEI has only been used in the traditional domain of individualistic culture (Edey & Knight, 2018). In some cases, the measurement for a construct may require modification in order to be appropriate for use in a different context (Riefler & Diamantopoulos, 2007). Thus, this study’s primary purpose is to extend the original CEI, so that the measurement better fits the Vietnamese context, that is, an emerging economy with a Confucian culture (Le & Ho, 2020). In addition, the measurement needs to be enriched with items that capture consumers’ specific service quality expectations in emerging countries due to the uncertainty avoidance tendency (Diallo & Seck, 2018).
Businesses should monitor boycott activities seriously because they threaten sales figures, the company’s reputation, and stock prices (Hoffmann, 2014). To date, various motives for boycotts have been examined in the fields of psychology, social psychology, and economics (Abdul-Talib et al., 2016). However, research on CE and its consequences is still limited (Davis, 2019). The second purpose of this study is to apply the extended CEI to an exploration of the relationship between CE and willingness to boycott in the Vietnamese retail context.
The paper is organized as follows. Section 1 presents the conceptual background of CE. Then, the research methodology, hypotheses development, and results are presented. Finally, we conclude the paper and present its theoretical implications as well as directions for future research.
1. Conceptual Background
Entitled consumers enter a retail store expecting to receive special treatment from the staff and automatic compliance with all their requests (Boyd & Helms, 2005). Along with personality traits, other antecedents, such as increasing competitiveness and consumers’ power over sellers, are likely to contribute to the growth of CE. For instance, given the increasingly intense competition in the service and retail industries, customers in such industries possess relatively high market power, and this can transfer into CE (Ma et al., 2018). In addition, in a competitive environment, prioritization tactics give customers a sense of superiority, and they feel that they deserve special treatment from the company; this eventually develops into entitlement behaviors, such as tough negotiations, the use of bargaining tactics, and attempts to obtain privileges (Ma et al., 2018; Wetzel et al., 2014). Vietnam is a special case, as it is transitional, consumers are dependent on the government for many things (Le et al., 2020), and customers exhibit the uncertainty avoidance tendency (Diallo & Seck, 2018). As uncertainty avoiders, customers require strict regulation and rule adherence to reduce uncertainty (Hoffmann, 2014). Customers in the developing market also demand a high degree of transparency from service companies (Liu et al., 2015) in order to reduce transactional risk. Thus, the CEI needs to be enriched with items that reflect the demand for information updates. According to Diallo and Seck (2018), consumers’ service quality expectations vary due to cultural differences. Given the entitled customer’s sense of superiority, the service level must be commensurate with their relative standing (Wetzel et al., 2014). Thus, the scale also needs to be enriched with items that reflect the demand for the best quality.
2. Methodology
To develop the original CEI into a better fitting measurement of CE in the context of Vietnam’s retail sector, four studies were conducted, as presented in Table 1, following Churchill (1979) and Devellis’s (2003) suggestions. While some original CEI items were retained, others were screened against the culture, new complementary items were added, and unsuitable items were removed without changing the construct’s domain (Abdul-Latif & Abdul-Talib, 2017).
Table 1. Scale Extension Procedure for the CEI
|
Steps |
Objectives |
|
Study 1 |
Select a set of items from the original CEI through a literature review and generate additional items by conducting focus group discussions (FDGs) with academic experts and consumers; |
|
Study 2 Study 3 |
Conduct a quantitative study to confirm the scale’s dimensionality, reliability, and validity; |
|
Study 4 |
Conduct an independent survey to examine the nomological validity of the extended CEI. |
Note. Adapted from Churchill (1979) and Devellis (2003)
2.1 Study 1: Item generation and scale pre-testing
In the present study, the researchers followed Adam et al. (2020) four-step procedure to generate measurement items for the scale.
First, as per Netemeyer et al. (2003) recommendation, the dimensionality of the extended CEI was specified a priori, and the scale was expected to have three dimensions, as in Butori (2010). The first dimension (demand) captures the idea of high service quality expectations. The second dimension (intransigence) captures the idea of high expectations in a service failure context. The third dimension (distinction) captures the idea of special treatment, such as the expectation of extra recognition, better service, additional efforts, and rewards for a limited number of customers. Items that correspond with Butori’s (2010) three-dimensional CEI structure were selected from literature review and presented in Table 2. Some items appear with certain codes, such as “Know,” “Whim,” etc., as in Boyd and Helms (2005) and Butori (2010) original studies. Since the study was conducted in Vietnam, so the original items, which are presented in English, were back-translated into Vietnamese by a professional translator to ensure linguistic equivalence, clarity, and reliability (Brislin, 1986).
Table 2. List of Items from Original Instrument and Post Content Validity Assessment
|
Dimension |
Code |
Items from |
Source |
PA (%) |
CVI |
Retained |
Items from post content validity |
|
Demand |
Whim |
In some real sense, I feel that a store’s personnel should cater to my every whim. |
Boyd and Helms (2005) |
100 |
1.00 |
Yes |
I feel that a store’s personnel should cater to my every whim. |
|
Exclusive |
As a valuable customer, I have earned the right to deal exclusively with a store’s most talented staff members. |
|
100 |
1.00 |
Yes |
As a valuable customer, I have the right to deal exclusively with familiar staff members. |
|
|
Know |
I don’t care if a store clerk is a rookie, he or she ought to know how well a given product works. |
|
100 |
100 |
Yes |
I don’t care if a store clerk is a rookie, he or she ought to know how well a given product works. |
|
|
CustRight |
I absolutely believe in the saying “the customer is always right.” |
|
33 |
0.33 |
No |
- |
|
|
Intransigence |
Answer |
In this modern age of technology, I should be able to ask a salesperson any question and have it answered instantly. |
|
100 |
1.00 |
Yes |
Whenever I have a question, a salesperson must answer it instantly. |
|
Empathy |
I desire absolute empathy from a store clerk when I have a problem. |
|
83 |
1.00 |
Yes |
I desire absolute empathy from a store clerk when I have a problem. |
|
|
Perfect |
With all the money stores spend on advertising, I expect my merchandise to be perfect. |
|
83 |
1.00 |
Yes |
With all the money I pay, I expect my merchandise to be perfect. |
|
|
|
Deserve |
I deserve to be taken to where a particular item is in a store and not told “well it’s on Aisle 3.” |
|
100 |
1.00 |
Yes |
I deserve to be taken to where a particular item is in a store instead of being given instructions only. |
|
Formal |
At all times, I want store clerks to address me in a formal manner (e. g., sir or ma’am). |
|
50 |
0.33 |
No |
- |
|
|
Distinction
|
Attention |
I need to feel that I am a customer who is granted special attention. |
Butori (2010) |
100 |
1.00 |
Yes |
I need to feel that I am a customer who is granted special attention. |
|
Average |
I don’t like feeling like an average customer. |
|
83 |
1.00 |
Yes |
I don’t like feeling like an average customer. |
|
|
Any other |
I generally don’t like to be considered the same as any other customer. |
|
50 |
0.50 |
No |
- |
Second, qualitative research was conducted in the form of focus group discussions (FGDs; Churchill, 1979). FGD is a technique that entails a researcher assembling a group of individuals to discuss or debate about a research topic that requires collective views, with the aim of drawing on participants’ personal experiences, perceptions, and attitudes through moderated interaction within a group (Nyumba et al., 2018). FGDs help the moderator understand the participants’ opinions and perceptions as well as the breadth and diversity of their thoughts (Le & Quy, 2020). Researchers can obtain insightful data that emerges from the cohesive and natural discussions that occur during FGDs (Malhotra & Dash, 2010).
A focus group should ideally comprise six to ten members (Cooper & Schindler, 2003). Two focus groups were arranged to achieve the research objectives. All group discussions took place in the Ho Chi Minh City University of Economics meeting room in April 2020. The atmosphere was relaxed and comfortable, and all participants were encouraged to engage in the discussions.
Group 1 included five retailers, and five marketing and retail professors. The purpose of the group discussion was to explore the direction of possible extension. The results showed that the experts agreed with Butori’s (2010) three-dimensional CEI structure. Consumers with different degrees of uncertainty differ in their perceptions of service quality (Voss et al., 2004). The experts proposed enriching the items that capture the demand for the best service quality, based on the uncertainty avoidance tendency (Diallo & Seck, 2018). In addition to collectivism, customers demand that retailers communicate with them frequently (Eng & Jin Kim, 2006), so that they may receive information updates to reduce uncertainty. Given the information asymmetry that exists in emerging markets such as Vietnam, consumers rely on signals (information) to help them make better decisions (Diallo & Seck, 2018).
The second group discussion was held to generate additional items for the CEI. Group 2 consisted of ten consumers, all aged over 18 years, who frequently shopped at retail stores or supermarkets. Table 3 presents ten additional items from the focus group. Eight were excluded because they were not appropriate for the intended objective.
Table 3. List of Items Generated from Focus Group and Content Validity Assessment
|
Code |
Measurement item |
PA (%) |
CVI |
Retained |
|
1 |
I should receive special benefits from the store. |
33 |
0.50 |
No |
|
2 |
I want store clerks to treat me politely. |
50 |
0.33 |
No |
|
3 |
I think the store appreciates me more than other customers. |
83 |
0.17 |
No |
|
4 |
I believe I am a very important customer of the store. |
50 |
0.67 |
No |
|
5 |
The store should grant me first class privileges. |
33 |
0.50 |
No |
|
Infoupdate |
I demand the latest information update from the store. |
100 |
1.00 |
Yes |
|
7 |
Store staff should warmly greet me. |
33 |
0.33 |
No |
|
8 |
I think I am a valuable customer of the store. |
67 |
0.67 |
No |
|
Bestservice |
I should receive best service level from the store. |
83 |
1.00 |
Yes |
|
10 |
Store staff should invest more time in me. |
33 |
0.67 |
No |
Third, the authors conducted an expert panel with six experts (two retail managers, two professors specializing in consumer behavior, and two professors specializing in marketing) to assess the face and content validity of all the potential items (MacKenzie et al., 2011). The authors presented definitions and three dimensions of the CE construct.
To assess the face validity, experts assessed the degree to which each item was representative of a construct’s conceptual definition and its dimensions. Experts rated each item as ‘‘clearly representative,’’ ‘‘somewhat representative,’’ or ‘‘not representative (Zaichkowsky, 1985). The content validity of the items was determined by experts (Churchill, 1979). The experts used the construct definition to rate the relevance of each item in relation to what it was intended to measure, they were also asked if the items belonged to the intended dimensions, and all items represented the CE construct as a whole (MacKenzie et al., 2011).
Double-barrel items connote two or more ideas; thus, they can potentially confuse respondents because respondents do not know which item they are responding to (DeVellis, 2003). All items were examined for double-barreled statements and wording clarity (e. g., reading difficulty, item length, jargon, double negatives, length, redundant wording (DeVellis, 2003). Items with a content validity index (CVI) less than 0.86, and a percentage agreement (PA) less than 80% (Lynn, 1986) were considered for removal.
All items were screened against Vietnamese culture. People who live in Confucian societies are long-term oriented; they value honesty and integrity; and they avoid indulging in opportunism (Ndubisi & Nataraajan, 2018). The experts therefore suggested removing items such as “CustRight,” “Any other,” and “Formal,” since they do not fit with the collective values. Tables 2 and 3 present the qualitative results. Each item was measured on a 5-point Likert scale.
Finally, 11 items were used to design the questionnaire, and EFA and CFA were performed using empirical data.
2.2 Study 2: Scale purification, stability, and dimensionality
In Study 1, field experts and academics collaborated to assess, refine, and extend a set of items and conduct pilot testing on a relevant population, as recommended by Netemeyer et al. (2003). This purification step helped the authors remove items that did not meet certain psychometric criteria, such as avoidance of cross loadings, factor loadings ranging between .40 and .90, corrected item-to-total correlations of .50 and above (Robinson et al., 1991) and reduced the set of items to a more manageable number.
2.2.1 Data collection procedure
Ho Chi Minh City is an ideal place for data collection, as it is a complex melting pot of cultural values situated across the north and south of Vietnam (Wyatt, 2020), with a population of approximately 9 million (General Statistics Office of Vietnam, 2019). The Ho Chi Minh City Statistical Office supervised the data collection process and ensured overall quality. All interviewers received training from the Statistical Office before conducting face-to-face interviews with customers who had visited a retail store at least twice. Utilizing the mall-intercept survey technique (Bush & Hair, 1985), interviewers selected participants at retail store, shopping mall and supermarket entrances in 19 districts in Ho Chi Minh City. The interviewers explained the purpose of the survey to the participants and assured them that personal information would not be disclosed.
Non-probability sampling methods with a priori (in case of quota sampling) was recommended by researchers as well as major research organizations (Sarstedt et al., 2018). The quota sampling technique with a priori was applied in this study with such quota controls as sex, age, and social class per Stephan and McCarthy’s (1958) recommendation, as this technique results in a representative sample of the population (Kalton, 2019). This technique was also widely employed in consumer research (Buil et al., 2013; Helm et al., 2020; Wongprawmas & Canavari, 2017).
In this study, the sample characteristics such as gender ratio, age group, and income were fixed to match the figures from the 2019 Population and Housing Census (General Statistics Office of Vietnam, 2019). Thus, the sample was approximately representative of the population of Ho Chi Minh City.
Data for Studies 2 and 3 were collected in May and June 2020, respectively. The data for Study 4 were collected 2 months after Studies 2 and 3 to limit environmental effects on data collection.
2.2.2 Sample demographic characteristics
As shown in Table 4, the samples for Studies 2 and 3 consisted of 48.92% male and 51.08% female respondents. In terms of age, Studies 2 and 3 included respondents 18–29 years of age (29.02%), 30–49 years of age (42.95%), and 50 years of age and older (28.03%). According to Das (2018), more than half of the city’s residents had an average monthly income between VND 5.7 million and VND 11.37 million (i. e., USD 250–500). Thus, 49.42% of the participants in Studies 2 and 3 had a monthly income between VND 5 million and VND 10 million.
Table 4. Demographic Characteristics of Survey Participants
|
Variable |
Studies 2 and 3 |
Study 4 |
||
|
N = 603 |
N = 450 |
|||
|
Quantity |
% |
Quantity |
% |
|
|
Gender |
||||
|
Male |
295 |
48.92 |
219 |
48.67 |
|
Female |
307 |
51.08 |
231 |
51.33 |
|
Marital status |
||||
|
Single |
217 |
35.99 |
202 |
44.89 |
|
Marriage |
386 |
64.01 |
248 |
55.11 |
|
Age |
||||
|
18-29 |
175 |
29.02 |
135 |
30.00 |
|
30–49 |
259 |
42.95 |
194 |
43.11 |
|
50–64 |
135 |
22.39 |
101 |
22.44 |
|
Above 65 |
34 |
5.64 |
20 |
4.45 |
|
Income (million VND) |
||||
|
Under 5 |
112 |
18.57 |
82 |
18.22 |
|
5-10 |
298 |
49.42 |
222 |
49.33 |
|
10-20 |
75 |
12.44 |
56 |
12.44 |
|
20-30 |
83 |
13.76 |
62 |
13.78 |
|
Above 30 |
35 |
5.80 |
28 |
6.22 |
|
Occupation |
||||
|
Student |
120 |
19.90 |
90 |
20.00 |
|
State sector employee |
163 |
27.03 |
125 |
27.78 |
|
Private sector employee |
183 |
30.35 |
135 |
30.00 |
|
Self-employed |
105 |
17.41 |
83 |
18.44 |
|
Other |
32 |
5.31 |
17 |
3.78 |
|
Education background |
||||
|
Less than undergraduate |
146 |
24.21 |
110 |
24.44 |
|
Undergraduate |
355 |
58.57 |
260 |
57.78 |
|
Post graduate |
102 |
16.92 |
80 |
17.78 |
2.2.3 Exploratory factor analysis results
In total, 700 questionnaires were distributed, and 603 valid questionnaires were randomly split into two sub-samples. The first sample (N = 251) was used for EFA in Study 2. The second sample (N = 352) was used for CFA in Study 3. This sample satisfied the minimum sample requirement for CFA (ten observations for each measurement item), as suggested by Hair et al. (2010). The data collected for Studies 2 and 3 were normally distributed, and the skewness and kurtosis of the measurement items were within the recommended ranges of three and eight, respectively (Kline, 2011).
To allow for high-quality EFA decisions, the authors employed principal axis factoring (PAF) with the oblique rotation (Promax) technique (Conway & Huffcutt, 2003), using IBM SPSS 24 to produce a simple factor structure. The final EFA, with ten items (one item with a factor loading below 0.50 was eliminated), produced a two-factor solution [eigenvalues > 1.0, per Kaiser (1960); Kaiser-Meyer-Olkin Measure of Sampling Adequacy, KMO = .815, which is greater than the recommended value (.50); Bartlett’s test of sphericity is significant, p = .000; see Tabachnick & Fidell, 2007]. The two extracted factors explained 50.78% of the variance.
The ten items in the extended CEI had no cross-loading, and communalities were between .400 and .689, in the range of .40 to .90. The items total correlation ranged from .544 to .715, above the threshold value of .50 (Robinson et al., 1991). Cronbach’s alpha values for the full scale were .839, .780, and .853, respectively, for each factor, as depicted in Table 5. These values were above the threshold value of .70, as recommended by Hair et al. (2010).
2.3 Study 3: Reliability assessment and validation
2.3.1 Reliability, convergent, and discriminant validity testing
The extended CEI satisfied the requirements for reliability, convergent validity, and discriminant validity. Content validity was confirmed by the expert panels assembled in Study 1. Cronbach’s alpha values for the full scale were .865, .858, and .874, respectively, for the individual factors, as presented in Table 5. Moreover, the CR benchmark in Table 5 exceeded the .60 threshold, indicating the reliability of the construct. All standardized factor loadings presented in Table 5 were greater than or equal to .50 and statistically significant (p < .01). Moreover, the AVEs of the two dimensions were .598 and .535, respectively, and the values exceeded the .50 threshold. Thus, convergent validity is established. According to the results shown in Table 6, discriminant validity was confirmed as all HTMT (Heterotrait-Monotrait ratio) values were < .85 (Henseler et al., 2015).
Table 5. Results of EFA and CFA
|
EFA |
CFA |
||
|
Items |
Loading |
Standardized factor loading |
Reliability |
|
Intransigence |
|||
|
α = .780 |
α = .858 |
||
|
Empathy |
.728 |
.756 |
CR = .856 AVE = .598 |
|
Perfect |
.728 |
.797 |
|
|
Deserve |
.595 |
.765 |
|
|
Answer |
.664 |
.775 |
|
|
Demand and distinction |
|||
|
α = .853 |
α = .874 |
||
|
Exclusive |
.799 |
.847 |
CR = .870 AVE = .535 |
|
Best service |
.709 |
.777 |
|
|
Whim |
.880 |
.867 |
|
|
Info update |
.630 |
.740 |
|
|
Average |
.641 |
.548 |
|
|
Attention |
.565 |
.537 |
|
|
Criteria |
α > .70; Standardized factor loading ≥ .50 (Hair et al., 2010); CR > .60 (Bagozzi and Yi, 1988); AVE > .50 (Fornell & Larcker, 1981) |
||
Note. AVE = Average variance extracted; CR = Composite reliability; α = Cronbach alpha
Table 6. HTMT Ratio
|
Factors |
1 |
2 |
|
1. Demand and distinction |
|
|
|
2. Intransigence |
0.430 |
|
2.3.2 Scale dimensionality
Common method bias (CMB) was tested in the second sample of 352 participants using Harman’s single-factor test (Podsakoff & Organ, 1986). The results showed that the data were not problematic because the test extracted 37.70% of the variance, which is below the threshold of 50%, as recommended by Podsakoff et al. (2003).
Next, the two-factor structure of EFA in the previous stage was rigorously tested and validated by conducting CFA with another independent sample, using AMOS 24. The results of the fit indices indicated a good model fit (χ2 = 100.260; df = 32; χ2/df = 3.133; TLI = .949; CFI = .964; RMSEA = .078; GFI = .949; Table 8) and supported the two-factor model (Hair et al., 2010).
The extended CEI presented in Table 7 has two factors: intransigence, and demand and distinction. The intransigence dimension of the extended CEI for the Vietnam retailing industry has four items (empathy, perfect, answer, deserve); this is identical to the CEI intransigence dimension for a French sample (Butori, 2010). The “formal” item was eliminated, as special treatment may cause customers to feel embarrassed or uncomfortable (De Wulf et al., 2001). Consistent with the other-oriented attributes of collectivism, individuals tend to care, adjust, and promote relations with others (Miyamoto et al., 2018); possess collective values; and strive for social harmony (Le & Ho, 2020). Customers with a long-term oriented relationship tendency tend to show more empathy, which is defined as “putting oneself in another’s position” (Ndubisi & Nataraajan, 2018). This explains why the “Know” items were removed.
Table 7. Factors Extracted in the CEI in Different Samples
|
French sample |
United State sample |
Vietnamese sample |
||||
|
Factor 1 (Demand) |
Factor 2 (Intransigence) |
Factor 1 (Distinction) |
Factor 2 (Demand) |
Factor 3 (Intransigence) |
Factor 1 (Intransigence) |
Factor 2 (Demand and distinction) |
|
Whim Exclusive CustRight Know |
Empathy Perfect Answer Formal Deserve |
Any other Average Attention |
Whim Exclusive CusRight |
Empathy Perfect Formal |
Empathy Perfect Answer Deserve |
Exclusive Best service Whim Info update Average Attention |
Source: Butori (2010) and current study
High-quality products and services are associated with status and social recognition (Phau et al., 2009). Items such as “whim,” “exclusive,” “best service,” and “info update” portray demanding consumers who proactively seek top-quality service (Butori, 2010). Two items, namely “average” and “attention,” belong to the (distinction) dimension, representing the propensity to expect treatment that is regarded as special in the eyes of those consumers who desire it (Butori, 2010). These consumers reflect the salience of public self-image or “face” concerns in the context of social interactions in Confucian cultures (Ekiz & Au, 2011; Le & Ho, 2020). However, the importance of personal values tends to vary according to culture (Ladhari et al., 2011). People who live in Confucian societies do not want to express their personal values (Shao & Perkins, 2017). Scale dimensionality may differ due to the variance of customer service norms and consumers’ expectations across cultures (Butori, 2010). For such a society, the “distinction” dimension of the original CEI may be unclear. Thus, consumers in Vietnam combine the “demand” and “distinction” dimensions, without any clear distinction between the two.
2.3.3 Competing models
A series of competing models were then compared. They included the (1) null model, (2) unidimensional model (all items loaded onto a single factor), (3) two uncorrelated factor models, and (4) two correlated factor models. The statistical significance of the χ 2 difference test was used as the criterion for identifying the model with the best fit (Hair et al., 2010). The results shown in Table 8 confirm that the two-factor correlated model is the best approximation to the data, and it can safely be used to capture CE in the Vietnamese retail context.
Table 8. CFA Results for the Competing Models
|
Model |
χ2 |
df |
Δ χ2 |
Δ df |
χ2/df |
TLI |
CFI |
RMSEA |
GFI |
|
Null |
1944.799 |
45 |
- |
- |
43.218 |
0 |
0 |
.347 |
.374 |
|
One factor |
628.680 |
34 |
1316.119*** |
11 |
18.491 |
.586 |
.687 |
.223 |
.676 |
|
Two-uncorrelated |
157.253 |
34 |
471.427*** |
0 |
4.625 |
.914 |
.935 |
.102 |
.924 |
|
Two-correlated |
100.260 |
32 |
56.993*** |
2 |
3.133 |
.949 |
.964 |
.078 |
.949 |
|
Criteria |
χ2/df < 5 acceptable; < 3 good; TLI > .90; CFI > .90; GFI > .80 acceptable; |
||||||||
Note. *** p < .01; χ2 = Chi square, df = Degrees of freedom; TLI = Tucker–Lewis index; CFI = Comparative fit index; GFI = Goodness of fit index; RMSEA = Root mean square error of approximation.
2.3.4 Second-order model assessment
CE was originally conceptualized as a first-order construct (Boyd & Helms, 2005) as well as a second-order construct (Butori, 2010). CFA results confirmed CE as a two-factor second-order construct. In addition, the factor loadings for the higher-order factors were .573 and .532, respectively. Moreover, significant correlations were found between CE and its dimensions (all regression paths were significant at the .01 level). Thus, CE is a higher-order construct explained by the two related dimensions.
2.4 Study 4: Nomological validity
The authors employed the covariance-based SEM to perform nomological validation and model testing (Chen et al., 2014) of the extended CEI. All scales in Study 4, including Yi and Jeon’s (2003) 5-item consumer loyalty scale, Lacey et al.’s (2007) 5-item measure of preferential treatment, and Abdul-Talib et al.’s (2016) 4-item willingness to boycott measure, were also verified and slightly modified to fit the research context (see Table A1 in the Appendix). Abdul-Talib et al.’s (2016) willingness to boycott measure was tested in China, which has a Confucian culture, and used in Malaysia, which is a multi-religion, multi-cultural country (Abdul-Latif & Abdul-Talib, 2017). All measures were captured using a 5-point Likert scale.
2.4.1 Data collection process
As recommended by Podsakoff et al. (2012), to minimize potential CMB, the authors conducted a two-wave data collection process for Study 4. The first wave included consumer loyalty, preferential treatment, and an extended CEI with demographic questions. Two weeks later, the second wave included willingness to boycott, with demographic questions. After data screening, 450 valid responses were included in the SEM estimation. A sample size of 450 fits the 10:1 ratio, as suggested by Hair et al. (2010).
3. Hypotheses Development
Preferential treatment is defined as a marketing tactic that involves giving selected customers enhanced social status, recognition, and extra service levels (De Wulf & Odekerken-Schroder, 2003). In line with the rank equilibrium norm of the social exchange theory (SET), high-ranking customers in the context of the company’s hierarchy will feel entitled to claim benefits that are commensurate with their status (Cropanzano & Mitchell, 2005). Preferential treatment from retailers is given within a small group of customers, thus enhancing those customers’ sense of superiority and importance, and resulting in CE (Davis, 2019; Wetzel et al., 2014). Thus, the following hypothesis is proposed:
H1: Preferential treatment has a positive effect on CE.
Customer loyalty is defined as “the strength of the relationship between an individual’s relative attitude and repeat patronage” (Dick & Basu, 1994, p. 99). The SET reciprocity norm (Gouldner, 1960) posits that exchange partners feel entitled to receive a reward in return for their beneficial behaviors (Cropanzano & Mitchell, 2005). Collectivist buyers expect retailers to reward their loyalty (Eng & Jin Kim, 2006), and loyal customers’ high reward expectations translate into a sense of entitlement. (Li et al., 2017).
Based on the SET rank equilibrium norm (Cropanzano & Mitchell, 2005), loyal customers consider themselves members of high-powered distance groups, perceive lower service quality (Ladhari et al., 2011), and due to their power, feel entitled to demand extra effort and benefits from retailers (Ma et al., 2018). Hence, the authors propose the following hypothesis:
H2: Customer loyalty has a positive effect on CE.
Boycotting is the act of ceasing to purchase a retailer’s products/services when a customer disagrees with a specific action or set of actions taken by the company (Klein et al., 2004). Loyal customers have high reward expectations and strong negotiation power, which leads to CE (Li et al., 2017). They tend to control and shape rewards, costs, and punishments (Emerson, 1962). When a customer feels that their investment is not in balance with the outcome, their perception of inequality arises, resulting in dissatisfaction, anger, and tension in the relationship (Adams, 1965). As a tactic to influence the retailer to make policy changes (Yuksel, 2013), loyal customers may adopt boycotting as a self-enhancement tool (Klein et al., 2004), forcing a retailer to fulfill their request.
According to the SET rank equilibrium norm (Cropanzano & Mitchell, 2005), special treatment from a retailer can trigger an ego-focused and self-centered attitude that leads to CE (Wetzel et al., 2014). Customers who display entitlement and are driven by belief in their deservingness may demand extremely high benefits and rewards (Edey & Knight, 2018). Moreover, a rising sense of entitlement to better treatment from the retailer has boosted customer retaliatory intentions (Davis, 2019), such as willingness to boycott.
Entitled consumers may be prone to mistrusting the company’s actions (Boyd & Helms, 2005). Individuals with high levels of uncertainty avoidance are willing to boycott as a risk-reducing coping strategy, forcing retailers to comply with the relevant regulation(s) (Hoffmann, 2014). CE is an antecedent to emotional outbursts or extreme complaining behaviors (Boyd & Helms, 2005). In Confucian cultures, consumers may try to avoid direct confrontation with retailers (Ekiz & Au, 2011). Utilizing an avoidance approach (Carver & Connor Smith, 2010) or “exit” strategies (Hirschman, 1970), customers may boycott after experiencing a negative emotion; this is done to seek psychological balance and return to a normal state (Le & Ho, 2020) by venting their displeasure with the retailer (Brennan & Lomasky, 1997). Based on the above argument, the authors propose the following hypothesis:
H3: CE has a positive effect on willingness to boycott.
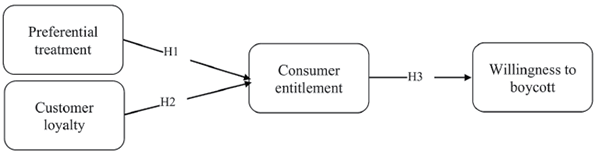
Figure 1. Research Model
4. Results
4.1 SEM analysis
All scales in Study 4 were also checked with EFA to test the underlying dimensions of the construct. The EFA produced a five-factor solution, all items loaded in to intended constructs and dimensions [eigenvalues > 1.0, per Kaiser, 1960; KMO = .909; Bartlett’s test of sphericity is significant, p = .000; see Tabachnick & Fidell, 2007]. The five-factors extracted explained 62.45% of the variance.
The data are normally distributed and appropriate for SEM estimation, as the skewness values ranged from -.481 to .169 and the kurtosis values ranged from -.809 to .132 within the recommended range of 3 and 8, respectively (Kline, 2011). The study followed the two-step procedure recommended by Anderson and Gerbing (1988): first, the authors conducted CFA to access the construct validity and reliability in the measurement model; then, the structural model was accessed and used to test the hypotheses.
4.1.1 Measurement model
The measurement model indicated an acceptable fit to the empirical data. All of the fit indices in Table 9 exceeded the recommended threshold levels.
Table 9. Measures of the Model Fit
|
Model fit |
|
χ 2/df |
RMSEA |
TLI |
CFI |
GFI |
|
Measurement model |
χ2 = 805.197 df = 244 |
3.300 |
.072 |
.906 |
.917 |
.871 |
|
Structural model |
χ2 = 832.656 df = 246 |
3.385 |
.073 |
.903 |
.913 |
.865 |
|
Single factor model |
χ2 = 3710.055 df = 252 |
14.722 |
.175 |
.439 |
.488 |
.508 |
4.1.2 Reliability, convergent, and discriminant validity
All the standardized factor loading estimates shown in Table 10 were greater than .50 and statically significant (p < .01). The AVE of all constructs except CE were greater than .50. In the case of the AVE of CE, the value was less than .50, but the CR was greater than .60; thus, the convergent validity of the construct is still adequate (Fornell & Larcker, 1981). This clearly demonstrates evidence of convergent validity, and the CR scores exceeded the threshold of .60. Moreover, the Cronbach’s alpha values shown in Table 10 ranged from .848 to .946 (> .70), suggesting the reliability of the constructs. The scale’s discriminant validity was satisfied as per Henseler et al. (2015) criteria as presented in Table 10.
Table 10. Construct Validity and Reliability
|
Construct |
Items |
Standardized factor |
Reliability |
|
Preferential treatment |
pref1 |
.761 |
α = .893 CR = .893 AVE = .626 |
|
pref2 |
.764 |
||
|
pref3 |
.800 |
||
|
pref4 |
.810 |
||
|
pref5 |
.819 |
||
|
Customer loyalty |
loy1 |
.744 |
α = .861 CR = .862 AVE = .555 |
|
loy2 |
.717 |
||
|
loy3 |
.786 |
||
|
loy4 |
.747 |
||
|
loy5 |
.728 |
||
|
CE |
Intransigence |
.529 |
α = .858 CR = .603 AVE = .440 |
|
Demand and distinction |
.775 |
||
|
Intransigence |
Empathy |
.732 |
α = .848 CR = .849 AVE = .584 |
|
Perfect |
.787 |
||
|
Deserve |
.771 |
||
|
Answer |
.765 |
||
|
Demand and distinction |
Exclusive |
.792 |
α = .859 CR = .861 AVE = .511 |
|
Best service |
.759 |
||
|
Whim |
.808 |
||
|
Info update |
.718 |
||
|
Average |
.595 |
||
|
Attention |
.579 |
||
|
Willingness to boycott |
boyc1 |
.894 |
α = .946 CR = .947 AVE = .816 |
|
boyc2 |
.916 |
||
|
boyc3 |
.896 |
||
|
boyc4 |
.907 |
Table 11. HTMT Ratio
|
|
1 |
2 |
3 |
4 |
|
1. Willingness to boycott |
|
|
|
|
|
2. Preferential treatment |
0.416 |
|
|
|
|
3. Loyalty |
0.222 |
0.520 |
|
|
|
4. CE |
0.460 |
0.619 |
0.686 |
|
4.1.3 Common method bias
Harman’s single-factor test extracted 36.18% of the variance, below the recommended 50% (Podsakoff et al., 2003). The CFA results of Harman’s single-factor test revealed that the single-factor model in Table 9 fit the data poorly, which confirms the non-existence of CMB.
4.2 Structural model assessment and hypotheses testing
4.2.1 Testing the hypothesized relationships
As demonstrated in Table 12, all hypotheses were supported at the .01 significance level. Preferential treatment (β = 0.537) and customer loyalty (β = 0.393) have significant and positive impacts on CE. Therefore, H1 and H2 were supported. CE (β = 0.523) has a significant and positive impact on willingness to boycott. Therefore, H3 was supported.
Table 12. Results of Path Analysis
|
Hypothesis |
Standardized |
Unstandardized |
S. E. |
Critical |
p-value |
Results |
|
H1 |
.537 |
.257 |
.039 |
6.611 |
*** |
Supported |
|
H2 |
.393 |
.192 |
.035 |
5.576 |
*** |
Supported |
|
H3 |
.523 |
1.734 |
.248 |
7.000 |
*** |
Supported |
Note. *** p < .001
4.2.2 Variance explained by model
As presented in Figure 2, 65.90% of the variance in CE is explained by preferential treatment and customer loyalty (CE is explained by 26.30% of the variance in intransigence, and 77.90% of the variance in demand and distinction). In addition, 27.30% of the variance in willingness to boycott is explained by CE and is in the acceptable range (R2 > .25; see Nunnally & Bernstein, 1994).
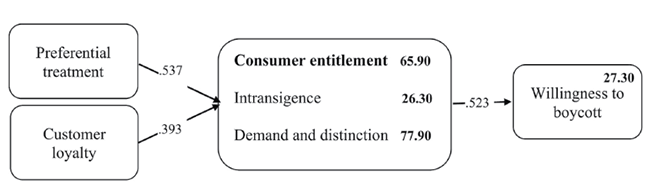
Figure 2. Standardized Coefficients and R-squares (bold value)
5. Conclusion
The original CEI has not yet been used in the context of Vietnam. In the Vietnamese retail context, the extended (10-item) CEI was developed with two dimensions: intransigence, and demand and distinction. “Demand and distinction” is a compound dimension, as in Butori (2010), due to the variation in Vietnamese customers’ expectations and their propensity to expect special treatment. Thus, the CEI was enriched with items reflecting the uncertainty avoidance tendency (Diallo & Seck, 2018), such as the demand for information updates and the best service quality.
Study 4 results confirmed the positive relationship between preferential treatment and CE (Davis, 2019; Wetzel et al., 2014), and customer loyalty and CE (Li et al., 2017). In addition, this study explored and confirmed the positive link between CE and willingness to boycott.
5.1 Theoretical implications
Overall, our results have seven main theoretical implications.
First, this study is the initial attempt to extend the original CEI and empirically verify the applicability and generalizability of the extended CEI to the context of Vietnam, an emerging economy with a Confucian culture (Le & Ho, 2020). This project contributes to the further development of the entitlement concept, providing a holistic view of the nature of this concept in both the West and the East. The extension of the scale in this project through four studies proves that measurement scales that were constructed based on Western cultural contexts may need to undergo a slight modification before being applied to a non-Western cultural context as Abdul-Latif and Abdul-Talib (2017) recommend. All items in the scale considered the cultural gap between East and West as they were screened against the Vietnamese society’s collectivist and Confucian cultures values (Walker & Wang, 2008). This explained why some items were removed or reworded to comply with these cultural values; the final scale is considered suitable for the Vietnamese cultural context. In addition, the study offers a chance to apply the extended CEI to other countries and economies with similar traits to better understand the CE construct in such countries.
Second, from a methodological perspective, the four studies include qualitative insights in the form of FGDs with academic experts and consumers. Two quantitative studies from a relevant population confirm the reliability and validity of the extended CEI. Drawing from the qualitative results, the original CEI was supplemented with items that capture the demand for the best quality of service, based on customers’ uncertainty avoidance tendency in the context of an emerging economy (Diallo & Seck, 2018). In addition, the influence of collectivist culture leads some customers to demand information updates to reduce uncertainty so that they can make better decisions (Diallo & Seck, 2018). This study supplements the original scale with two items that reflect the entitlement of customers in the retail sector and utilizes the extended CEI because it is a better fitting metric of CE in Vietnam.
Third, in terms of scale dimensionality, there are two factors of the extended CEI that are particular to the Vietnamese retail context: (1) intransigence and (2) demand and distinction. Scale dimensionality may differ depending on cultural context because of variations in service norms, service expectations (Butori, 2010), and customer quality expectations (Bambauer-Sachse and Rabeson, 2015). The implication of combing the demand and distinction dimensions of the extended CEI illustrates the demand of retail customers in a Vietnamese context, and it captures customers’ tendency to proactively seek the highest quality services as well as customer’s propensity to expect or desire special treatment in such varied dimensions as service information, service level, status, and social recognition (Butori, 2010; Phau et al., 2009).
Fourth, our study findings add to the negative outcomes on the customer loyalty research stream by confirming the positive relationship between customer loyalty and CE described in a previous study (Li et al., 2017). The basis of this relationship stems from loyal customers’ high reward expectations and strong negotiation power, which can be explained under the SET rank equilibrium norm as well as by the customers’ feeling of being entitled to a reward in exchange for beneficial behaviors, particularly those enumerated in the SET reciprocity norm (Cropanzano & Mitchell, 2005; Gouldner, 1960). These motivations are considered the main source for nurturing CE (Li et al., 2017). Thus, academics and practitioners should be more critical in their development of a more comprehensive picture of customer loyalty outcomes in the context of increasing competitiveness in the retail industry and the growth of consumers’ market power over sellers (Ma et al., 2018).
Fifth, retailers have adopted customer prioritization strategies in the form of tangible rewards, preferential treatment, and perceived status to foster relationships with customers (Ma et al., 2018). This study confirms the positive relationship between preferential treatment and CE in the Vietnamese retail industry. Ma et al. (2018) did not find this positive relationship in the sample of frequent flyer programs in the Chinese airline industry. The current study highlights the downside of customer prioritization strategies, including that preferential treatment by retailers in a competitive environment may reinforce customers’ sense of superiority drawn from the (SET) rank equilibrium norm; this eventually translates into CE as a result, generating unwanted costs and liabilities for firms (Davis, 2019; Wetzel et al., 2014).
Sixth, research on CE and its consequences is still limited (Davis, 2019). This study fills this gap, and in addition to the voiced complaints of loyal customers (Li et al., 2017), this study identifies CE as an important mediator between customer loyalty and willingness to boycott in the retail industry. We extend the concept of entitlement to the context of the buyer–seller relationship and introduce willingness to boycott as an important outcome of entitlement. These findings also enrich the research streams on the negative effects of customer entitlement (Fisk & Neville, 2011; Xia & Kukar-Kinney, 2013; Wetzel et al., 2014).
Finally, this study advances service marketing research by expanding the range of boycott motives posited in Abdul-Talib et al. (2016) and clarifying their mechanism using SET in four ways. First, loyal customers with high reward expectations and strong negotiating power tend to adopt boycotts as a tool for self-enhancement and to force retailers to comply with their demands. Second, special treatment must be used cautiously, as it triggers an ego-focused and self-centered attitude that leads to CE. This entitlement could, in turn, lead to boycott willingness. Third, entitled consumers tend to mistrust retailers’ actions, and in the culture of uncertainty avoidance, customers are willing to boycott a company as a risk-reducing coping strategy, forcing retailers to comply with the relevant regulation(s). Finally, CE is related to emotional outbursts in an attempt to reinstate psychological balance after experiencing anger or frustration; entitled customers in Confucian cultures tend to boycott a company to release such negative emotions.
Since CE may present many challenges for retailers and service marketers (Edey & Knight, 2018), it is important to create appropriate marketing strategies aimed at minimizing CE (Wetzel et al., 2014) and identify effective communication styles (Boyd & Helms, 2005). In addition, retailers should manage customers’ expectations carefully (Li et al., 2017), as being boycotted can harm a company’s image and reputation.
5.2 Future scope of the study
Although the extended multi-dimensionality of CEI was supported and tailored to Vietnam’s unique characteristics, the extended CEI needs further validation and confirmation in the context of other cultures with a similar Confucian background and should be extended to a wide range of industries, such as banking and tourism. In addition, relating to the nomological validity, the measure for boycott willingness should be tested in different contexts.
References
Abdul-Latif, S. A., & Abdul-Talib, A. N. (2017). Consumer racism: a scale modification. Asia Pacific Journal of Marketing and Logistics, 29 (3), 616-633. https://doi.org/10.1108/APJML-02-2016-0026
Abdul-Talib, A. N., Abd-Latif, S. A., & Abd-Razak, I. S. (2016). A study on the boycott motivations of Malaysian non-Muslims. Journal of Islamic Marketing, 7 (3), 264-287. https://doi.org/10.1108/JIMA-11-2014-0071
Adam, I., Taale, F., & Adongo, C. A. (2020). Measuring negative tourist-to-tourist interaction: Scale development and validation. Journal of Travel & Tourism Marketing, 37(3), 287-301. https://doi.org/10.1080/10548408.2020.1745731
Adams, J. S. (1965). Inequity in Social Exchange. In Advances in Experimental Social Psychology (Vol. 2, pp. 267-299). Academic Press. https://doi.org/10.1016/S0065-2601(08)60108-2
Anderson, J. C., & Gerbing, D. W. (1988). Structural equation modeling in practice: A review and recommended two-step approach. Psychological Bulletin, 103(3), 411.
Bagozzi, R. P., & Yi, Y. (1988). On the evaluation of structural equation models. Journal of the Academy of Marketing Science, 16(1), 74-94. https://doi.org/10.1007/BF02723327
Bambauer-Sachse, S., & Rabeson, L. (2015). Determining adequate tangible compensation in service recovery processes for developed and developing countries: The role of severity and responsibility. Journal of Retailing and Consumer Services, 22, 117-127. https://doi.org/10.1016/j.jretconser.2014.08.001
Boyd III, H. C., & Helms, J. E. (2005). Consumer entitlement theory and measurement. Psychology & Marketing, 22(3), 271-286. https://doi.org/10.1002/mar.20058
Brennan, G., & Lomasky, L. (Eds.). (1997). Democracy and Decision: The Pure Theory of Electoral Preference. Cambridge, England: Cambridge University Press.
Brislin, R. W. (1986). The wording and translation of research instruments. In W. J. Lonner & J. W. Berry (Eds.), Cross-cultural Research and Methodology Series, Vol. 8. Field methods in cross-cultural research (p. 137–164). Beverly Hills, CA: Sage Publications.
Buil, I., Martínez, E., & De Chernatony, L. (2013). The influence of brand equity on consumer responses. Journal of Consumer Marketing, 30(1), 62-74. https://doi.org/10.1108/07363761311290849
Bush, A. J., & Hair Jr, J. F. (1985). An assessment of the mall intercept as a data collection method. Journal of Marketing Research, 22(2), 158-167. https://doi.org/10.1177/002224378502200205
Butori, R. (2010). Proposition for an improved version of the consumer entitlement inventory. Psychology & Marketing, 27(3), 285-297. https://doi.org/10.1002/mar.20327
Carver, C. S., & Connor-Smith, J. (2010). Personality and coping. Annual Review of Psychology, 61, 679-704.
Chen, Y. P., Shaffer, M., Westman, M., Chen, S., Lazarova, M., & Reiche, S. (2014). Family role performance: Scale development and validation. Applied Psychology, 63(1), 190-218. https://doi.org/10.1111/apps.12005
Churchill Jr, G. A. (1979). A paradigm for developing better measures of marketing constructs. Journal of Marketing Research, 16(1), 64-73. https://doi.org/10.1177/002224377901600110
Conway, J. M., & Huffcutt, A. I. (2003). A review and evaluation of exploratory factor analysis practices in organizational research. Organizational Research Methods, 6(2), 147-168. https://doi.org/10.1177/1094428103251541
Cooper, D. R., & Schindler, P. S. (2003). Business Research Methods (8th ed.). Boston, Mass.: McGraw-Hill/Irwin.
Cropanzano, R., & Mitchell, M. S. (2005). Social exchange theory: An interdisciplinary review. Journal of Management, 31(6), 874-900. https://doi.org/10.1177/0149206305279602
Das, K. (2018, March 12). Vietnam: HCM city leads the average salary rankings. Vietnam Briefing. Retrieved from https://www.vietnam-briefing.com
Davis, S. V. (2019). The Effect of Customer Prioritization Strategy on Customer Entitlement. Academy of Marketing Studies Journal, 23(4), 1-15.
De Wulf, K., & Odekerken-Schröder, G. (2003). Assessing the impact of a retailer’s relationship efforts on consumers’ attitudes and behavior. Journal of Retailing and Consumer Services, 10(2), 95-108. https://doi.org/10.1016/S0969-6989(02)00013-9
De Wulf, K., Odekerken-Schröder, G., & Iacobucci, D. (2001). Investments in consumer relationships: A cross-country and cross-industry exploration. Journal of Marketing, 65(4), 33-50. https://doi.org/10.1509/jmkg.65.4.33.18386
DeVellis, R. F. (2003). Scale Development: Theory and Applications (2nd ed.). Thousand Oaks: Sage Publications.
Diallo, M. F., & Seck, A. M. (2018). How store service quality affects attitude toward store brands in emerging countries: Effects of brand cues and the cultural context. Journal of Business Research, 86, 311-320. https://doi.org/10.1016/j.jbusres.2017.08.017
Dick, A. S., & Basu, K. (1994). Customer loyalty: toward an integrated conceptual framework. Journal of the Academy of Marketing Science, 22(2), 99-113. https://doi.org/10.1177/0092070394222001
Edey, P. & Knight, J. (2018). Profiling the entitled consumer when individualism and collectivism are co-dominant. Journal of Retailing and Consumer Services, 42, 98–106. https://doi.org/10.1016/j.jretconser.2018.02.001
Ekiz, E. H., & Au, N. (2011). Comparing Chinese and American attitudes towards complaining. International Journal of Contemporary Hospitality Management, 23(3), 327-343. https://doi.org/10.1108/09596111111122514
Emerson, R. M. (1962). Power-dependence relations. American Sociological Review, 31-41.
Eng, T. Y., & Jin Kim, E. (2006). An examination of the antecedents of e-customer loyalty in a Confucian culture: The case of South Korea. The Service Industries Journal, 26(4), 437-458. https://doi.org/10.1080/02642060600622314
Fisk, G. M., & Neville, L. B. (2011). Effects of customer entitlement on service workers’ physical and psychological well-being: A study of waitstaff employees. Journal of Occupational Health Psychology, 16(4), 391. https://doi.org/10.1037/a0023802
Fornell, C., & Larcker, D. F. (1981). Evaluating structural equation models with unobservable variables and measurement error. Journal of Marketing Research, 18(1), 39-50. https://doi.org/10.2307/3151312.
General Statistics Office of Vietnam (2019). Result of Vietnam population and housing census 2019. Retrieved from https://www.gso.gov.vn/default.aspx?tabid=512&idmid=5&ItemID=19446
Gouldner, A. W. (1960). The norm of reciprocity: A preliminary statement. American Sociological Review, 161-178. DOI: 10.2307/2092623
Hair, J. F., Black, W. C., Babin, B. J., Anderson, R. E., & Tatham, R. L. (2010). Multivariate Data Analysis. New Jersy: Pearson Education.
Helm, S., Kim, S. H., & Van Riper, S. (2020). Navigating the ‘retail apocalypse’: a framework of consumer evaluations of the new retail landscape. Journal of Retailing and Consumer Services, 54. https://doi.org/10.1016/j.jretconser.2018.09.015
Henseler, J., Ringle, C. M., & Sarstedt, M. (2015). A new criterion for assessing discriminant validity in variance-based structural equation modeling. Journal of the Academy of Marketing Science, 43(1), 115-135. https://doi.org/10.1007/s11747-014-0403-8
Hirschman, A. O. (1970). Exit, Voice, and Loyalty: Responses to Decline in Firms, Organizations, and States (Vol. 25). Harvard University Press.
Hoffmann, S. (2014). Does national culture impact consumer boycott prevalence? A multi-country study. European Journal of International Management, 8(2), 141-159. https://doi.org/10.1504/EJIM.2014.059580
Kaiser, H. F. (1960). The application of electronic computers to factor analysis. Educational and psychological measurement, 20(1), 141-151. https://doi.org/10.1177/001316446002000116
Kalton, G. (2019). Developments in survey research over the past 60 years: A personal perspective. International Statistical Review, 87, S10-S30. https://doi.org/10.1111/insr.12287
Klein, J. G., Smith, N. C., & John, A. (2004). Why we boycott: Consumer motivations for boycott participation. Journal of Marketing, 68(3), 92-109. https://doi.org/10.1509/jmkg.68.3.92.34770
Kline, R. B. (2011). Principles and Practice of Structural Equation Modeling. New York, NY: Guilford.
Lacey, R., Suh, J., & Morgan, R. M. (2007). Differential effects of preferential treatment levels on relational outcomes. Journal of Service Research, 9(3), 241-256. https://doi.org/10.1177/1094670506295850
Ladhari, R., Pons, F., Bressolles, G., & Zins, M. (2011). Culture and personal values: How they influence perceived service quality. Journal of Business Research, 64(9), 951-957. https://doi.org/10.1016/j.jbusres.2010.11.017
Le, A. N. H., & Ho, H. X. (2020). The behavioral consequences of regret, anger, and frustration in service settings. Journal of Global Marketing, 33(2), 84-102. https://doi.org/10.1080/08911762.2019.1628330
Le, A. T., Nguyen, M. T., Vu, H. T. T., & Thi, T. T. N. (2020). Consumers’ trust in food safety indicators and cues: The case of Vietnam. Food Control, 112, 107162. https://doi.org/10.1016/j.foodcont.2020.107162
Le, N. T. C., & Quy, V. T. (2020). Personal values of luxury services consumption: A Confucian culture perspective. Journal of International Consumer Marketing, 32(4), 300-312. https://doi.org/10.1080/08961530.2020.1712292
Li, X., Ma, B., & Zhou, C. (2017). Effects of customer loyalty on customer entitlement and voiced complaints. The Service Industries Journal, 37(13-14), 858-874. https://doi.org/10.1080/02642069.2017.1360290
Liu, Y., Eisingerich, A. B., Auh, S., Merlo, O., & Chun, H. E. H. (2015). Service firm performance transparency: How, when, and why does it pay off?. Journal of Service Research, 18(4), 451-467. https://doi.org/10.1177/1094670515584331
Lynn, M. R. (1986). Determination and quantification of content validity. Nursing Research, 35(6), 382–385. https://doi.org/10.1097/00006199-198611000-00017
Ma, B., Li, X., & Zhang, L. (2018). The effects of loyalty programs in services–a double-edged sword?. Journal of Services Marketing, 32 (3), 300-310. https://doi.org/10.1108/JSM-06-2016-0227
MacKenzie, S. B., Podsakoff, P. M., & Podsakoff, N. P. (2011). Construct measurement and validation procedures in MIS and behavioral research: Integrating new and existing techniques. MIS Quarterly, 35(2), 293-334.
Malhotra, N. K., & Dash, S. (2010). Marketing Research: An Applied Approach (6th ed.). Pearson- Dorling Kindersely.
Miyamoto, Y., Yoo, J., Levine, C. S., Park, J., Boylan, J. M., Sims, T., Markus, H. R., Kitayama, S., Kawakami, N., Karasawa, M., Coe, C. L., Love, G. D., & Ryff, C. D. (2018). Culture and social hierarchy: Self- and other-oriented correlates of socioeconomic status across cultures. Journal of Personality and Social Psychology, 115(3), 427–445. https://doi.org/10.1037/pspi0000133
Ndubisi, N. O., & Nataraajan, R. (2018). Customer satisfaction, Confucian dynamism, and long‐term oriented marketing relationship: A threefold empirical analysis. Psychology & Marketing, 35(6), 477-487. https://doi.org/10.1002/mar.21100
Netemeyer, R. G., Bearden, W. O., & Sharma, S. (2003). Scaling Procedures: Issues and Applications. Thousand Oaks, Calif: Sage Publications.
Nunnally, J. C., & Bernstein, I. H. (1994). Psychometric Theory (3rd ed). New York: McGraw-Hill.
Nyumba, T. O., Wilson, K., Derrick, C. J., & Mukherjee, N. (2018). The use of focus group discussion methodology: Insights from two decades of application in conservation. Methods in Ecology and Evolution, 9(1), 20-32. https://doi.org/10.1111/2041-210X.12860
Phau, I., Teah, M., & Lee, A. (2009). Targeting buyers of counterfeits of luxury brands: A study on attitudes of Singaporean consumers. Journal of Targeting, Measurement and Analysis for Marketing, 17(1), 3-15. https://doi.org/10.1057/jt.2008.25
Podsakoff, P. M., & Organ, D. W. (1986). Self-reports in organizational research: Problems and prospects. Journal of Management, 12(4), 531-544. https://doi.org/10.1177/014920638601200408
Podsakoff, P. M., MacKenzie, S. B., & Podsakoff, N. P. (2012). Sources of method bias in social science research and recommendations on how to control it. Annual Review of Psychology, 63, 539-569. https://doi.org/10.1146/annurev-psych-120710-100452
Podsakoff, P. M., MacKenzie, S. B., Lee, J. Y., & Podsakoff, N. P. (2003). Common method biases in behavioral research: a critical review of the literature and recommended remedies. Journal of Applied Psychology, 88(5), 879.
Riefler, P., & Diamantopoulos, A. (2007). Consumer animosity: A literature review and a reconsideration of its measurement. International Marketing Review, 24 (1), 87-119. https://doi.org/10.1108/02651330710727204
Robinson, J. P., Shaver, P. R., & Wrightsman, L. S. (1991). Criteria for scale selection and evaluation. Measures of Personality and Social Psychological Attitudes, 1(3), 1-16.
Sarstedt, M., Bengart, P., Shaltoni, A. M., & Lehmann, S. (2018). The use of sampling methods in advertising research: A gap between theory and practice. International Journal of Advertising, 37(4), 650-663. https://doi.org/10.1080/02650487.2017.1348329
Shao, W., & Perkins, H. (2017). Taoist and Confucian values evident in the travel motivations of contemporary Chinese tourists: The importance of self-cultivation. Journal of China Tourism Research, 13(3), 276-297. https://doi.org/10.1080/19388160.2017.1397579
Stephan, F. F. & McCarthy, P. J. (1958). Sampling Opinions. An Analysis of Survey Procedures. New York: John Wiley & Sons.
Tabachnick, B. G., & Fidell, L. S. (2007). Using Multivariate Statistics. PsycCRITIQUES (5th ed., Vol. 28). Boston, MA: Pearson Education Inc. http://doi.org/10.1037/022267
Voss, C. A., Roth, A. V., Rosenzweig, E. D., Blackmon, K., & Chase, R. B. (2004). A tale of two countries’ conservatism, service quality, and feedback on customer satisfaction. Journal of Service Research, 6(3), 212-230. https://doi.org/10.1177/1094670503260120
Walker, G. J., & Wang, X. (2008). The meaning of leisure for Chinese/Canadians. Leisure Sciences, 31(1), 1-18. https://doi.org/10.1080/01490400802557907
Wetzel, H. A., Hammerschmidt, M., & Zablah, A. R. (2014). Gratitude versus entitlement: A dual process model of the profitability implications of customer prioritization. Journal of Marketing, 78(2), 1-19. https://doi.org/10.1509/jm.12.0167
Wongprawmas, R., & Canavari, M. (2017). Consumers’ willingness-to-pay for food safety labels in an emerging market: The case of fresh produce in Thailand. Food Policy, 69, 25-34. https://doi.org/10.1016/j.foodpol.2017.03.004
Wu, Z., Ann, T. W., & Shen, L. (2017). Investigating the determinants of contractor’s construction and demolition waste management behavior in Mainland China. Waste Management, 60, 290-300. https://doi.org/10.1016/j.wasman.2016.09.001
Wyatt, G. (2020). The Phenomenology of Traffic: Experiencing Mobility in Ho Chi Minh City. Routledge.
Xia, L., & Kukar-Kinney, M. (2013). Examining the penalty resolution process: Building loyalty through gratitude and fairness. Journal of Service Research, 16(4), 518-532. https://doi.org/10.1177/1094670513481109
Yi, Y., & Jeon, H. (2003). Effects of loyalty programs on value perception, program loyalty, and brand loyalty. Journal of the Academy of Marketing Science, 31(3), 229-240. https://doi.org/10.1177/0092070303031003002
Yuksel, U. (2013). Non-participation in anti-consumption: Consumer reluctance to boycott. Journal of Macromarketing, 33(3), 204-216. https://doi.org/10.1177/0276146713484153
Zaichkowsky, J. L. (1985). Measuring the involvement construct. Journal of Consumer Research, 12(3), 341-352. https://doi.org/10.1086/208520
Appendix
Table A1. Measurement Scales
|
Construct |
Author |
Items |
Code |
|
Preferential treatment
|
Lacey et al. (2007) |
pref1 |
This store does things for me that they don’t do for most customers. |
|
pref2 |
This store gives me special things that most customers don’t get. |
||
|
pref3 |
This store gives me faster service than most customers get. |
||
|
pref4 |
This store gives me better treatment than most customers get. |
||
|
pref5 |
This store usually places me higher on the priority list when dealing with other customers. |
||
|
Loyalty |
Yi and Jeon (2003) |
loy1 |
I like this store more than other stores. |
|
loy2 |
I have a strong preference for this store. |
||
|
loy3 |
I give prior consideration to this store when I have a need for a product (service) of this type. |
||
|
loy4 |
I would recommend this store to others. |
||
|
loy5 |
I claim more efforts from this store than most other. |
||
|
Willingness to boycott |
Abdul-Talib et al. (2016) |
boyc1 |
I would feel guilty if I bought a product from this store. |
|
boyc2 |
I would never buy anything from this store. |
||
|
boyc3 |
Whenever possible, I avoid buying products/services at this store. |
||
|
boyc4 |
I do not like the idea of owning anything from this store. |