Organizations and Markets in Emerging Economies ISSN 2029-4581 eISSN 2345-0037
2021, vol. 12, no. 2(24), pp. 399–414 DOI: https://doi.org/10.15388/omee.2021.12.62
Is Bitcoin Price Driven by Macro-financial Factors and Liquidity? A Global Consumer Survey Empirical Study
Shinta Amalina Hazrati Havidz (corresponding author)
Finance Program, Accounting Department, Faculty of Economics & Communication, Bina Nusantara University, Indonesia
shinta.h@binus.edu
https://orcid.org/0000-0001-9837-7233
Viendya Ervina Karman
Finance Program, Accounting Department, Faculty of Economics & Communication, Bina Nusantara University, Indonesia
viendya.karman@binus.ac.id
https://orcid.org/0000-0001-5775-2252
Indra Yudha Mambea
School of Business and Management, Institut Teknologi Bandung, Indonesia
indra.yudha@sbm-itb.ac.id
https://orcid.org/0000-0002-2735-3100
Abstract. This research aims to utilize macro-financial and liquidity elements as the factors that may affect the price of Bitcoin as the largest cryptocurrency in terms of market capitalization. The macro-financial factors analyzed in this study were foreign exchange, stock market index, interest rates, and gold, while liquidity ratio is the internal factor. This study applied a fixed-effect model (FEM) and Generalized Method of Moments (GMM) on gathered weekly data from 1 January 2017 to 29 December 2019 from 18 countries with the total of 2,826 observations. The analysis revealed that US Dollar amplifies Bitcoin trading; an increase in interest rate will decrease investors’ intention to invest in Bitcoin as a speculative asset, and gold could replace Bitcoin as a substitute asset. Moreover, Bitcoin was found to be highly liquid, which attracts many investors, while the stock market index proved to be insignificant.
Keywords: cryptocurrency; Bitcoin price; macro-financial factors; liquidity ratio; Global Consumer Survey
Received: 16/2/2021. Accepted: 30/5/2021
Copyright © 2021 Shinta Amalina Hazrati Havidz, Viendya Ervina Karman, Indra Yudha Mambea. Published by Vilnius University Press. This is an Open Access article distributed under the terms of the Creative Commons Attribution Licence, which permits unrestricted use, distribution, and reproduction in any medium, provided the original author and source are credited.
1. Introduction
The popularity of cryptocurrency has attracted the attention of scholars, and hence it becomes a popular topic to study (Corbet et al., 2018a). Some of the important studies in cryptocurrencies predicted the Bitcoin returns, volatility, and prices. Balcilar et al. (2017) and Alaoui et al. (2018) discussed the return of Bitcoin price and volume, another study predicted Bitcoin price and return through the newspaper and internet-based analysis (Al-Khazali et al., 2018; Bouri & Gupta, 2019), some others through global financial stress and economic uncertainty (Bouri et al., 2018a; Cheah et al., 2018; Fang et al., 2018; Yen & Cheng, 2019). Plakandaras et al. (2019) forecast Bitcoin returns using the trade war role of the U.S. and China. Kristjanpoller et al. (2020) analyzed six equity ETFs and five cryptocurrencies using asymmetric multifractality. Several studies focused on the factors affecting the cryptocurrency market: Aggarwal et al. (2019) discussed the social factors, Asplund & Ivarsson (2018), Ciaian et al. (2016), Poyser (2017), and Sovbetov (2018) employed internal (supply and demand) and external (crypto market, macro-financial, and political) factors, while Okorie & Lin (2020) only focused on crude palm oil prices. Aside from those factors, the efficiency of the cryptocurrency market was discussed by Wei (2018) and Al-Yahyaee et al. (2020), who employed liquidity to measure efficiency. However, the previous research did not utilize Bitcoin liquidity as a determinant of Bitcoin price.
This research addresses the research gap above by using Bitcoin liquidity as a determinant rather than applying it to cryptocurrency efficiency. In addition, this research also applies factors from the previous research (foreign exchange, stock market index, interest rates, and gold that are categorized as macro-financial factors) as other determinants. This study also took a different route from the previous research in terms of Bitcoin as the dependent variable. While some of the studies above examined the Bitcoin returns, this study focused on Bitcoin price. This measure was taken because we aimed at the Bitcoin business trend (Mackinlay, 1997).
Due to large differences in market capitalization (MCap) between Bitcoin and other cryptocurrencies, this study only focused on Bitcoin. Even though cryptocurrencies keep growing in terms of types and MCap, Bitcoin always comes first among all. The growth of cryptocurrency types reached 35.06% from 4,972 (December 29, 2019) to 6,715 (September 2, 2020), in which Bitcoin has the largest MCap of USD 133.9 billion, or 68.9% of total MCap (December 29, 2019), although it decreased to 56.46% of the total MCap (September 2, 2020). Bitcoin remains at the top rank of cryptocurrencies in terms of MCap (USD 217.9 billion) and therefore dominates the cryptocurrency market (Coinmarketcap, 2019).
The selection of countries for this paper was determined by the Statista survey entitled “How Common Are Crypto Currencies Around the World?” (Buchholz, 2019). An online polling survey was conducted in Statista’s platform, namely Global Consumer Survey, and reached more than 1,000 respondents per country with a total of 55 countries in 2019. This survey classifies the largest contribution countries in using and owning the cryptocurrencies: the United Kingdom, the United States, France, Germany, Japan, Turkey, Spain, Russia, Denmark, Australia, Brazil, Colombia, Mexico, Argentina, Chile, South Africa, China, and Indonesia.
Based on the phenomenon above, we highlight our research contribution in several points: (1) the sample focuses on the largest countries in using and owning cryptocurrencies, (2) liquidity ratio of Bitcoin is used as a new determinant, (3) we provide a robust result using the generalized method of moments (GMM).
The paper is structured as follows: it describes and provides the underlying literature of this paper in the second section; the research objects and methods to obtain research results are outlined in the third section; Section 4 analyzes and summarizes the proposed hypotheses; lastly, Section 5 presents conclusions from research results and suggestions.
2. Literature Review and Development of Hypotheses
2.1 Cryptocorrencies
Cryptocurrencies are being extensively studied by researchers. However, there remains a lot of debate among researchers due to different results and implications. Numerous cryptocurrencies were studied (Asplund & Ivarsson, 2018; Brauneis & Mestel, 2018; İçellioǧlu & Öner, 2019; Walther et al., 2019), the interaction with other financial indicators (foreign exchange, stock market, and interest rate) of several countries were scrutinized (Corbet et al., 2018b; Handika et al., 2019; Poyser, 2017; Sovbetov, 2018). To have a detailed overview of each variable (Bitcoin, macro-financial and internal factors), the next subsections provide details of the hypotheses development of this study.
2.2 Bitcoin (BTC)
Bitcoin is a peer-to-peer electronic system of payment without the intervention of financial institutions (Nakamoto, 2008). It is the most popular cryptocurrency and has the largest MCap (Coinmarketcap, 2019). Unlike fiat currencies controlled by central or government agencies, Bitcoin is monitored by algorithmic software to capture and verify transaction data (Kancs et al., 2015). Nakamoto intended to build Bitcoin using blockchain and Proof of Work (PoW) to record all transactions without double-spending issues.
2.3 Foreign Exchange (FX)
The study of van Wijk (2013) explained that the strengthening of foreign exchange has an impact on macroeconomic and financial developments, which in turn will affect Bitcoin users to trade and exchange, and the demand for Bitcoin will strengthen. Furthermore, Corelli (2018) focused on eleven currencies with six types of cryptocurrency and stated that there is a two-way (bidirectional) influence between Bitcoin and currencies in the Asian continent, namely the Thai baht (positive effect) and the Taiwanese dollar (negative effect). Moreover, Dyhrberg (2016) argued that BTC and FX have no or limited net asset value as a medium of exchange. Besides, BTC and FX are both sensitive to the Fed interest rate. Therefore, we proposed a hypothesis as follows:
H1: Foreign Exchange (FX) in the 18 countries of the most used and owned cryptocurrencies positively affects Bitcoin price (BTC).
2.4 Stock Market Index (SMI)
According to Ciaian et al. (2016), BTC can be explained by SMI. Auto-Regressive Distributed Lag (ARDL) was applied as a method to prove the existence of a significant result on the Dow Jones SMI as one of the variables of the global macroeconomy and financial developments on the Bitcoin price in the short term. Sukamulja & Sikora (2018) used daily Bitcoin closing data as the dependent variable, while the Dow Jones Industrial Average (DJIA) as the SMI, Bitcoin supply and demand, and gold prices were used as the independent variables. The results suggested a significantly negative effect, both in the short and long term. Similarly, Wang et al. (2016) found that the SMI shows a negative effect on the price of Bitcoin, as evidenced by a good economic condition that will benefit the stock market and reduce the demand for other investments such as Bitcoin. Therefore, we proposed a hypothesis as follows:
H2: Stock Market Index (SMI) in the 18 countries of the most used and owned cryptocurrencies negatively affects Bitcoin price (BTC).
2.5 Interest Rate (IR)
Dyhrberg (2016) found interest rates (IR) to have a positive correlation with Bitcoin. The rise in IR will lead to a strengthening of the USD exchange rate, which will lead to increased demand for imports and possibly an increase in online purchases or shopping. In some countries, Bitcoin is used as a payment tool and is convenient for international online shopping. The demand for Bitcoin will also increase and there will be a strengthening of the Bitcoin price. However, both İçellioǧlu and Öner (2019) and Zhu et al. (2017) reported that the Bitcoin price will continue to increase when there is a fall in IR based on historical data. Bitcoin is considered a speculative asset due to its price volatility against IR. An increase in IR will decrease investors’ interest in investing in speculative assets because investors will return to assets that are more stable and have lower risks, such as IR. Zhu et al. (2017) added that an increase in IR can increase the foreign exchange rate, the movement of the country’s market capitalization, and cause a decrease in the Bitcoin price. Therefore, we proposed a hypothesis as follows:
H3: Interest Rates (IR) in the 18 countries of the most used and owned cryptocurrencies negatively affect Bitcoin price (BTC).
2.6 Gold Price (G)
Gold as a macro-financial factor was studied by Pirgaip et al. (2019), who found gold has a two-way effect (bidirectional) on Bitcoin. However, Dyhrberg (2016) and İçellioǧlu and Öner (2019) proved that gold has a positive correlation with Bitcoin. İçellioǧlu and Öner (2019) state that Bitcoin and gold prices have similar aspects, e. g., Bitcoin is used by investors as a diversification tool to overcome the risk of market decline. Dyhrberg (2016) adds that Bitcoin and gold prices have no nationality and are not controlled by the government.
Therefore, we proposed a hypothesis as follows:
H4: Gold price (G) positively affects Bitcoin price (BTC).
2.7 Liquidity Ratio (LR)
Amihud illiquidity ratio is a measurement of market efficiency. It was applied in the study by Wei (2018) and Brauneis and Mestel (2018) because of the simplicity and robustness. Amihud’s illiquidity ratio is used to provide insight into the relationship between volume and price changes daily, and hence we utilize it as an internal factor in this research. The research results of Wei (2018) were confirmed by Brauneis and Mestel (2018) who found that market efficiency is positively related to liquidity by measuring turnover ratios and CorwinSchultz spread estimates. More recently, Al-Yahyaee et al. (2020) also used liquidity ratio in their research. Wei (2018) and Al-Yahyaee et al. (2020) argue that a stronger LR can help create stronger cryptocurrency market efficiency and lower volatility. Strong cryptocurrency market efficiency will strengthen Bitcoin’s price as the main cryptocurrency in the cryptocurrency market. Likewise, a stronger LR may strengthen the cryptocurrency market, which will lead to higher demand for Bitcoin and hence increase its price as well. Therefore, we proposed a hypothesis as follows:
H5: Liquidity Ratio (LR) positively affects Bitcoin price (BTC).
To summarize the hypotheses, we proposed a conceptual framework as follows:
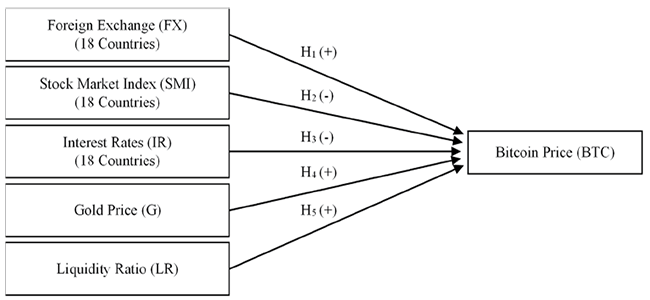
Figure 1. Conceptual Framework
3. Data and Methodology
3.1 Research data and sources
This research used quantitative methods and gathered secondary data with a purposive sampling technique. Data were investigated by using a panel data analysis. The time series covered weekly data from January 1st, 2017 to December 29th, 2019, and a cross-section of the 18 countries as the largest contributors using and owning the cryptocurrencies based on the Global Consumer Survey (Buchholz, 2019). The total weekly data were 157 weeks for three years multiplied across 18 countries. Hence, the total number of observations 2,826 observations.
The variables in this paper are Bitcoin (BTC) closing price as the dependent variable (which may be affected by macro-financial factors (foreign exchange (FX), stock market index (SMI), interest rates (IR), gold price (G)), and liquidity ratio (LR) as the independent variable. Cross-section data included FX, SMI, and IR across 18 countries: the United Kingdom, the United States, France, German, Japan, Turkey, Spain, Russia, Denmark, Australia, Brazil, Colombia, Mexico, Argentina, Chile, South Africa, China, and Indonesia, whereas BTC, G, and LR, are global data. The data were obtained from Investing (2020) for FX, SMI, and G; CEIC (2020) for IR; and Coinmarketcap (2019) for BTC and LR. Table 1 shows FX, SMI and IR indicators for each country.
Table 1. Indicators of FX, SMI, and IR
|
Country |
FX |
SMI |
IR |
|
United Kingdom |
USD/GBP |
FTSE 100 |
Base Rate |
|
United States |
USD |
Dow 30 |
Effective Federal Funds Rate |
|
France |
USD/EUR |
CAC 40 |
Main Refinancing Operations |
|
Germany |
USD/EUR |
DAX |
Main Refinancing Operations |
|
Japan |
USD/JPY |
Nikkei 225 |
Complementary Deposit Facility Interest Rate |
|
Turkey |
USD/TRY |
BIST 100 |
Repo Rate 1 Week |
|
Spain |
USD/EUR |
IBEX 35 |
Main Refinancing Operations |
|
Russia |
USD/RUB |
MOEX |
Key Rate |
|
Denmark |
USD/DKK |
OMXC20 |
Discount Rate |
|
Australia |
USD/AUD |
S&P/ASX 200 |
Cash Target Rate |
|
Brazil |
USD/BRL |
Bovespa |
SELIC |
|
Colombia |
USD/COP |
COLCAP |
Intervention Rate Expansion Minimum |
|
Mexico |
USD/MXN |
S&P/BMV IPC |
Overnight Target Rate |
|
Argentina |
USD/ARS |
S&P Merval |
7 Day LELIQ Rate |
|
Chile |
USD/CLP |
S&P CLX IPSA |
Central Bank Target Rate |
|
South Africa |
USD/ZAR |
South Africa 40 |
Repo Rate |
|
China |
USD/CNY |
Shanghai |
Rediscount Rate |
|
Indonesia |
USD/IDR |
IDX Composite |
7 Days Reverse Repo Rate |
Source: compiled by authors
3.2 Fixed Effect Model (FEM)
We used the Hausman test to find the suitable model for panel data, either the Fixed Effect Model (FEM) or Random Effect Model (REM) to explain the research result. The Hausman test result suggests that the Fixed Effect Model will be applied because the probability of chi2 is less than 0.05 (Hausman, 1978; Park, 2011). The Fixed Effect Model (FEM) equation from Park (2011) was applied:


where FX is direct quotes of foreign exchange; SMI is the main index of the stock market; IR is the benchmark interest rate; G is gold futures price; LR is liquidity ratio using calculations from Al-Yahyaee et al. (2020) research by dividing logarithm of the Bitcoin price in USD by the logarithm of Bitcoin market capitalization in USD; t is time series on weekly data with a period from January 1st, 2017 to December 29th, 2019; i is cross-sectional data in 18 countries, and ε is the error term.
3.3 Robustness Analysis
Besides FEM, we also employed the generalized method of moments (GMM) as additional regression analysis to test the robustness of the relationship between macro-financial and liquidity variables and Bitcoin price. GMM is an econometric model that is based on maximum likelihood estimation when parameters of a probability distribution require nonlinear optimization (Wooldridge, 2010). This method offers benefits that can overcome crucial modeling concerns, namely, the fixed effects and endogeneity of regressors. Furthermore, the method can avoid dynamic panel bias (Abdeljawad et al., 2013).
4. Results and Analysis
4.1 Descriptive Statistics Results
We provided summary statistics including minimum and maximum value to avoid mistakes in entering the data (Wooldridge, 2018). Our descriptive statistics tests showed different results for each of the independent variables, which were foreign exchange (FX), stock market index (SMI), interest rates (IR), gold price (G), and liquidity ratio (LR), as well as the dependent variable, namely Bitcoin price (BTC). Those statistics were summarized in Table 2 below.
Table 2. Statistical Description of the Variables
|
|
BTC |
FX |
SMI |
IR |
G |
LR |
|
Mean |
3.713 |
1.159 |
4.023 |
0.0601 |
3.119 |
0.339 |
|
Median |
3.812 |
0.824 |
3.91 |
0.024 |
3.114 |
0.345 |
|
Max |
4.283 |
4.182 |
5.082 |
0.833 |
3.193 |
0.374 |
|
Min |
2.911 |
-0.154 |
2.941 |
-0.001 |
3.069 |
0.287 |
|
St. Dev |
0.313 |
1.241 |
0.572 |
0.115 |
0.031 |
0.019 |
|
Skewness |
-0.956 |
0.996 |
0.052 |
4.031 |
0.797 |
-1.048 |
|
Kurtosis |
3.167 |
3.035 |
2.063 |
21.149 |
2.832 |
3.401 |
|
Obs. |
2,826 |
2,826 |
2,826 |
2,826 |
2,826 |
2,826 |
Source: compiled by authors
The table explains that the BTC produced an average of 3.71 and a median of 3.81 over three years. BTC revealed a standard deviation of 0.31, with the weekly data reaching the highest value of 4.28 on December 10, 2017, and the lowest value of 2.91 on January 8, 2017. Kurtosis and skewness were 3.16 and -0.95 and showed that the form of data is pointed and the distribution of data tends to move to the right.
FX data resulted in mean and median data of 1.16 and 0.82, with the maximum data of 4.18 from Indonesia on October 21, 2018, and the minimum data of -0.15 from the UK on March 18, 2018. FX produced the largest standard deviation of 1.24 due to a large amount of foreign currency exchange data in 18 countries. The skewness and kurtosis values were 0.99 and 3.04 respectively.
SMI data revealed the highest mean, median, maximum, and minimum values compared to other variables: 4.02; 3.91; 5.08; and 2.94 respectively in the period from 2017 to 2019. The maximum value resulted from Turkey on 21st of January, 2018, and the minimum value was from Denmark on the 21st of October, 2018. The SMI also produced the most normal data compared to other variables because it was closest to zero. The previous statement was evidenced by the skewness of 0.05 with symmetrically distributed data and the kurtosis of 2.06 with normal data collision.
IR data resulted in a small value with percentage form data, implying that values were less than 1. The mean and median values were 0.06 and 0.02. The largest IR data came from Argentina, with a base rate of 83.26% in August 2019. Meanwhile, the lowest value of -0.1% came from Japan, with a consistent base rate for the period 2017-2019. The IR standard deviation is 0.11. IR skewness and kurtosis revealed the largest values, which were 4.03 and 21.15. It showed the data distribution is skewed to the right and had the sharpest data shape as there were many data groupings.
The mean and median values of G were 3.12 and 3.11 over the 3 years with a maximum value of 3.193, a minimum value of 3.069, and a standard deviation of 0.03. The skewness and kurtosis were 0.80 and 2.83 respectively.
LR was the ratio derived from the distribution of the BTC logarithm and the Bitcoin market capitalization logarithm. The mean was 0.339, and the median value was 0.345. LR produced the smallest standard deviation of 0.02 with a small data range. This was evidenced by the maximum value of 0.37 and the minimum value of 0.29, with a data range of 0.08. Skewness revealed the similarity in the form of data owned by LR and BTC, which were negatively distributed, whereas other variables resulted in a positive distribution. LR proved to have a negative skewness of -1.05 and a kurtosis of 3.40.
4.2 Fixed Effect Model and Generalized Method of Moments Result
Based on the Hausman test, FEM was suggested for the analysis. Table 3 shows the final regression result since heteroscedasticity and autocorrelation issues were solved (robust and cluster options were added on FEM). Thus, it can be assumed that the result of FEM was more accurate, reliable, and unbiased. GMM was employed to ensure the robustness of regression results.
Table 3. FEM and GMM Results
|
Dep Var. |
FEM |
GMM |
|
BTC |
||
|
BTC(–1) |
|
0.2149*** |
|
(0.0013) |
||
|
FX |
0.0565** |
0.1645*** |
|
(0.0203) |
(0.0508) |
|
|
SMI |
-0.0115 |
-0.1378*** |
|
(0.0158) |
(0.0150) |
|
|
IR |
-0.0443** |
-0.2462 |
|
(0.0199) |
(0.1759) |
|
|
G |
0.1540*** |
0.0885*** |
|
(0.0040) |
(0.0137) |
|
|
LR |
16.1328*** |
12.8426*** |
|
(0.0157) |
(0.0206) |
|
|
C |
-2.2481*** |
-1.3313*** |
|
(0.0562) |
(0.0809) |
|
|
No. of Obs |
2808 |
2790 |
|
No. of Group |
18 |
18 |
|
F |
1.01 |
|
|
Prob > F |
0.0000 |
|
|
R2 overall |
0.9465 |
|
|
Wald chi2 |
|
1.98 |
|
Prob > chi2 |
0.0000 |
Note: ***, **, ** significant at 1%, 5%, and 10% respectively; robust standard errors are in parentheses.
The overall R2 result produced 0.9465, or 94.65%. It can be inferred that the five independent variables, namely FX, SMI, IR, G, and LR can explain the Bitcoin price for about 94.65%, while other variables that were not included in this study clarify the remaining 5.35%. Furthermore, it could be seen that the probability of F-stat is 0.0000. This implies that all the independent variables: FX, SMI, IR, G, LR were significantly affected simultaneously on the BTC since the p-value was < 0.05. Surprisingly, LR as the new contribution in this research was found to be the most powerful factor in determining Bitcoin price that is classified as an internal factor since the coefficient value was the highest among all.
The t- Statistical Test reported that there were four out of five independent variables whose results were significant on the Bitcoin price and support the hypotheses. The results showed foreign exchange (FX) revealed a positive effect, with significance value of 0.013 under condition 0.013 < 0.05, interest rates (IR) resulted in a negative effect, with significance value of 0.041 under condition 0.041 < 0.05, gold price (G) produced a positive effect, with significance value of 0.000 under condition 0.000 < 0.05, and liquidity ratio (LR) proved to have a positive and significant value of 0.000 under condition of 0.000 < 0.05. Overall, FX, G, and LR were significant at 1% significance level, while IR at 5% significance level. Thus, it was revealed that FX, IR, G, and LR were the variables that significantly affect Bitcoin price as well as support hypotheses H1, H3, H4, and H5. The only exception was observed for stock market index (SMI), which produced a negative effect with a significance value of 0.479 under condition 0.479 > 0.05, and it showed that SMI was the only insignificant independent variable on the Bitcoin price, hence it did not support hypothesis H2. Besides, our GMM result showed consistent directions among most of the explanatory variables on the explained variable. This indicated that our estimations were robust across different econometric models.
4.3 Discussion
The strengthening of foreign exchange directly affects the macroeconomic and financial development in the short run and hence leads the Bitcoin users to execute the trade and exchange. Therefore, Bitcoin demand will be strengthened (van Wijk, 2013). Both Bitcoin and foreign exchange are sensitive to the Fed interest rate (Dyhrberg, 2016), thus it is reasonable enough that Bitcoin price has a positive association with foreign exchange. The result supported the research of Corelli (2018), Dyhrberg (2015, 2016), and van Wijk (2013).
When foreign exchange drives Bitcoin prices positively, it reveals an inverse effect of interest rate on the Bitcoin price. Bitcoin has generated strong volatility (Katsiampa, 2018; Katsiampa et al., 2019; Yi et al., 2018), and thus it is a highly speculative asset (Balcilar et al., 2017; Bouri et al., 2018b; Kristoufek, 2015; Yermack, 2013; Zhu et al., 2017) due to the unstable price compared to the interest rate. The increasing interest rate will decrease the investors’ intention to invest in speculative investment, Bitcoin for instance. Likewise, the decreasing intention of Bitcoin may lead to lowering Bitcoin price (İçellioǧlu & Öner, 2019; Zhu et al., 2017). The stronger interest rate may increase foreign exchange and stir up the market capitalization that causes Bitcoin price to drop. Investors prefer to invest in deposit, stock market, real estate, especially foreign exchange as interest rates increase. The rise in foreign exchange rates may result in a capital flow back, which means that investors are withdrawing their investment funds from foreign countries. As Bitcoin is considered a speculative asset, a decrease in Bitcoin demand will cause the Bitcoin price go down (Zhu et al., 2017).
Bitcoin has similarities with gold as a diversification portfolio to overcome market degradation risk. This is due to the hedging function of gold and Bitcoin. Also, neither gold nor Bitcoin are controlled by the government, they do not have nationality (İçellioǧlu & Öner, 2019). Therefore, the hypothesis that gold positively affects Bitcoin price is accepted and this finding supports the research of Dyhrberg (2016), İçellioǧlu & Öner (2019), and Pirgaip et al. (2019). Gold and Bitcoin can act as a substitute or complementary asset. According to the theory of asset demand, asset yields exhibit the function in several financial assets that can substitute each other (O’Brien, 1974). The substitution function between gold and Bitcoin could be applied for hedging purposes (Baur et al., 2018; Dyhrberg, 2015; Shahzad et al., 2019).
Interestingly, the new independent variable that we proposed in this research, Liquidity Ratio, proved to be a significant factor since it provides new insight to the literature. The function of LR in this research as an internal variable suggests that the stronger LR may create a stronger efficient market of cryptocurrency and lower volatility. The stronger efficiency of the cryptocurrency market may strengthen the Bitcoin price as the highest contributor of cryptocurrency in the market based on market capitalization. This research supports the research of Al-Yahyaee et al. (2020), Brauneis and Mestel (2018), Wei (2018), and Sensoy (2018) from a new perspective. Indeed, a highly liquid asset is attractive to investors (Choudhry, 2005; Ciochetti et al., 2002).
The stock market index is the only insignificant variable in this research, which is not in line with Sukamulja and Sikora (2018) and Wang et al. (2016). There are some reasons why SMI can bring insignificant results: (1) this research was performed within a short run, and difference in study time prevented SMI from clearly explaining its relationship with BTC, (2) SMI data were derived from 18 countries, while the analysis had previously concentrated only on a few countries, (3) the negative correlation of SMI is weak and thus represents an insignificant impact on BTC, and (4) SMI refers to company performance, while Bitcoin has no references.
5. Conclusion
The research was carried out to determine the effect of macro-financial factors, namely foreign exchange, stock market index, interest rates, and gold prices, and the internal factor, liquidity ratio on the Bitcoin price. There were 2,826 observations derived from 18 countries: the United Kingdom, the United States, France, Germany, Japan, Turkey, Spain, Russia, Denmark, Australia, Brazil, Colombia, Mexico, Argentina, Chile, South Africa, China, and Indonesia. We used the Fixed Effect Model and Generalized Method of Moments for the statistical program to test weekly data from January 1, 2017 to December 29, 2019. The findings showed that foreign exchange, gold, and liquidity ratio have significantly positive effect, while the interest rate has a significantly negative effect on Bitcoin price. Meanwhile, the stock market index has a negative but insignificant effect. Therefore, out of the 5 hypotheses that were proposed, 4 hypotheses were accepted (H1, H3, H4, and H5).
The stronger foreign exchange may attract Bitcoin users to do more transactions of trading and exchange. Thus, it will lead to a higher demand for Bitcoin. US Dollar as the first and foremost traded currency worldwide amplifies Bitcoin trading and hence causes price to increase. It is the benchmark for investors to deal with decision-making. Conversely, the unstable price of Bitcoin indicates high volatility and thus it is categorized as a speculative asset compared to the interest rate, which is quite stable. A stronger interest rate may attract the investors to diversify their investment portfolio to a place that is affected by interest rate escalation, namely deposit, stock market, real estate, and foreign exchange. Meanwhile, Bitcoin gains no advantage when interest rate increases and hence the investors’ interest to invest in Bitcoin goes down.
Surprisingly, Gold and Bitcoin have a similar function as a diversification tool since Bitcoin is decentralized (is not controlled by any other parties) and so is gold. Both are used worldwide. Gold also affects positively towards Bitcoin as a substitute asset. When gold price increases, it increases the potential of the investor to sell gold and replace it with Bitcoin as their new portfolio. As Bitcoin could gain abnormal returns, the investors will take advantage by taking profit at the peak movement of Bitcoin price.
Most importantly, the contribution of this research to the literature is that liquidity ratio appears to be the strongest driver of Bitcoin among all factors/variables since the stronger efficiency of the cryptocurrency market may strengthen the Bitcoin price as the top ranking or the highest contributor of cryptocurrency in the market based on market capitalization. Investors prefer to invest in a liquid asset. A high liquidity asset (in this case Bitcoin) will attract investors and increase its demand, thus increasing its price. A liquid asset is attractive because the investors can acquire more money (Geromichalos & Herrenbrueck, 2016) through selling it in the crypto market, and the transaction can be conducted in 24 hours.
An insignificant effect of the stock market was expected due to a short-run period of testing, also taking into account prior research that was only conducted in a few countries. Although our research does not cover the sample based on the continent (Asian, Europe, South-East Asia, for instance) like other previous research, this research provides new insight based on the most used and owned cryptocurrency in the 18 countries, which proves more reliable in terms of its practical point of view in the cryptocurrency market, especially Bitcoin.
Most Bitcoin investors are individual investors who are young and inexperienced (Bouri et al., 2018b). They tend to find the information through a search engine, namely online chat or social media (Kristoufek, 2013). Therefore, they are easily persuaded. The determinants of Bitcoin price in this study may direct them for a mature and wiser decision making to understand the financial assets. This also helps the institutional investors to consider investing in Bitcoin. Unlike the other financial traditional assets, cryptocurrency regulation remains unclear, and hence many people misunderstand or do not fully understand its nature. Therefore, cryptocurrency should build on a firm law and regulation to reduce volatility and have a clear direction.
Based on the results, we suggest several recommendations for future research: (1) adding another dependent variable as an extension study, such as Ethereum, Ripple, Tether, and other types of cryptocurrencies to check whether the results are consistent, (2) adding other independent variables, such as supply and demand, attractiveness, hash rate, legalization, political risk, and volume to identify more predictors that may affect Bitcoin; (3) extending the study period or using both a short and a long-run period, thus a comparison study could be conducted; and (4) processing the raw data of Bitcoin, foreign exchange, stock market index, and gold into a return form to capture the business trend and certain events that may be impacted.
References
Abdeljawad, I., Nor, F. M., Ibrahim, I., & Abdul, R. (2013). Dynamic Capital Structure Trade-off Theory : Evidence from Malaysia. In Proceedings of 3rd Global Accounting, Finance and Economics Conference 5-7 May (Vol. 9, pp. 1–10).
Aggarwal, G., Patel, V., Varshney, G., & Oostman, K. (2019). Understanding the social factors affecting the cryptocurrency market. arXiv preprint arXiv:1901.06245.
Al-Khazali, O., Bouri, E., & Roubaud, D. (2018). The impact of positive and negative macroeconomic news surprises: Gold versus Bitcoin. Economics Bulletin, 38(1), 373–382.
Al-Yahyaee, K. H., Mensi, W., Ko, H. U., Yoon, S. M., & Kang, S. H. (2020). Why cryptocurrency markets are inefficient: The impact of liquidity and volatility. North American Journal of Economics and Finance, 52(January 2019). https://doi.org/10.1016/j.najef.2020.101168
Alaoui, M. El, Bouri, E., & Roubaud, D. (2018). Bitcoin price–volume: A multifractal cross-correlation approach. Finance Research Letters, 31(November), 374–381. https://doi.org/10.1016/j.frl.2018.12.011
Asplund, J., & Ivarsson, F. (2018). What drives the price development of cryptocurrencies? Investopedia, 1–37. http://www.investopedia.com/financial-edge/0311/what-drives-the-price-of-gold.aspx
Balcilar, M., Bouri, E., Gupta, R., & Roubaud, D. (2017). Can volume predict Bitcoin returns and volatility? A quantiles-based approach. Economic Modelling, 64(August 2016), 74–81. https://doi.org/10.1016/j.econmod.2017.03.019
Baur, D. G., Dimpfl, T., & Kuck, K. (2018). Bitcoin, Gold and the Dollar - A Replication and Extension. SSRN Electronic Journal. https://doi.org/10.2139/ssrn.3024377
Bouri, E., & Gupta, R. (2019). Predicting Bitcoin returns: Comparing the roles of newspaper - and internet search-based measures of uncertainty. Finance Research Letters, 38(December), 101398. https://doi.org/10.1016/j.frl.2019.101398
Bouri, E., Gupta, R., Lau, C. K. M., Roubaud, D., & Wang, S. (2018a). Bitcoin and global financial stress: A copula-based approach to dependence and causality in the quantiles. Quarterly Review of Economics and Finance, 69, 297–307. https://doi.org/10.1016/j.qref.2018.04.003
Bouri, E., Gupta, R., & Roubaud, D. (2018b). Herding behaviour in cryptocurrencies. Finance Research Letters, 29, 216–221. https://doi.org/10.1016/j.frl.2018.07.008
Brauneis, A., & Mestel, R. (2018). Price Discovery of Cryptocurrencies: Bitcoin and beyond. Economics Letters. https://doi.org/10.1016/j.econlet.2018.02.001
Buchholz, K. (2019). User or Owner of Cryptocurrency by Country. Statista. https://www.statista.com/chart/18345/crypto-currency-adoption/
CEIC. (2020). Benchmark Rates. Retrieved 28 April 2020, from https://www.ceicdata.com
Cheah, E. T., Mishra, T., Parhi, M., & Zhang, Z. (2018). Long Memory Interdependency and Inefficiency in Bitcoin Markets. Economics Letters, 167, 18–25. https://doi.org/10.1016/j.econlet.2018.02.010
Choudhry, T. (2005). September 11 and time-varying beta of United States companies. Applied Financial Economics, 15(17), 1227–1242. https://doi.org/10.1080/09603100500358742
Ciaian, P., Rajcaniova, M., & Kancs, d’Artis. (2016). The economics of BitCoin price formation. Applied Economics, 48(19), 1799–1815. https://doi.org/10.1080/00036846.2015.1109038
Ciochetti, B. A., Craft, T. M., & Shilling, J. D. (2002). Institutional investors’ preferences for REIT stocks. Real Estate Economics, 30(4), 567–593. https://doi.org/10.1111/1540-6229.t01-1-00051
Coinmarketcap. (2019). Market Capitalization by Cryptocurrency. Retrieved 29 December 2019, from https://coinmarketcap.com/
Corbet, S., Lucey, B., Urquhart, A., & Yarovaya, L. (2018a). Cryptocurrencies as a financial asset: A systematic analysis. International Review of Financial Analysis, 62, 182–199. https://doi.org/10.1016/j.irfa.2018.09.003
Corbet, S., Meegan, A., Larkin, C., Lucey, B., & Yarovaya, L. (2018b). Exploring the dynamic relationships between cryptocurrencies and other financial assets. Economics Letters, 165, 28–34. https://doi.org/10.1016/j.econlet.2018.01.004
Corelli, A. (2018). Cryptocurrencies and exchange rates: A relationship and causality analysis. Risks, 6(4). https://doi.org/10.3390/risks6040111
Dyhrberg, A. H. (2015). Hedging Capabilities of Bitcoin. Is it the virtual gold? Finance Research Letters, 16(C), 139-144. DOI: 10.1016/j.frl.2015.10.025 .
Dyhrberg, A. H. (2016). Bitcoin, gold and the dollar - A GARCH volatility analysis. Finance Research Letters, 16, 85–92. https://doi.org/10.1016/j.frl.2015.10.008
Fang, L., Bouri, E., Gupta, R., & Roubaud, D. (2018). Does global economic uncertainty matter for the volatility and hedging effectiveness of Bitcoin? International Review of Financial Analysis, 61, 29–36. https://doi.org/10.1016/j.irfa.2018.12.010
Geromichalos, A., & Herrenbrueck, L. (2016). The strategic determination of the supply of liquid assets (Working Paper No. 16–1). https://www.econstor.eu/bitstream/10419/173662/1/860300110.pdf
Handika, R., Soepriyanto, G., & Havidz, S. A. H. (2019). Are cryptocurrencies contagious to Asian financial markets? Research in International Business and Finance, 50(July), 416–429. https://doi.org/10.1016/j.ribaf.2019.06.007
Hausman, J. A. (1978). Specification tests in econometrics. Applied Econometrics, 46(6), 1251–1271. https://doi.org/10.2307/1913827
İçellioǧlu, C. S., & Öner, S. (2019). An Investigation on the Volatility of Cryptocurrencies by means of Heterogeneous Panel Data Analysis. Procedia Computer Science, 158, 913–920. https://doi.org/10.1016/j.procs.2019.09.131
Investing.com. (2020). Investing.com. Retrieved 8 April 2020, from https://id.investing.com/markets/
Kancs, D., Ciaian, P., & Rajcaniova, M. (2015). The Digital Agenda of Virtual Currencies: Can Bitcoin Become a Global Currency? JRC Technical Report. https://doi.org/10.2791/96234
Katsiampa, P. (2018). Volatility co-movement between Bitcoin and Ether. Finance Research Letters, 30, 221–227. https://doi.org/10.1016/j.frl.2018.10.005
Katsiampa, P., Corbet, S., & Lucey, B. (2019). High frequency volatility co-movements in cryptocurrency markets. Journal of International Financial Markets, Institutions and Money, 62, 35–52. https://doi.org/10.1016/j.intfin.2019.05.003
Kristjanpoller, W., Bouri, E., & Takaishi, T. (2020). Cryptocurrencies and equity funds: Evidence from an asymmetric multifractal analysis. Physica A: Statistical Mechanics and Its Applications, 545, 123711. https://doi.org/10.1016/j.physa.2019.123711
Kristoufek, L. (2013). BitCoin meets Google Trends and Wikipedia: Quantifying the relationship between phenomena of the Internet era. Scientific Reports, 3, 1–7. https://doi.org/10.1038/srep03415
Kristoufek, L. (2015). What are the main drivers of the bitcoin price? Evidence from wavelet coherence analysis. PLoS ONE, 10(4), 1–15. https://doi.org/10.1371/journal.pone.0123923
Mackinlay, A. C. (1997). Event Studies in Economics and Finance. Journal of Economic Literature, 35(1), 13–39. http://www.jstor.org/stable/2729691%5Cnhttp://www.jstor.org/page/info/about/policies/terms.jsp%5Cnhttp://www.jstor.org
Nakamoto, S. (2008). Bitcoin: A Peer-to-Peer Electronic Cash System. Manubot. https://doi.org/10.1007/s10838-008-9062-0
O’Brien, J. M. (1974). The Covariance Measure of Substitution: An Application to Financial Assets. The Review of Economics and Statistics, 56(4), 456. https://doi.org/10.2307/1924461
Okorie, D. I., & Lin, B. (2020). Crude oil price and cryptocurrencies: Evidence of volatility connectedness and hedging strategy. Energy Economics, 87, 104703. https://doi.org/10.1016/j.eneco.2020.104703
Park, H. M. (2011). Practical Guides to Panel Data Modeling: A Step-by step Analysis Using Data. Public Management and Policy Analysis Program, Graduate School of International Relations, International University of Japan, 12, 1-52.
Pirgaip, B., Dinçergök, B., & Haşlak, Ş. (2019). Bitcoin Market Price Analysis and an Empirical Comparison with Main Currencies, Commodities, Securities and Altcoins. Blockchain Economics and Financial Market Innovation, 141–166. https://doi.org/10.1007/978-3-030-25275-5
Plakandaras, V., Bouri, E., & Gupta, R. (2021). Forecasting Bitcoin Returns: Is there a Role for the US–China Trade War?. Journal of Risk, 23(3).
Poyser, O. (2017). Exploring the determinants of Bitcoin’s price: An application of Bayesian Structural Time Series. arXiv preprint arXiv:1706.01437.
Sensoy, A. (2018). The inefficiency of Bitcoin revisited: A high-frequency analysis with alternative currencies. Finance Research Letters, 28(April), 68–73. https://doi.org/10.1016/j.frl.2018.04.002
Shahzad, S. J. H., Bouri, E., Roubaud, D., Kristoufek, L., & Lucey, B. (2019). Is Bitcoin a better safe-haven investment than gold and commodities? International Review of Financial Analysis, 63(December 2018), 322–330. https://doi.org/10.1016/j.irfa.2019.01.002
Sovbetov, Y. (2018). Factors Influencing Cryptocurrency Prices: Evidence from Bitcoin, Ethereum, Dash, Litcoin, and Monero. Journal of Economics and Financial Analysis, 2(2), 1–27. https://doi.org/10.1991/jefa.v2i2.a16
Sukamulja, S., & Sikora, C. O. (2018). the New Era of Financial Innovation: the Determinants of Bitcoin’S Price. Journal of Indonesian Economy and Business, 33(1), 46. https://doi.org/10.22146/jieb.30646
Van Wijk, D. (2013). What can be expected from the BitCoin. Erasmus Universiteit Rotterdam, 18.
Walther, T., Klein, T., & Bouri, E. (2019). Exogenous drivers of Bitcoin and Cryptocurrency volatility – A mixed data sampling approach to forecasting. Journal of International Financial Markets, Institutions and Money, 63(xxxx), 101133. https://doi.org/10.1016/j.intfin.2019.101133
Wang, J., Xue, Y., & Minghao, L. (2016). An Analysis of Bitcoin Price Based on VEC Model. International Conference on Economics and Management Innovations, (ICEMI), 146–152. Retrieved from https://doi.org/10.2991/icemi-16.2016.36
Wei, W. C. (2018). Liquidity and market efficiency in cryptocurrencies. Economics Letters, 168, 21–24. https://doi.org/10.1016/j.econlet.2018.04.003
Wooldridge, J. M. (2010). Econometrics Analysis of Cross Section and Panel Data (2nd ed.). Cambridge, Massachusetts: The MIT Press. https://doi.org/10.2307/j.ctv5rdzwc.1
Wooldridge, J. M. (2018). Introductory Econometrics (7th ed.). Boston: Cengage.
Yen, K. C., & Cheng, H. P. (2019). Economic policy uncertainty and cryptocurrency volatility. Finance Research Letters, 101428. https://doi.org/10.1016/j.frl.2020.101428
Yermack, D. (2013). Is Bitcoin a Real Currency? An Economic Appraisal. NBER Working Paper Series. 10.2139/ssrn.2361599
Yi, S., Xu, Z., & Wang, G. J. (2018). Volatility connectedness in the cryptocurrency market: Is Bitcoin a dominant cryptocurrency? International Review of Financial Analysis, 60, 98–114. https://doi.org/10.1016/j.irfa.2018.08.012
Zhu, Y., Dickinson, D., & Li, J. (2017). Analysis on the influence factors of Bitcoin’s price based on VEC model. Financial Innovation, 3(1). https://doi.org/10.1186/s40854-017-0054-0