Organizations and Markets in Emerging Economies ISSN 2029-4581 eISSN 2345-0037
2021, vol. 12, no. 2(24), pp. 353–376 DOI: https://doi.org/10.15388/omee.2021.12.60
Information Flow Between the Zimbabwe Stock Exchange and the Johannesburg Stock Exchange: A Transfer Entropy Approach
Kingstone Nyakurukwa
University of the Witwatersrand, South Africa
knyakurukwa@gmail.com
https://orcid.org/0000-0001-5854-4631
Abstract. The purpose of this paper is to determine whether there was information flow between the stock markets of Zimbabwe and South Africa during the time the Zimbabwean economy was dollarized. The author used econophysics-based Shannonian and Rényian transfer entropy estimates to establish the flow of information between the markets in tranquil periods as well as at the tails of return distributions. The only significant Shannonian transfer entropy estimate was from Johannesburg Stock Exchange (JSE) resources index to Zimbabwe Stock Exchange (ZSE) mining index. The findings show that the only significant tail dependence was between JSE All Share Index (JALSH) and ZSE Mining on the one hand, and between JSE Resources and ZSE Mining on the other hand. However, the magnitudes of the effective transfer entropy values are relatively low, showing that there are weak linkages between the Zimbabwe Stock Exchange and the Johannesburg Stock Exchange. The lack of significant information flows between the exchanges of the two countries offer opportunities to fund managers for portfolio diversification. From a government point of view, it is imperative that the tempo of economic and political reform be accelerated so that integration between the markets can be fast-tracked. Integrated markets will benefit Zimbabwe as this will reduce the cost of equity and accelerate economic growth.
Keywords: Zimbabwe Stock Exchange, Johannesburg Stock Exchange, information flow, transfer entropy, integration
Received: 26/2/2021. Accepted: 29/6/2021
Copyright © 2021 Kingstone Nyakurukwa. Published by Vilnius University Press. This is an Open Access article distributed under the terms of the Creative Commons Attribution Licence, which permits unrestricted use, distribution, and reproduction in any medium, provided the original author and source are credited.
1. Introduction
The increasing tempo at which globalization is taking place, coupled with conscious efforts towards financial liberalization, has prompted significant information flow among international stock markets. This, therefore, means that diversification strategies used by international investors depend on the direction and magnitude of the information flow between these stock markets. This study seeks to establish the direction and magnitude between the indices constituting the Johannesburg Stock Exchange (JSE) and the indices constituting the Zimbabwe Stock Exchange (ZSE). Three indices from the Johannesburg Stock Exchange (namely JSE All share, JSE Industrials and JSE Resources) and two indices from the Zimbabwe Stock Exchange (namely ZSE Industrials and ZSE Mining) are used in the analysis.
Abdul Karim and Shabri Abd. Majid (2010) reported findings that articulate the importance of trade, geographical proximity and close relationships among countries as the drivers of stock market integration of the underlying countries. The rationale for choosing the Johannesburg Stock Exchange and the Zimbabwe Stock Exchange is therefore specifically motivated by the close linkages between Zimbabwe and South Africa across several common areas. Firstly, within the study period, Zimbabwe was using a multi-currency system where the South African Rand was accepted as legal tender among a basket of several other foreign currencies, including the American dollar and the British pound. Secondly, South Africa is one of the major trading partners1 of Zimbabwe with statistics showing that between 2004 and 2018, South Africa had the highest average import share with Zimbabwe, amounting to 45.1% (Ngoma, 2020). According to Chirwa and Kader (2018), Zimbabwean migrants in South Africa, who are estimated to be 68% of the total estimated migrants in South Africa, account for 60% of the remittances from South Africa into the SADC region. Finally, the countries are connected geographically, and Zimbabwe provides South Africa with access to Africa as most of its imports and exports by road pass through Zimbabwe. All the linkages above provide a strong case for establishing whether these can translate into information flows between the stock markets of the two countries.
Empirically, the information flow between stock markets has been investigated using various econometric specifications. Some of the tools that have been utilized in empirical studies include Vector auto-regression (VAR) models, Generalized Auto-regressive Conditional Heteroscedasticity (GARCH) models and more recently, the econophysics-based methodologies. Econophysics-based estimations have largely been based on the Shannon entropy and Rényi entropy. Transfer entropy-based specifications offer non-parametric measures of directed, asymmetric information transfer between two time-series processes that do not assume subject-specific restrictions concerning the underlying stochastic processes. To the best of our knowledge, this is the first study to unveil the magnitude and direction of information flow between the ZSE indices and the JSE indices using transfer entropy-based estimates.
The findings of the study, using Shannonian transfer entropy, reveal that the only significant information flow is from the JSE resources index to the ZSE industrials index. The Rényian entropy transfer estimates show that there is significant information flow from the JSE resources index and JALSH to the ZSE mining index. For the Shannonian and Rényian transfer entropy estimates, which were statistically significant, the effective transfer entropy estimates are very low, providing evidence of minimal integration among the indices. From the findings, it is essential that policy response be premised on rapid economic and political reforms to increase capital flows, especially from South Africa. This will decrease the cost of equity and in the process help the country to meet its growth objectives. Economic reforms and financial liberalization will help Zimbabwe to reduce country risk and ultimately attract international capital.
This paper is organized as follows: Section 2 reviews literature on the linkages among stock exchanges globally and in Africa, Section 3 outlines the econometric methodology used in the study, Section 4 presents the results of the study, Section 5 discusses the results and Section 6 concludes the study and gives the policy implications of the study.
2. Literature Review
2.1 An overview of the South African and Zimbabwean stock exchanges
The JSE is the largest and most developed stock exchange in Africa and dates back to the year 1887. The main board of the JSE currently houses more than 350 established companies with a market capitalization of more than US$1 trillion. The bourse has several indices, which include the JSE All Share Index (JALSH), JSE Industrial Index, JSE top 40 index and the JSE industrials index among others. The Zimbabwe Stock Exchange, on the other hand, is one of the oldest exchanges on the African continent initially established in 1896, with uninterrupted trading since 1946. At its peak, before the imposition of economic sanctions on the country by the USA and the European Union, ZSE was the second-largest bourse in sub-Saharan Africa with a market capitalization of more than US$250 million. In its current state, various ZSE market capitalization indices include the All-Share Index, Top 10 Index, Top 15 Index as well as a host of sector indices (Nyakurukwa, 2021). During the time the country was using the multi-currency system (2009-2018), which is the period covered in this study, the ZSE maintained the ZSE Industrial Index as well as the ZSE Mining Index. Eight of the companies listed on the ZSE are also dually listed on the JSE, and these include Old Mutual Limited, PPC and Hwange Colliery Company, which further provides motivation for studying the co-movement between the stock exchanges. Since the aim of this study is to offer policy recommendations from the point of reference of the less developed Zimbabwean economy, both the industrial and the mining indices are used. The three South African indices selected for the purpose of this study were selected because they closely mirror the Zimbabwe Stock Exchange indices in terms of the nature and characteristics of constituent companies.
2.2 Theoretical framework
Aawaar and Tewari (2017) identify two broad theories of stock market co-movements. The first is the traditional theory, which is based on economic fundamentals, and the second is a theory that is based on investor sentiment. The traditional theory of stock market co-movement assumes that economies are frictionless and that investors are rational. Co-movement among the stock markets is then driven by fundamental changes in macroeconomic variables like inflation, interest rates and others. By implication, two stock markets may exhibit co-movement if they share common economic fundamental factors. The second theory of stock market co-movements is based on the existence of frictions within economies. This limits arbitrage opportunities, and this, in turn, delinks the co-movement in fundamentals from co-movement in stock markets (Barberis et al., 2005).
2.3 Sources of stock market integration
Different sources of stock market integration have been documented in the literature. Bracker et al. (1999) attributed the extent of integration across international capital markets directly to the degree of the economic integration of the underlying countries. The characteristics of a stock market may also play a role in determining the extent of integration between stock markets. These characteristics such as stock market size, common industry constituents and levels of liquidity may determine the stage of development of a stock market. Stock markets that have similar sizes, liquidity and trading related costs may be at the same stage of development and may therefore exhibit greater integration.
Wang et al. (2020) use wavelet analysis to investigate whether crude oil influences the co-movement in international stock markets. By focusing on the stock markets of oil-importing and oil-exporting countries, the authors discover that crude oil price is the main source of interdependence between stock markets, whether those stock markets belong to oil-importing or oil-exporting countries. The only exception was the co-movement between two oil-importing-country stock markets, in which the authors postulated that the co-movement could be influenced by factors other than the price of crude oil.
2.4 Empirical evidence on the linkages among international markets
Studies that seek to investigate the magnitude and direction of information flow among stock markets have been extensively done in the developed world using multiple methodologies. In Africa, most of the research has focused on the biggest and most developed markets of South Africa, Nigeria, Egypt and Kenya, with little research done on the smaller frontier markets, which include Zimbabwe. Literature shows that the greater the magnitude of information flow among financial markets, the greater the integration among those markets. Several studies have focused on the benefits of financially integrated markets. According to Collins and Biekpe (2003), a market that is financially integrated with other markets can have access to a large pool of potential investors. This can have a downward effect on the cost of equity, which can help in increasing the viability of projects. Ultimately, the effect will spill over to the macro-economy as this will translate into increased economic growth and reduction of unemployment. The downside of increased integration among markets is that markets become more sensitive to global economic events.
Zimbabwe has been experiencing various political and economic problems since its decision to controversially redistribute land in 1999. This promulgated America and the European Union to impose economic sanctions and restrictions on individuals connected to the ruling party of the country as well as companies in which some members of the ruling party had a stake, some of which are listed. A combination of bad governance from the political elite, disrespect for property rights as well as restrictionary economic sanctions saw the country experiencing its worst economic performance since it gained independence in 1980. This includes the runaway inflation which topped 79,600,000,000% month-on-month in November 2008 (Hanke & Kwok, 2009).
The establishment of a Government of National Unity (GNU) in 2009, in which the opposition was roped into the government, gave hope of stabilizing the economy anchored on international capital flows resulting from a government that was recognized by the international community. The first effort of the GNU towards stabilizing the economy was demonetizing the local currency in favor of a multi-currency regime, which included several currencies among a basket of currencies such as the United States dollar, the South African Rand, the Botswana Pula, the British Pound and several other regional currencies. This managed to stabilize the economy as seen by the reduction in inflation, increased foreign participation on the ZSE and led to substantial improvements in foreign direct investment. Financial integration between the Zimbabwean stock exchange and the South African stock exchange would therefore go a long way in ensuring a reduction in the cost of equity in Zimbabwe and economic growth from viable projects.
Several studies have been done to establish the extent of integration and interconnectedness of markets in sub-Saharan Africa. However, most of these studies have not featured Zimbabwe because of the unavailability and unreliability of data, especially in the hyper-inflationary period. In most of the studies that have been done in Africa on the linkages among the stock exchanges in the continent, South Africa has been reported to have close links with the developed markets, while regional linkages with fellow African markets are very weak. Agyei-Ampomah (2011) investigated the integration of stock markets in Africa and reported that African stock markets are segmented from global markets except for South Africa. The author reported that even within the same regional economic blocs, the correlations were low and sometimes negative. Alagidede (2009), in a study investigating the co-movements among the most developed exchanges of Africa, found that the African exchanges are not influenced by each other despite increased efforts of various economic reforms and financial liberalization. Alagidede (2009) rather pointed to the irrelevance of geographical and economic ties in the integration of the African market. Atenya (2019) examined the flow of information between the JSE and the east African exchanges of Uganda, Tanzania, Kenya and Rwanda. Using a dataset of stock index prices of the 5 countries between 17 January 2008 and 31 March 2017, the study finds no evidence of the JSE influencing the returns of the east African exchanges.
Few studies have been done to establish the linkages between the exchanges of South Africa and Zimbabwe. One notable study to that effect was done under different economic conditions from the present study. This study investigated the linkages among the three exchanges of Southern Africa, namely South Africa, Botswana and Zimbabwe (Jefferis & Okeahalam, 2015). The study covered the period 1986 to 1999, a period in which the economy of Zimbabwe was fairly stable and was not under economic sanctions. At the same time, before 1994, South Africa was under economic sanctions and was highly segmented from the international community. The findings from the study showed that the Botswana Stock Exchange and the Johannesburg Stock Exchange were highly integrated as the results showed significant co-integration of the return series of the respective indices. However, the findings of the study revealed evidence that the Zimbabwe Stock Exchange was not integrated with both the Botswana Stock Exchange and the Johannesburg Stock Exchange. It is therefore tempting to investigate the linkages between the ZSE and the JSE in an environment marked by increased trade between the countries and where the South African Rand was part of the basket of currencies considered as legal tender in Zimbabwe.
3. Methodology
3.1 Data and variables
The analyzed dataset consists of data points of three stock market indices of the Johannesburg Stock Exchange and two stock market indices of the Zimbabwe Stock Exchange. The stock market indices from the Zimbabwe Stock Exchange which formed part of this study are the Industrials index (ZSE ind) as well as the mining index (ZSE min), while those from the Johannesburg Stock Exchange are the JSE All Share index (JALSH), JSE industrial index (JSE ind) and the JSE resources index (JSE res). Daily closing prices of the indices were collected from the Iress database. The JALSH index includes 99% of the listed companies of the JSE of the main board and is computed subject to minimum free float and liquidity criteria. JSE res constitutes those companies that form part of the Industry Classification Benchmark (ICB) belonging to the oil and gas as well as basic materials industry. The JSE ind consists of all companies that do not belong to ICB industries: financials, oil and gas as well as basic materials. In the study period, ZSE maintained only two indices: ZSE min, which consisted of all mining companies, and ZSE ind, which included all other companies not included in the former. The inclusion of both ZSE indices was motivated by the desire to have a complete view of the ZSE, while the choice of the JSE indices was motivated by indices that intuitively likely mirror the ZSE indices in terms of the nature and characteristics of the constituent companies.
The period of the study is restricted to the period in which Zimbabwe was using a multi-currency regime (currencies in circulation included the US dollar, South African Rand and British pound among a basket of currencies). In the multi-currency era, the ZSE stocks were denominated in the US dollar from 2009, and this ended upon the Monetary Policy Statement announcement of the Reserve Bank of Zimbabwe on 27 February 2019, which changed the trading currency on the ZSE from the US dollar to a local currency effective 21 February 2019. Data on the closing prices of all the indices used in the study were extracted from the Iress database. Though the multi-currency regime in Zimbabwe lasted for 10 years from 2009 to 2019, this study only uses daily data for all the indices between 27-06-2010 and 09-09-2018 because this is the only period in which the US dollar-denominated closing prices of the ZSE are available on the Iress database. In line with Marschinski and Kantz (2002), periods without trading activity were excluded from the analysis (such as weekends and holidays).
Though the present study relies on the closing prices of the stock market indices being stationary, in reality, stock prices have been empirically proven to be non-stationary. Studies have ameliorated this problem by creating another variable that can be considered sufficiently stationary or at least asymptotically stationary (Mantegna & Stanley, 2000). Following Kuo and Yang (2008), this study uses log returns to describe a financial time series as follows:
 (1)
(1)
where Sn stands for the index of nth trading day.
3.2 Econometric models
3.2.1 Transfer Entropy”
Entropy-based methodologies have become popular in economics and finance since they were first used by Schreiber (2000). Transfer entropy was used as the basis for this study because of its robustness compared to traditional Granger causality tests especially at the tails of return distributions (Wang & Wang, 2021). Transfer entropy is also a model-free statistic that can measure the time-directed transfer of information between stochastic variables and therefore provides an asymmetric method to measure information transfer (Yao, 2020). Transfer entropy has since been used in various studies including Osei and Adam (2020) to quantify the information flow from individual stocks to stock market indices, as well as testing international stock market integration (Gong et al., 2019). The specific details of the computation and measurement of the statistics used in the two types of transfer entropy are outlined in the following subsections.
3.2.2 Shannonian transfer entropy
Transfer entropy is a non-parametric measure of directed, asymmetric information transfer between two time series processes which does not assume subject-specific restrictions concerning the underlying stochastic processes. Assuming that log denotes the logarithm of a number to base 2, Shannon entropy (Shannon, 1948) postulates that for a discrete random variable J with probability distribution p(j), where j stands for the various outcomes J can take, the average number of bits required to encode the independent draws from the distribution of J optimally can be calculated as:
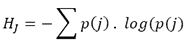 (2)
(2)
Effectively, the formula in Equation 1 measures the uncertainty which increases with the number of bits needed to optimally encode a sequence of realizations of J. Measurement of the flow of information between two time series is done by combining the concept of Shannon entropy with the concept of Kullback-Liebler distance (Kullback & Leibler, 1951) coupled with an assumption that the underlying process evolves over time through a Markov process (Schreiber, 2000). Allowing I and J to denote two discrete random variables with marginal probability distributions p(i) and p(j) respectively, as well a joint distribution p(i, j) whose dynamical structures correspond to stationary Markov processes of order k and j, the Markov property implies that the probability to observe I at time t + 1 in state i conditional on the k previous observations is:
 (3)
(3)
The average number of bits needed to encode the observation in t + 1 if the previous k values are known is given by:
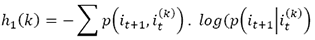 (4)
(4)
where 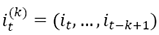 . hj(l) can be derived analogously for process J. In a bivariate specification, the flow of information from one process (J) to another process (I) is calculated by finding the departure from the generalized Markov property
  using the Kullback-Leibler distance (Schreilber, 2000). The Shannon transfer entropy is quantified using the following formula:
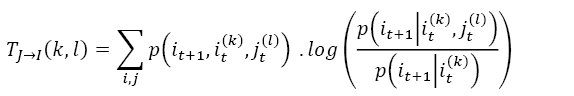 (5)
(5)
where TJ→I measures the flow of information from one process J to another process I. (TI→J measures the flow of information from I to J and can be derived analogously).
3.2.3 Rényian entropy
In empirical finance, relevant information is usually associated with tail events, which are relatively large positive and negative returns. Transfer entropy based on Rényi entropy (Rényi, 1970) offers a mechanism that gives more weight to tail events in terms of their contribution to the overall information flow. Rényi-based transfer entropy introduces a weighting parameter q > 0 for the individual probabilities p(j) and can be calculated as:
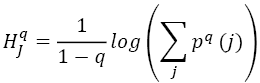 (6)
(6)
For q→1, Rényi entropy converges to Shannon entropy. For 0 < q < 1, events that have a low probability to occur receive more weight, while for q > 1, the weights induce a preference for outcomes j with a higher initial probability. Effectively, Rényi entropy offers a dynamic mechanism for measuring uncertainty necessitated by observing different areas of the distribution depending on the parameter q. Using the escort distribution2  with q > 0 to normalize the weighted distributions, Jizba et al. (2012) derive Rényi transfer entropy measure as:
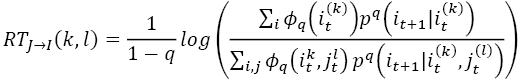 (7)
(7)
where RTJ→1 measures the flow of information from one process J to another process I.
3.2.4 Effective transfer entropy
The transfer entropy represented by Equation [5] and Equation [7] can produce biased estimates as a result of small sample effects. This is ameliorated by the use of the effective transfer entropy proposed by Marschinski and Kantz (2002) and is computed as follows:
 (8)
(8)
where TJshuffled→I(k, l) indicates the transfer entropy using a shuffled version of the time series of J. Shuffling in this case involves drawing values from the time series of J at random and realigning them to generate a new series. The process of shuffling extinguishes the time series dependencies of J and the statistical dependencies between I and J. Consequently, TJshuffled→I(k, l) converges to zero with increasing sample size, and any non-zero value of TJshuffled→I(k, l) is due to a small sample size. A consistent estimator is therefore achieved by repeated shuffling multiple times and subsequently averaging the transfer entropy estimates across all replications. This average is then subtracted from the Shannon and Rényi transfer entropy estimates to get the effective transfer entropy estimates which are bias-corrected. The statistical significance of the transfer entropy estimates is derived using a Markov block bootstrap proposed by Dimpfl and Peter (2013), which maintains the dependencies within the time series, contrary to the shuffling process outlined above. The Markov block bootstrap generates the distribution of transfer entropy estimates under the null hypothesis of no information. Shannonian or Rényian transfer is then estimated using the simulated time series. This process is repeated, thereby yielding a distribution of the entropy transfer estimate under the null hypothesis of no information flow. The p-value associated with the null hypothesis of no information transfer is given by  , where
  denotes the quantile of the simulated distribution that corresponds to the original transfer entropy estimate.
It can be noted that the calculation of Shanonian and Rényian entropy is based on discrete data. Because this study uses continuous index returns, this data is discretized using symbolic coding. This is achieved by partitioning the data into a finite number of bins based on the quantiles of the empirical distribution of the data. Assuming the bounds specified for the n bins is represented by q1, q2 , …, qn where q1 < q2 … < qn , and assuming that a time series is denoted by yt , the data is recoded by:
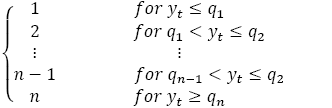
Each value in the time series yt is replaced with an integer (1, 2, ..., n) according to how St relates to the interval specified by the lower and upper bounds q1qn . The choice of the bins is justified by the empirical distribution of the data.
4. Results
4.1 Descriptive statistics
Table 1 shows the summary statistics of the US dollar-denominated returns of the indices used in the study. Figure 1 visualizes the closing prices of the JSE and the ZSE indices alongside the log returns. The Pearson correlation coefficients of the variables are shown in Table 4.
Table 1. Summary statistics
|
|
Mean |
Median |
Min |
Max |
SD |
|
JALSH |
0.0003186 |
0.0006717 |
-0.036214 |
0.0415927 |
0.0083628 |
|
JSE ind |
0.0003264 |
0.0004619 |
-0.057155 |
0.0546219 |
0.0091545 |
|
JSE res |
-0.000141 |
0.0001160 |
-0.066841 |
0.0739123 |
0.0139543 |
|
ZSE ind |
0.0005575 |
0.0000160 |
-0.120081 |
0.1439287 |
0.0101421 |
|
ZSE min |
0.0002137 |
0.0000000 |
-0.229537 |
0.2618513 |
0.0243372 |
Note. SD represents standard deviation
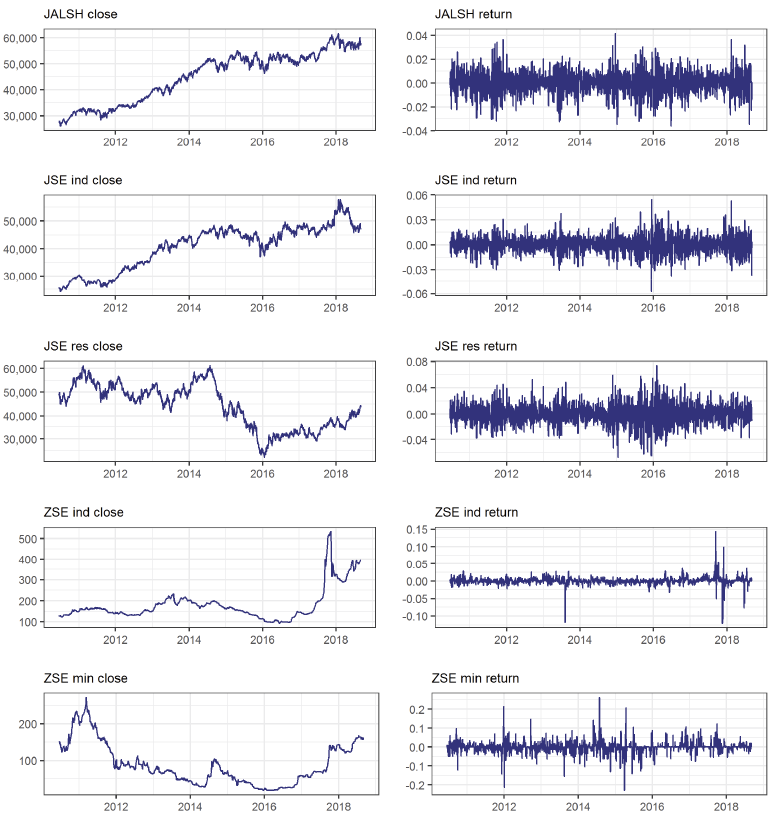
Figure 1. Visualization of Closing Prices and log Returns
Table 1 shows that the highest mean return was experienced on the ZSE ind (0.056%), while the lowest mean return was experienced on the JSE res (-0.0141%). This shows that the ZSE had better mean returns compared to the JSE during the multi-currency era. The use of the US dollar seems to have instilled confidence in the ZSE and increased demand for the ZSE stocks by foreign investors as well as local investors. However, the standard deviation estimates show that the Zimbabwean market was relatively more volatile than the South African market. Figure 1 also demonstrates the stylized facts of financial returns as there is evidence of volatility clustering on all the return series. Table 2 below shows the Pearson correlation coefficients of the return series of the indices used in the study.
Table 2. Pearson correlations
|
|
JALSH |
JSE ind |
JSE res |
ZSE ind |
ZSE min |
|
JALSH |
1 |
0.7392*** |
0.7611*** |
-0.0189 |
-0.0181 |
|
JSE ind |
0.7392*** |
1 |
0.4133*** |
0.0014 |
0.0134 |
|
JSE res |
0.7611*** |
0.4133*** |
1 |
-0.0018 |
-0.0135 |
|
ZSE ind |
-0.0189 |
0.0014 |
-0.0018 |
1 |
0.1401*** |
|
ZSE min |
-0.0181 |
0.0134 |
-0.0135 |
0.1401*** |
1 |
Table 2 shows that within the JSE, the correlations among the three indices are positive and statistically significant at the 1% significance level. This is the same with the correlation between the ZSE ind and ZSE min, which is positive and statistically significant at the 1% level. However, no correlation between an index from the JSE and another from the ZSE is positive at all the conventional levels of significance. This means that the correlations are significant within the respective markets, while across the markets there is no significant correlation.
4.2 Empirical Results
To justify the econometric model used in this study, firstly the variables are examined to see if there are any structural breaks using the Bai and Perron (2003) tests for multiple structural breaks and linearity using the Brock, Dechert, Scheinkman and LeBaron (BDS) test (Brock et al., 1996). The null hypothesis of the BDS test is that the return and series are independently and identically distributed. The epsilon values are chosen following recommendations from Brock et al. (1991). The optimal embedding dimension (m used is 6, in line with other empirical studies. The results from the BDS test are shown in Table 3.
Table 3. BDS Test for Linearity
|
Variable |
Epsilon |
m |
||||
|
2 |
3 |
4 |
5 |
6 |
||
|
JALSH |
0.5σ |
19.7822*** |
26.5003*** |
31.3906*** |
34.6973*** |
38.1446*** |
|
1.0σ |
15.9135*** |
20.8218*** |
22.3215*** |
22.6769*** |
23.642*** |
|
|
1.5σ |
12.7104*** |
17.0642*** |
17.6882*** |
17.6139*** |
17.9851*** |
|
|
2.0σ |
9.6588*** |
14.0156*** |
14.632*** |
14.5512*** |
14.756*** |
|
|
JSE industrials |
1.5σ |
19.0249*** |
27.1521*** |
32.9118*** |
36.9833*** |
40.467*** |
|
1.0σ |
15.9562*** |
22.0613*** |
24.5592*** |
25.5145*** |
26.6889*** |
|
|
1.5σ |
12.6478*** |
17.7528*** |
19.2968*** |
19.733*** |
20.4978*** |
|
|
2.0σ |
10.1043*** |
14.2783*** |
15.4015*** |
15.7264*** |
16.3737*** |
|
|
JSE resources |
0.5σ |
16.9538*** |
24.1529*** |
27.5627*** |
29.5052*** |
31.7153*** |
|
1.0σ |
14.4829*** |
19.2786*** |
19.9525*** |
19.393*** |
19.3508*** |
|
|
1.5σ |
12.6975*** |
16.4472*** |
16.6968*** |
16.2743*** |
16.0711*** |
|
|
2.0σ |
11.3173*** |
14.6751*** |
14.9278*** |
14.7113*** |
14.5484*** |
|
|
ZSE industrials |
0.5σ |
39.5867*** |
49.2729*** |
55.9061*** |
63.1077*** |
71.709*** |
|
1.0σ |
35.6424*** |
39.4568*** |
40.3264*** |
41.0298*** |
42.0617*** |
|
|
1.5σ |
33.3692*** |
35.6295*** |
35.3653*** |
34.8296*** |
34.4501*** |
|
As shown in Table 3, the null hypothesis that the return series are independently and identically distributed can be rejected at the 1% significance level, signifying that the transformed variables are nonlinear, and therefore the use of linear models leads to biased estimates emanating from misspecifications.
Table 4. Test for Multiple Structural Breaks
|
Variable |
Structural break date |
|
JALSH |
26 April 2015 |
|
JSE industrials |
8 September 2014 |
|
JSE resources |
20 January 2016 |
|
ZSE industrials |
22 September 2016 |
|
ZSE mining |
25 February 2016 |
Table 4 also shows that the returns of the JSE and ZSE stock indices have structural breaks, which gives justification against using models that assume linearity and no structural breaks in the variables. Transfer entropy models are therefore appropriate as they are robust to data that exhibits nonlinearities and/or structural breaks.
The strength of the relationship between the ZSE indices and the JSE indices using the effective transfer entropy based on the Shannonian entropy are presented in Table 5. The results are based on Equation 4 after the data were shuffled to ameliorate the small sample effects in line with other studies. Table 5 reports the Shannonian transfer entropy estimates as well as the effective transfer entropy (ETE) together with the associated standard errors. Figure 2 reports the estimates of the effective transfer entropy within the 95% confidence intervals for all the indices.
Table 5. Shannonian Entropy estimates
|
Direction |
TE |
ETE |
SE |
||
|
JALSH |
⇒ |
ZSE ind |
0.0043 |
0.0016 |
0.0011 |
|
ZSE ind |
⇒ |
JALSH |
0.0046 |
0.0015 |
0.0011 |
|
JALSH |
⇒ |
ZSE min |
0.0033 |
0.0003 |
0.0011 |
|
ZSE min |
⇒ |
JALSH |
0.0031 |
0.0000 |
0.0011 |
|
JSE ind |
⇒ |
ZSE ind |
0.0036 |
0.0010 |
0.0012 |
|
ZSE ind |
⇒ |
JSE ind |
0.0033 |
0.0002 |
0.0010 |
|
JSE ind |
⇒ |
ZSE min |
0.0026 |
0.0000 |
0.0012 |
|
ZSE min |
⇒ |
JSE ind |
0.0037 |
0.0006 |
0.0010 |
|
JSE res |
⇒ |
ZSE ind |
0.0064 |
0.0037 |
0.0012* |
|
ZSE ind |
⇒ |
JSE res |
0.0030 |
0.0000 |
0.0010 |
|
JSE res |
⇒ |
ZSE min |
0.0030 |
0.0001 |
0.0011 |
|
ZSE min |
⇒ |
JSE res |
0.0046 |
0.0016 |
0.0010 |
Note. ⇒ denotes the direction of information flow, TE denotes transfer entropy estimates, ETE denotes the effective transfer entropy estimates, and SE denotes standard error.
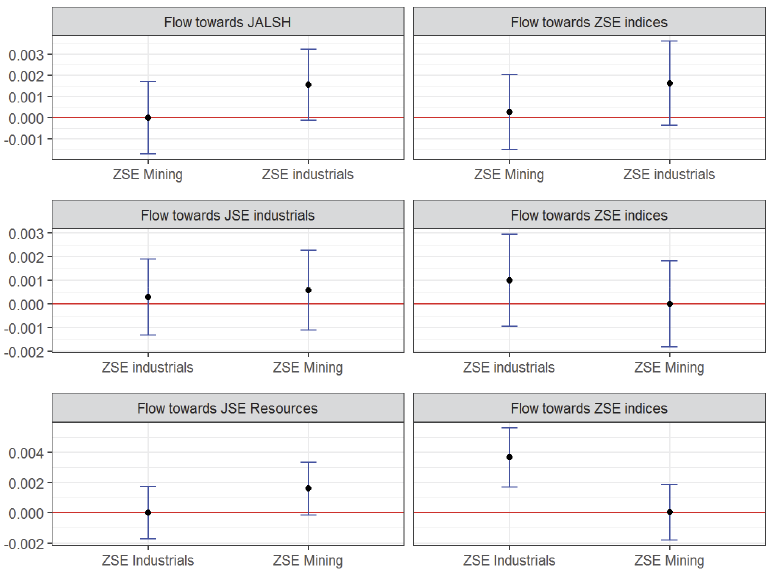
Figure 2. Shannonian ETE
Note. Figure 2 shows Shannonian Effective transfer entropy (ETE) estimates together with 95% confidence bounds for all indices. Both ends of each blue line segment enclose the ETE within 95% confidence bounds. A lower end of the line below zero ETE indicates insignificant information flow from either direction at the 5% level of significance.
As shown in Table 2 and Figure 2, the only significant information flow between the ZSE and the JSE is the flow from the JSE resources index to the ZSE industrial index, which is significant at the 5% level. For other pairs of relationships between the ZSE indices and the JSE indices, the flow of information to and from both indices is not significant at the conventional levels of significance. The significant flow of information from JSE res to ZSE ind could be explained by the dependence of the companies listed on the ZSE industrials index on the raw materials provided by the companies listed on the JSE resources index. The result also corroborates literature that says information is likely to flow from a more developed market to a less developed market than the other way round. However, though there is evidence of significant information flow from the JSE res to ZSE industrials, the value of the ETE is very low (0.0037) and shows marginal information flow. To establish whether there are tail dependencies between the JSE-constituent indices and the ZSE-constituent indices, Rényi ETE is used, utilizing model specifications as described in the methodology section. Rocco (2012) observes that extreme (tail) events are more informative than the median observation. The results from the Rényi ETE are visualized in Figure 3 below.
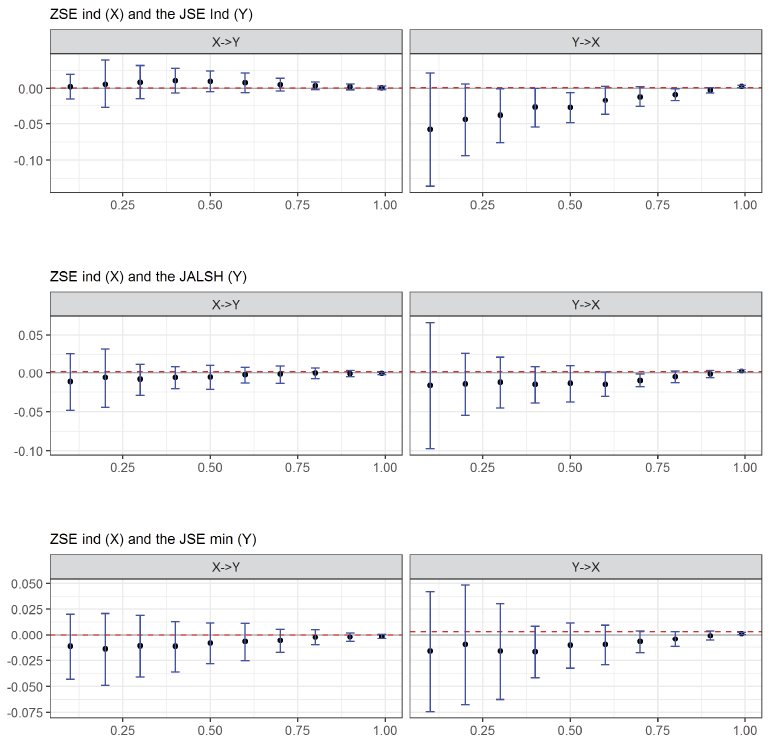
Figure 3. Rényian Effective Transfer Entropy Estimates: ZSE ind and JSE Indices
Note. Figure 3 shows Rényian Effective transfer entropy (ETE) estimates together with 95% confidence bounds for all indices. Both ends of each blue line segment enclose the ETE within 95% confidence bounds. A lower end of the line below zero ETE indicates insignificant information flow from either direction at the 5% level of significance. The horizontal axes show different values of q from 0 to 1.
Figure 3 shows the Rényian transfer entropy estimates between ZSE industrial index and the JALSH, JSE ind and JSE res respectively. Selecting values of q between zero and 1 accentuates the dependencies in the tails between the return distributions. For all the bivariate relationships between the JSE indices and ZSE indices, the flow of information to and from the indices is insignificant at the 5% level, showing that there are no tail dependencies between the returns of the indices. The information presented in Figure 3, therefore, shows that there is no evidence that any of the pairs of JSE-ZSE indices could crash together. The Rényian ETE estimates between the ZSE mining index and the JSE indices respectively are shown in Figure 4.
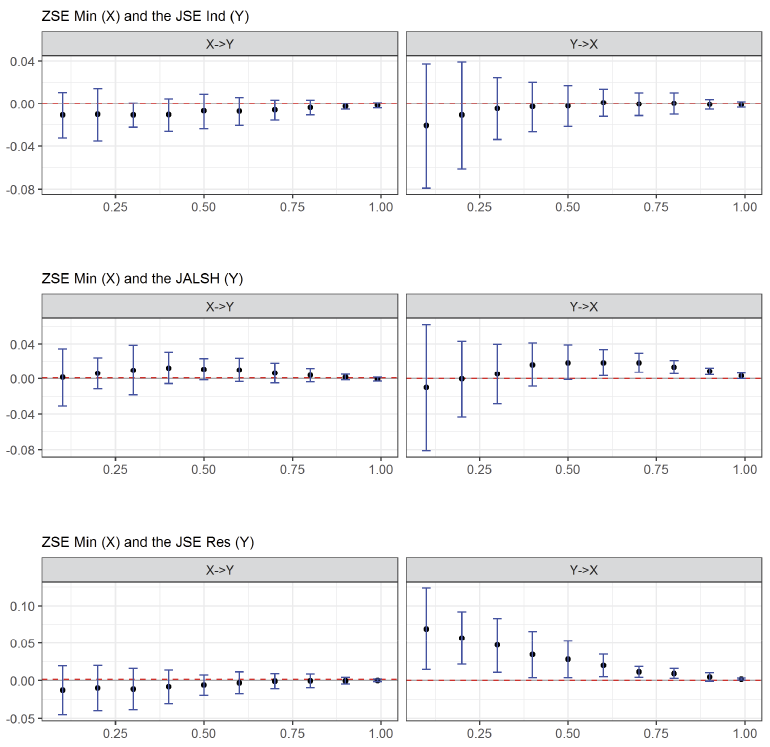
Figure 4. Rényian Effective Transfer Entropy Estimates: ZSE min and JSE Indices
Figure 4 shows the Rényian transfer entropy estimates between ZSE min and the JALSH, JSE ind and JSE res respectively. The top panel shows that there is no significant information flow between ZSE min and JSE ind at all values of q. This confirms the absence of tail dependencies between the ZSE min returns and the JSE ind index returns. However, the middle and bottom panels in Figure 5 show that there are tail dependencies from JALSH to ZSE min as well as from JSE res to the ZSE mining index. There are tail dependencies and significant flow of information from the JALSH to the ZSE min for values of q between 0.6 and 1 and significant flow of information from JSE res to ZSE min for all values of q. Also, it can be noted that for the values of q in which the Rényian entropy estimates are significant, the values of the entropy estimates are all positive. According to Behrendt et al. (2019), positive Rényi transfer entropy implies that the risk about the dependent variable is reduced by knowledge of the other variable. Thus, relative to the significant information flows depicted in Figure 4, the risk about the JALSH can be reduced by knowledge about ZSE min, and the risk about the JSE res can be reduced by knowledge about the ZSE min. However, it can also be noted from Figure 4 that the magnitudes of the Rényian ETE estimates are also very low (less than 0.1) on a scale of 0 to 1 showing that the magnitude of tail dependence is close to zero though significant. Another observation that can be made from Figure 4 is that the flow of information at extreme distributions is unidirectional from the JSE to the ZSE, showing information flow from the more developed JSE to the less developed ZSE.
4.3 Robustness: DCC-GARCH model
The results from the Shannonian entropy and Renyian entropy shown above have a weakness because they are static in frequency and time. For robustness, the linkages between the JSE and ZSE are further re-estimated using the Dynamic Conditional Co-variance (DCC)-Generalized auto-regressive Conditional Heteroscedasticity (GARCH) model of Engle (2002) to address the time-varying volatility and correlations between the two markets. Details on computing the DCC-GARCH model parameters used in this study are outlined in Appendix A. The DCC-GARCH model results showing the dynamic relationships among the different stock indices of the Zimbabwe Stock Exchange and the Johannesburg Stock Exchange are presented in Figure 5.
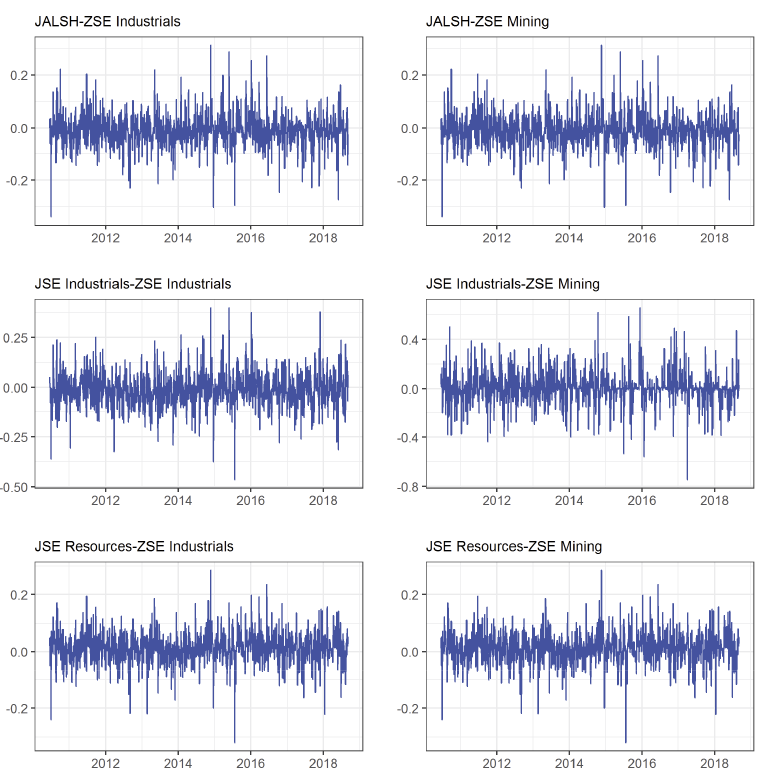
Figure 5. Conditional Correlations between the JSE and the ZSE
Figure 5 above confirms the findings from transfer entropy estimates on the linkages between the ZSE indices as well as the JSE indices. The correlations among the stock indices are clustered around 0, with the minimum and maximum correlations between -0.3 and 0.3 respectively across the study period. This confirms weak linkages between the Zimbabwe Stock Exchange and the Johannesburg Stock Exchange even using a time-varying dynamic model.
5. Discussion
The transfer entropy methodology, as well as the DCC-GARCH model used to test the linkages between the Zimbabwe Stock Exchange and the Johannesburg Stock Exchange, have largely shown weak evidence of integration between the stock markets. Firstly, the lack of linkages between the two stock markets could be explained by the existence of economic sanctions imposed on Zimbabwe by the European Union, which has cut off the Zimbabwean economy from the rest of the world economy thereby reducing integration prospects. The lack of interdependence between the ZSE and the JSE can also be attributed to a lack of liquidity and a high concentration of market capitalization in blue-chip stocks on the ZSE. This is in line with a study by Elyasiani et al. (1998), who attributed the weak interdependence between Sri Lankan stock exchanges and its trading partners to illiquidity and concentration of blue-chip companies on the Sri Lanka Stock Exchange.
The results also corroborate the proposition that though globalization and international trade among countries has increased, this has not translated into increased co-movement among international stock exchanges and that the benefits of international diversification still exist (Mollah & Mobarek, 2016).
The findings from this study are consistent with earlier studies done on the linkages between the two exchanges. A study to examine the linkages between the then influential stock markets in Southern Africa found strong linkages between the Johannesburg Stock Exchange and the Botswana Stock Exchange, while there was a weak linkage between the Johannesburg Stock Exchange and the Zimbabwe Stock Exchange (Jefferis & Okeahalam, 2015). It is interesting to note that in the period (1986–1999) covered by Jefferis and Okeahalam (2015), South Africa was mostly under economic sanctions (1977–1994), while in the period covered in this study (2009–2018), Zimbabwe has been under economic sanctions (2000 to date). Economic sanctions could therefore be the reason why these two markets have been weakly integrated across time as there are only 6 years (1995-1999) in which there were no economic sanctions between the two countries from 1977 to date. The lack of integration between the JSE and ZSE does not offer incentives for firms to improve corporate governance as foreign investors are known for actively monitoring invested firms (Hillier & Loncan, 2019). This supports the findings of Nyakurukwa (2021), who reports low levels of corporate governance compliance among the listed companies on the Zimbabwe Stock Exchange.
In terms of theory, the findings from this study conform to the sentiment-based theory of stock market co-movements. The theory postulates that weak linkages between international stock markets arise from markets with irrational investors who are driven more by sentiment than they are driven by economic fundamentals. This delinks the linkages between stock markets as it is presumed that the linkages in economic fundamentals are the ones that lead to integration between markets. This is especially rational in the Zimbabwean market where the stock market has been primarily driven by sentiment as irrational investors have seen the ZSE as a haven for investments amid economic instability. Policy inconsistency and difficulties in expatriating profits could have limited foreigners’ appetite for the ZSE securities, thereby isolating the local bourse from international investors and contributing to the weak integration with the global economy.
6. Conclusion, Recommendations and Suggestions for Future Research
The study sought to establish whether there is information flow between the JSE and ZSE stock indices. Three indices representing the JSE and two indices representing the ZSE were used in the study. The findings, using Shannonian transfer entropy, reveal that the only significant information flow is from the JSE resources index to the ZSE industrials index. The Rényian entropy transfer estimates show that there is significant information flow from the JSE resources index and JALSH to the ZSE mining index. For the Shannonian and Rényian transfer entropy estimates which were significant, the magnitudes are very low, providing evidence of weak integration among the indices. It can therefore be inferred that the South African and Zimbabwean markets do not fluctuate in tune with a common driving mechanism. The results from this study confirm the point raised by Alagidede (2008) that geographical and economic ties are not adequate in the integration of African markets. The evidence from the findings shows that the stock market in Zimbabwe responds to its own peculiar situations and is not driven by information from the JSE.
The limited evidence of integration between the ZSE and JSE can be explained by various reasons. Firstly, though the establishment of the Government of National Unity in Zimbabwe in 2009, after years of misrule, was expected to usher a battery of economic and political reforms, the constant bickering between the two political parties did not produce the extent of the reforms which were expected. This reduced the confidence of the international community in the country, thereby making the country segmented from the international community, including South Africa. Secondly, controversial policies used by the government, for example, the use of the Indigenization and Economic Empowerment Act of 2008, which advocated for the restriction of foreign ownership of companies to 49%, drastically reduced foreign participation on the ZSE and international capital flows. Finally, the continual placement of Zimbabwe under the rudder of economic sanctions has increased its country risk thereby curtailing international capital flows.
The findings of the study have various policy implications for different stakeholders. The lack of significant information flows among the exchanges of the two countries offer opportunities to fund managers for portfolio diversification. From a government point of view, it is imperative that the tempo of economic and political reform be accelerated so that integration between the markets can be fast-tracked. Integrated markets will benefit Zimbabwe as this will reduce the cost of equity and accelerate economic growth. As the continent gears for a single currency, integration must start at a country level before it can cascade to the regional and continental level. Regulatory authorities should also be wary of the tail dependencies between the ZSE ind and JSE indices as there is a high probability of these markets crushing together. While this study has used a static method with an additional dynamic model for robustness, future studies could investigate this relationship in a time-frequency domain to determine the short-run and long-run dynamics of the stock market co-movements between two countries.
References
Aawaar, G. M., & Tewari, D. D. (2017). Market Integration and Informational Efficiency of Africa’s Stock Markets. Frontiers in Finance and Economics, 14, 50–84.
Abdul Karim, B., & Shabri Abd. Majid., M. (2010). Does trade matter for stock market integration? Studies in Economics and Finance, 27(1), 47–66. DOI: 10.1108/10867371011022975.
Agyei-Ampomah, S. (2011). Stock market integration in Africa. Managerial Finance, 37(3), 242–256. DOI: 10.1108/03074351111113306.
Alagidede, P. (2009). Are African stock markets integrated with the rest of the world? African Finance Journal, 11(1), 37–53. DOI: 10.10520/EJC33739.
Atenya, M. K. (2019). The status quo of East African stock markets: Integration and volatility. African Journal of Business Management, 13(5), 176–187. DOI: 10.5897/AJBM2019.8742.
Bai, J., & Perron, P. (2003). Computation and analysis of multiple structural change models. Journal of Applied Econometrics, 18(1), 1–22. DOI: https://doi.org/10.1002/jae.659.
Barberis, N., Shleifer, A., & Wurgler, J. (2005). Comovement. Journal of Financial Economics, 75(2), 283–317. DOI: 10.1016/j.jfineco.2004.04.003.
Beck, C., & Schögl, F. (1993). Thermodynamics of Chaotic Systems: An Introduction. (Cambridge Nonlinear Science Series). Cambridge University Press. DOI: 10.1017/CBO9780511524585.
Behrendt, S., Dimpfl, T., Peter, F. J., & Zimmermann, D. J. (2019). RTransferEntropy: Quantifying information flow between different time series using effective transfer entropy. SoftwareX, 10, 1–9. DOI: 10.1016/j.softx.2019.100265.
Bracker, K., Docking, D. S., & Koch, P. D. (1999). Economic determinants of evolution in international stock market integration. Journal of Empirical Finance, 6(1), 1–27.
Brock, W. A., Hsieh, D. A., & LeBaron, B. D. (1991). Nonlinear Dynamics, Chaos, and Instability: Statistical Theory and Economic Evidence. MIT Press.
Brock, W. A., Scheinkman, J. A., Dechert, W. D., & LeBaron, B. (1996). A test for independence based on the correlation dimension. Econometric Reviews, 15(3), 197–235. DOI: 10.1080/07474939608800353.
Chirwa, G., & Kader, A. (2018). Analysis of Economic Development Impact of Remittances on Recipient (Zimbabwe) and Remitting (South Africa) Countries. Journal of Business and Economic Development, 3(3),77–85. DOI: 10.11648/j.jbed.20180303.13.
Collins, D., & Biekpe, N. (2003). Contagion and Interdependence in African Stock Markets. South African Journal of Economics, 71(1), 181–194. DOI: https://doi.org/10.1111/j.1813-6982.2003.tb00077.x.
Dimpfl, T., & Peter, F. J. (2013). Using transfer entropy to measure information flows between financial markets. Studies in Nonlinear Dynamics and Econometrics, 17(1),85–102. DOI: 10.1515/snde-2012-0044.
Elyasiani, E., Perera, P., & Puri, T. N. (1998). Interdependence and dynamic linkages between stock markets of Sri Lanka and its trading partners. Journal of Multinational Financial Management, 8(1), 89–101. DOI: 10.1016/S1042-444X(98)00020-6.
Engle, R. (2002). Dynamic Conditional Correlation. Journal of Business & Economic Statistics, 20(3), 339–350. DOI: 10.1198/073500102288618487.
Gong, C., Tang, P., & Wang, Y. (2019). Measuring the network connectedness of global stock markets. Physica A: Statistical Mechanics and its Applications, 535, 122351. DOI: 10.1016/j.physa.2019.122351.
Hanke, S. H., & Kwok, A. K. F. (2009). On the Measurement of Zimbabwe’s Hyperinflation. Cato Journal, 29(2), 353–364.
Hillier, D., & Loncan, T. (2019). Stock market integration, cost of equity capital, and corporate investment: Evidence from Brazil. European Financial Management, 25(1), 181–206. DOI: https://doi.org/10.1111/eufm.12147.
Jefferis, K., & Okeahalam, C. (2015). International Stock Market Linkages in Southern Africa. South African Journal of Accounting Research, 13(2), 27–51. DOI: 10.1080/10291954.1999.11435087.
Jizba, P., Kleinert, H., & Shefaat, M. (2012). Rényi’s information transfer between financial time series. Physica A: Statistical Mechanics and its Applications, 391(10), 2971–2989.
Kullback, S., & Leibler, R. A. (1951). On Information and Sufficiency. The Annals of Mathematical Statistics, 22(1), 79–86. DOI: 10.1214/aoms/1177729694.
Kuo, C. C., & Yang, C. H. (2008). Knowledge capital and spillover on regional economic growth: Evidence from China. China Economic Review, 19, 594–604. DOI: 10.1016/j.chieco.2008.06.004.
Mantegna, R. N. & Stanley, H. E. (2000). An Introduction to Econophysics: Correlations and Complexity in Finance. Cambridge University Press
Marschinski, R., & Kantz, H. (2002). Analysing the information flow between financial time series. The European Physical Journal B - Condensed Matter and Complex Systems, 30(2), 275–281. DOI: 10.1140/epjb/e2002-00379-2.
Mollah, S., & Mobarek, A. (2016). Global Stock Market Integration: Co-Movement, Crises, and Efficiency in Developed and Emerging Markets. Palgrave Macmillan US. DOI: 10.1057/9781137367549.
Ngoma, G. (2020). What determines import demand in Zimbabwe? Evidence from a gravity model. Cogent Economics & Finance, 8(1), 178–212. DOI: 10.1080/23322039.2020.1782129.
Nyakurukwa, K. (2021). The Zimbabwe Code on Corporate Governance (Zimcode) and Financial Performance. Journal of African Business, (online), 1–19. DOI: 10.1080/15228916.2021.1889871.
Osei, P. M., & Adam, A. M. (2020). Quantifying the Information Flow between Ghana Stock Market Index and Its Constituents Using Transfer Entropy. Mathematical Problems in Engineering, 1–10. DOI: 10.1155/2020/6183421.
Rényi, A. (1970). Probability Theory. (North-Holland series in applied mathematics and mechanics, V. 10). Amsterdam: North-Holland Pub. Co.
Schreiber, T. (2000). Measuring Information Transfer. Physical Review Letters, 85(2), 461–464. DOI: 10.1103/PhysRevLett.85.461.
Shannon, C. E. (1948). A Mathematical Theory of Communication. Bell System Technical Journal, 27(3), 379–423. DOI: https://doi.org/10.1002/j.1538-7305.1948.tb01338.x.
Wang, J., & Wang, X. (2021). COVID-19 and financial market efficiency: Evidence from an entropy-based analysis. Finance Research Letters, (Online),1–7. DOI: 10.1016/j.frl.2020.101888.
Wang, P., Ho, T., & Li, Y. (2020). The Price-Volume Relationship of the Shanghai Stock Index: Structural Change and the Threshold Effect of Volatility. Sustainability, 12(8), 3322. DOI: 10.3390/su12083322.
Yao, C.-Z. (2020). Information Flow Analysis between EPU and Other Financial Time Series. Entropy, 22(6), 1–19. DOI: 10.3390/e22060683.
Appendix A.
Details of the DCC-GARCH model


Appendix B. Trade between Zimbabwe and South Africa
|
Year |
Exports to South Africa |
Imports from South Africa |
||
|
Value* |
Partner share (%) |
Value* |
Partner share (%) |
|
|
2010 |
1.375 |
54.22 |
2.811 |
48.03 |
|
2011 |
2.3 |
67.18 |
4.834 |
56.21 |
|
2012 |
2.674 |
68.87 |
3.107 |
42.20 |
|
2013 |
2.164 |
74.53 |
3.659 |
47.59 |
|
2014 |
2.105 |
66.96 |
2.736 |
42.88 |
|
2015 |
1.922 |
71.09 |
2.305 |
38.48 |
|
2016 |
2.250 |
79.45 |
2.157 |
41.30 |
|
2017 |
2.181 |
62.67 |
2.014 |
40.58 |
|
2018 |
2.078 |
51.48 |
2.458 |
39.28 |
Source: World Integrated Trade solution (https://wits.worldbank.org/)
Note. *import and export values are in United States dollar billions.
Partner share represents the share of imports and exports from Zimbabwe’s point of view.