Organizations and Markets in Emerging Economies ISSN 2029-4581 eISSN 2345-0037
2021, vol. 12, no. 2(24), pp. 285–304 DOI: https://doi.org/10.15388/omee.2021.12.57
The Impact of Currency Misalignment on Trade Balance of Emerging Market Economies
Abdullahil Mamun
International Islamic University Chittagong, Bangladesh
ahm.economics@gmail.com
https://orcid.org/0000-0001-6997-4434
Emrah Eray Akça (corresponding author)
Çukurova University, Turkey
emraherayakca@gmail.com
https://orcid.org/0000-0003-4190-5503
Harun Bal
Çukurova University, Turkey
balharun@gmail.com
https://orcid.org/0000-0003-0878-8253
Abstract. This study is an attempt to examine the impact of currency misalignment on the trade balance of emerging market economies from 1980 through 2016. It firstly measures the equilibrium RER and corresponding misalignment series of 21 EMEs separately adopting a single equation approach and then includes them in the trade regression together with undervaluation and overvaluation to estimate the dynamic relationship between the trade balance and real exchange rate misalignment employing the system generalized method of moment estimation approach. The study suggests that, being a composite series of undervaluation and overvaluation, higher real exchange rate misalignment helps recover trade imbalances. It also identifies that undervaluation improves trade balance, while overvaluation cuts it down. The study identifies that the misalignment series of RER for most of the EMEs are substantially dominated by overvaluation episodes, and hence the opposing impact of undervaluation and currency misalignment on the trade balance of EMEs is not surprising. From the policy perspective, competitiveness achieved through currency movements helps emerging market economies not only to improve trade balance but also to withstand vulnerability that arises from huge external borrowings creating a strong external payment position.
Keywords: trade balance, real exchange rate misalignment, undervaluation, overvaluation, emerging market economies
Received: 27/4/2021. Accepted: 20/9/2021
Copyright © 2021 Abdullahil Mamun, Emrah Eray Akça, Harun Bal. Published by Vilnius University Press. This is an Open Access article distributed under the terms of the Creative Commons Attribution Licence, which permits unrestricted use, distribution, and reproduction in any medium, provided the original author and source are credited.
1. Introduction
The surge in international capital flows thanks to the process of financial integration that has gained momentum since the early 1990s conceivably outweighs merchandise trade between countries, and this trend of development has led to a gradual disjunction between real economic activity and exchange rate fluctuations (Béreau et al., 2012). In this respect, a better understanding of the sources of movements in the exchange rate and determination of the long-term values of real exchange rates compatible with the long-term macroeconomic balance may be useful for monetary authorities policy implementations. Real exchange rate (RER), as a comprehensive summary indicator of the prices of goods and services of a country in proportion to the others, has broadly been accepted as a major contributing factor to the macroeconomic performance of any economy and thus has become one of the most widely researched topics in open economies. Among the different interpretations of how the RER dynamics can affect the macroeconomic performance of an economy, researchers and policymakers have agreed that one of the ways is through its impact on the trade balance.
The RER that is conducive to both the internal and external equilibrium of a country is referred to as equilibrium RER. Deviation in RER from its equilibrium value, that is, overvaluation or undervaluation in RER, which is also termed as RER misalignment, exerts considerable impact on the trade balance and thus on the economic performance of open economies (Odedokun, 1997). Misalignment can work as an impediment in allocating resources of an economy between its tradable and non-tradable sectors in accordance with relative cost and productivity differentials by altering investment decisions, and thus the adjustments brought through misalignment can impose a burden of resource misallocation on that economy. Overvaluation of the RER is generally viewed as the unpredictability of the choices of strategies from the macroeconomic perspective that may result in an unsustainable deficit in the current account, a significant rise in external debt, and the risk of possible speculative attacks. However, an undervaluation in RER promotes investment and exports, strengthening the competitive position of economies, which causes the current account position to improve and thereby stimulates output growth of the economies (Jongwanich, 2009; Magud & Sosa, 2013).
The RER misalignment may either be the outcome of government intervention to alter the RER, or it can be the undesired consequence of policies taken to succeed the macroeconomic targets. Countries may be found to have been involved in illicit currency manipulation to affect the trade balance producing ‘fundamental misalignment’ with the motivation of increasing net exports (Staiger & Sykes, 2010). Mamun et al. (2019) argue that the success of South Asian emerging economies is substantially attributed to their outward-oriented trade policies, the bulk of which was associated with exchange rate management. Price-based trade policies to escalate the levels of protection against external rivalry might be destabilized due to misalignment, which can force them to amend trade restrictions to uphold the supply in the pattern it is existing.
The consistently faster growth performance of emerging market economies (EMEs) in comparison with that of the developed economies has made them the key driver of global growth over the last few decades. There is no concrete definition of EMEs, rather they are distinguished based on certain parameters. The International Monetary Fund (IMF) World Economic Outlook classifies 39 economies as advanced economies depending upon their high level of per capita income, exports of diversified goods and services, and greater integration into the global financial system, while the remaining countries are considered “emerging market and developing” economies. Among these countries, the top 40 countries in terms of income are classified as “emerging market and middle income” economies. However, income is not the only parameter that determines an emerging market economy. EMEs maintain a sustained and stable growth performance and can produce high-value-added goods. They resemble advanced economies in some ways such as participation in global trade and financial market integration. In this context, a country is classified as an emerging market economy in terms of its systemic presence (economic size, i. e., nominal gross domestic product (GDP), total population, and export share in global trade), market access (external debt share in global debt, and whether it is included in global indices employed by large international institutions), and income level (GDP per capita) (Duttagupta & Pazarbasioglu, 2021).
Table 1. The Classification of Emerging Market Economies
|
Organization |
Common Countries |
Remaining Countries |
|
IMF |
Brazil, Chile, China, Colombia, Hungary, India, Indonesia, Malaysia, Mexico, Peru, Philippines, Poland, Russia, South Africa, Thailand, and Turkey |
Argentina, Bangladesh, Bulgaria, Pakistan, Romania, Ukraine, and Venezuela |
|
MSCI |
Bangladesh, Czech Republic, Egypt, Greece, Qatar, South Korea, Taiwan, and United Arab Emirates |
|
|
S&P |
Bangladesh, Czech Republic, Egypt, Greece, and Taiwan. |
|
|
Down Jones |
Czech Republic, Egypt, Greece, Qatar, Taiwan, and United Arab Emirates. |
|
|
Russell |
Czech Republic, Greece, South Korea, Taiwan, and United Arab Emirates. |
Source: Authors’ compilation based on relevant institutions.
Since an emerging market lacks an official and common definition, there is a disagreement among institutions on the classification of EMEs. Both the IMF and Morgan Stanley Capital International (MSCI) classify 23 countries as EMEs albeit there are some differences between the two charts. Standard and Poor’s (S&P) and Russell each classify 21 countries as EMEs, while there are 22 EMEs in Dow Jones’ list. Table 1 offers a list of common countries that all five institutions classify as EMEs, and the remaining countries are classified by the individual institution as of 2016.
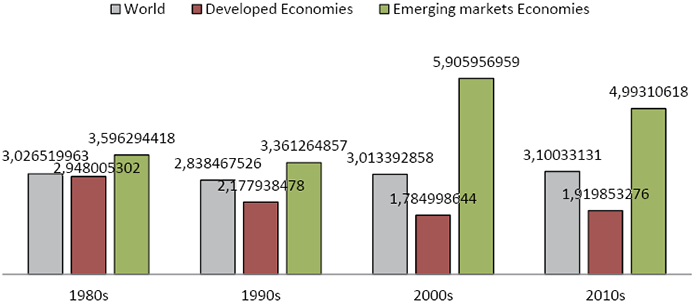
Figure 1. GDP Growth Rate in Past Decades
Source: UNCTAD (2020).
When the growth records of EMEs are observed from a longer-term perspective, they maintain a fairly greater growth rate than the developed economies since the 1980s. As Figure 1 illustrates, while there was a declining trend in the growth performance of developed economies, EMEs experienced higher growth over the first three decades of the sample period, of which the 2000s was remarkable, as average GDP growth in these economies picked at just over 5.9%, which was averaged around 1.8% in developed economies over the same period and thus became a major contributor to the growth of the world GDP. In the last decade despite the slowdown, the growth is averaged at almost 5% compared to 1.92% of developed economies. The growth in EMEs has been on a declining trend since the financial crisis of 2008-09, while a modest recovery has continued in developed economies since 2013. Despite the slowdown of economic growth, EMEs still account for over 70% of global growth (IMF, 2018).
The rising trend in trade is amongst the most important factors behind the resilient growth of EMEs. The trade surplus of EMEs has soared to a record level in recent years, and it is gradually displacing the trade of developed economies. The trade surplus of EMEs reached 46% in the 2010s from that of 39% in the 2000s. Over the same period, the change in trade surplus in developing economies was nominal, and the trade surplus of transition economies rose from 6% to 8% (UNCTAD, 2020). What determines such spark in the trade surplus of EMEs? Does RER misalignment have any impact on the trade balance? This study will critically investigate these issues.
Without ascertaining the equilibrium RER, exchange rate deviations will remain a subjective phenomenon (Edwards & Savastano, 1999; Caporale et al., 2011). Therefore, it is highly necessary to identify the equilibrium RER as well as to examine RER misalignment to evaluate its impact on the trade balance of open economies. Hereby, examining the RER misalignment under different choices of exchange rate and its impact on the trade balance of EMEs is the main purpose of the study. The study will consider economies following floating, free-floating or other managed exchange rate arrangements under monetary aggregate target or inflation targeting framework. EMEs from all major regions of the globe have been covered in undertaking the research. However, inaccessibility of data on some fundamentals restricts the study to attain the REER misalignment estimates for some other EMEs. Accordingly, the study includes 21 EMEs: Argentina, Bangladesh, Brazil, Chile, China, Colombia, Egypt, Greece, India, Indonesia, Malaysia, Mexico, Pakistan, Peru, Philippines, Poland, South Africa, South Korea, Thailand, Turkey, and the United Arab Emirates. Firstly, the study measures the equilibrium RER and corresponding misalignment series of 21 EMEs separately adopting a single equation approach. It then includes them in the trade regression together with undervaluation and overvaluation in order to examine their impact on trade balance of EMEs.
Following the introduction and background of the study in section one, the remainder of the study is organized into the following sections: Section two first presents comprehensive theoretical literature which reviews how exchange rate misalignment affects trade balance together with impact of overvaluation and undervaluation, and then discusses the empirical results of earlier studies examining the link between RER misalignment and trade balance. Section three is devoted to the empirical framework including the derivation of equilibrium RER and corresponding misalignment series of 21 EMEs, the estimation of trade balance model, and the data set used in the study. After the presentation of empirical findings in Section four, the study ends up with Section five which contains conclusions and remarks.
2. Literature Review
The study consults with the available theoretical and empirical literature on the impact of currency misalignment and its two important counterparts, that is, overvaluation and undervaluation on economies trade flows in order to develop an ideal framework for the research.
2.1 Theoretical Literature
Trade flows of an economy can respond to the change in exchange rates in a variety of ways. Being relative prices of tradable to non-tradable goods of an economy and hence capturing the relative costs and productivity of that economy with the rest of the world, RER works as a measure of competitive position that theoretically has considerable impact on the incentive of allocating resources between the tradable and non-tradable sectors (Auboin & Ruta, 2013). Two of the most researched features on the link between exchange rate and international trade concern exchange rate volatility and misalignment. Exchange rate volatility hampers trade and makes investment decisions difficult by imposing additional risks and transaction costs on traders and investors. On the other hand, the impact of misalignment in RER on trade flows is essentially determined by its effects on prices of exports as against the prices of imports. RER misalignment in terms of real undervaluation makes export cheaper thereby making exports and the import-competing sector more attractive in the world market at the expense of the non-tradable sector and consumers (Broz & Frieden, 2008). Hence, the effects of misalignment in RER on prices do not differ from those of an import tax and export subsidy (Nicita, 2013).
The short-term effect of misalignment on trade flows and real economic activity differs from its impact in the long run. A nominal depreciation of the home currency in the short run when prices are sticky brings about a real depreciation of the exchange rate. It implies that products produced abroad become relatively expensive compared to home products. Consequently, there will be expenditure switching as consumers at home will switch to home products, import less, and export more since foreign consumers prefer less costly home products as well. Therefore, the standard macroeconomic framework predicts the trade balance as a rising function of the exchange rate in the short run (Krugman et al., 2012). In the course of long run, when markets are free from distortions, particularly because of fully flexible prices, misalignment has a limited impact on trade flows. But during the short run, some prices may not adjust instantaneously. This sticky behaviour of prices alters the relative prices owing to the fluctuations in nominal exchange rates, which eventually affects trade flows by altering the allocation of resources between the sectors producing tradable and non-tradable goods (Auboin & Ruta, 2013).
The effect of RER misalignment on the trade balance is generally channelled through its impact on trade competitiveness that signifies a country’s gains and losses in selling the products it produces in the international market. Trade competitiveness is achieved when a country can produce products at a lower cost which is better than that of other competing countries in the international market, which greatly determines the external payment position of a country (Clark et al., 1994). A country’s trade competitiveness is largely determined by the movement in the RER (Odedokun, 1997; Edwards & Golub, 2004). Other things remaining the same, undervaluation of exchange rates gives incentive to domestic exporters to compete in the international market making exports cheaper. It also gnaws the competitiveness of the export-competing sector by making imports more expensive. This phenomenon can be explained in the framework of the Marshall – Lerner condition, which advocates that depreciation (or devaluation in fixed or semi-fixed exchange rate regime) improves current account if the sum of demand elasticities of export and import exceeds unity. However, two opposing forces due to depreciation are the price effect and volume effect. The price effect worsens the current account by making exports cheaper in terms of foreign currency and imports expensive in terms of home currency. On the contrary, the volume effect leads to an improvement in the current account as cheaper exports stimulate export volume, while the volume of imports falls due to being expensive. This leaves the issue of the trade balance effect of currency depreciation empirical. Though appreciation or depreciation of exchange rate does not guarantee the loss or gain of competitiveness, movements of domestic wages and prices (the so-called internal interventions) do matter (Bajo-Rubio et al., 2016); many countries around the world operating under both fixed and flexible exchange rate regimes have undervalued their currencies to improve their trade balances since the early 1970s.
Baldwin and Krugman (1989) and Clark et al. (1994) explain how currency overvaluation can be the cause of persistent loss of trade competitiveness with the notion of ‘hysteresis effect’ – an effect that persists when its causes are removed. They argue for the role of invisible assets like distribution networks, consumer loyalty, and reputations on the competitiveness of an economy along with the role of price and installed capacity. During the period of sustained misalignment, firms abroad may have invested in invisible assets, leading to a loss in the market share of domestic firms that cannot be recovered merely through a return of the domestic currency to its steady-state value. However, McCausland (2002) explains the same from a different perspective. An unanticipated policy change that reduces domestic competitiveness and enhances importers’ return may drive foreign firms to enter into the industry if an adjustment is not prompt. This would have a feedback effect on trade and competitiveness that would reduce the competitiveness of domestic firms further. An unanticipated change of policy at the same but opposite scale to the initial policy change that triggered new foreign firms to enter will not drive them to exit and consequently, the domestic firm will not regain its market share and competitiveness.
2.2 Empirical Literature
Though the economic literature on fluctuations in the exchange rate and trade relationship evolved during the 1970s through the 1990s as a logical response towards the culmination of the gold standard by the adjustable system of exchange rates, empirical literature in the area of RER misalignment and trade relationship is relatively slim and has gained more prominence after 2000. The study of IMF (1984) in response to increased exchange rate variability immediately after the collapse of the Bretton Woods Agreement explained how trade could be affected by RER misalignment. Accordingly, trade flows can be destabilized owing to improper price signals resulting from inflation rate or cost differentials attributed to wider and deeper exchange rate fluctuations and persistent misalignment of exchange rates away from equilibrium levels.
Appreciation of the exchange rate and its volatility is thought to affect the export performance of open economies adversely. Sekkat and Varoudakis (2000) used three indicators – RER changes, RER volatility, and RER misalignment to examine how exchange rate policies have an impact on manufactured export performance on a panel of major Sub-Saharan African countries for the 1970–1992 period and suggested that exchange rate management significantly determines their export performance. In particular, the study found an indirect relationship between RER misalignment and manufactured exports. However, they argue that manufactured exports are more responsive (positively) to a decrease in misalignment than a real depreciation. Jongwanich (2009) examined the equilibrium RER and its misalignments in developing Asian countries between 1995 and 2008. While investigating the relationship between RER misalignment and the performance of export, the study identified a direct relationship between the RER and export performance in contrast to an opposite association between misalignment and the value of export almost in all countries. It implies that though depreciation in RER leads to higher exports and thus to the higher trade balance, RER misalignment, together with real appreciation, could harm export performance.
Nouira et al. (2011) attempted to investigate the role of persuasive exchange rate strategy in line with price stimuli on manufactured exports for 52 developing countries during the period 1991–2005 and identified that many of the countries undervalue their currencies aiming to ensure price competitiveness to foster manufactured exports. Even though improving price competitiveness through the undervaluation of domestic currencies imposes the cost of macroeconomic disequilibrium on the economies, the starring role of RER misalignment in terms of undervaluation in fostering manufactured exports is well established. RER misalignment is supposed to play an acute role in this conjuncture. Kodongo and Ojah (2013) investigated it empirically employing panel VAR techniques for nine major African countries drawing on yearly data during 1993–2009 and found that the currency deprecation led to improving trade balance in the short run. On the other hand, setting home product prices in a foreign currency or a vehicle currency like the US dollar and euro is a sign of import restrictions rather than export promotion and dispenses a different impact of depreciation on trade balance (Staiger & Sykes, 2010).
Iyke and Ho (2017) examined the impact of exchange rate change on trade balance of Ghana using linear and nonlinear specifications considering quarterly data for the period 1986-2016. The study found no evidence in support of the J-curve phenomenon short-term deterioration and the long-term improvement of the trade balance due to exchange rate change in the linear specification which is true for the non-linear specification. While retesting the J-curve by using quarterly data for South Africa and her key trade partners China, Germany, India, Japan, the UK and the USA, Iyke and Ho (2018) found the linear specification to support the J-curve phenomenon in only two cases – India and the USA under relaxed conditions. In contrast, the nonlinear specification supported the J-curve phenomenon in all cases. Examining the association between exchange rate movements, volatility, and aggregate exports of goods and services among ASEAN economies over the period 1995–2011, Tan et al. (2019) suggests that the adverse impact of an appreciation of RER on real gross export is mostly compensated by the high contribution of foreign value-added part embodied in exports. At the same time, a high foreign value-added share also dampens the negative association between exports and increased RER volatility.
Recently, some empirical studies have investigated the impact of RER misalignment on trade balance focusing on EMEs. In one of them, for the period of 2000Q1-2016Q1, Nasir and Jackson (2019) examined the impact of RER misalignment on the trade balance of 10 countries, of which 5 have the trade deficit and the other 5 have the trade surplus. According to their findings, misaligned RER gave rise to trade imbalances in the case of China, India, and Turkey, whereas no significant association was found between RER misalignment and trade imbalance for Russia. Abbas et al. (2020) examined the impact of misalignment in the currency of China being one of the primary EMEs on a few macroeconomic indicators of itself and its main 30 trade partners by employing the data of the 1992-2017 period. They found the stimulating effect of the devaluation of China’s currency on its exports but the deteriorating effect on its imports. Estimating the long-run equilibrium RER of eight EMEs from 1995 to 2017, Banerjee and Goyal (2021) also analysed the impact of RER misalignment on trade imbalances and concluded that misaligned RER has a restricted impact on trade imbalances, which indicates that the incentive to devalue was low. Considering the BRICS (Brazil, Russia, India, China, and South Africa) countries, which are also among the major EMEs, Rikhotso and Bonga-Bonga (2021) investigated the relationship between RER misalignment and trade balance for the 1990-2016 period and found evidence of an asymmetric relationship between the two variables. The study suggests that the overvaluation of the currencies of BRICS countries led to a deterioration in trade balance, whereas undervaluation improved it.
The review of the existing empirical studies shows that most of them examine the trade balance effect of exchange rate fluctuations and very few of them include RER misalignment as one of the explanatory variables. Recent studies that include the RER misalignment examine its impact on trade balance in a time series framework applying VAR models. Only Rikhotso and Bonga-Bonga (2021) did investigate the currency misalignment and trade balance relationship applying panel data techniques, but the estimation techniques they use largely ignore the issue of endogeneity, and robustness of results is criticized due to the inclusion of limited number of countries. Hence, RER misalignment for a large group of EMEs and its impact on the trade balance of these economies in a dynamic panel setting addressing the issues discussed so far is necessary to arrive at more reasonable decisions that the study is going to deal with.
3. Empirical Framework
3.1 Estimation of Real Exchange Rate Misalignments
The main purpose of the study is to examine the impact of RER misalignments on the trade balance of EMEs. Therefore, the first order of business is to determine the misalignment series of RER. RER is misaligned when it strays from its long-term equilibrium values. Equilibrium RER is an unobservable entity and therefore its estimation is inevitable to produce the misalignment series to study its impact on the trade balance of economies. In this section, we shall design the theoretical and empirical constructs for the estimation of equilibrium RER, which will then be used to generate the misalignment series of EMEs.
This study estimates the equilibrium RER empirically for each of the countries separately adopting the single equation approach offered by Edwards (1989) and Elbadawi (1994). The approach assumes that the long-run equilibrium RERs is likely to be determined by a set of economic fundamentals. The fundamentals they use include terms of trade (TOT), government spending on non-tradable goods (GN), government spending on tradable goods (GT), investment (I), trade openness (OPEN). However, the theory underlying this approach offers a relatively wide range of fundamentals to choose from in developing the model. In addition to the aforesaid fundamentals, net financial assets position (NFA), the relative productivity in the tradable sector to non-tradable sector (PROD), real interest rate differentials (RIRD), and official development assistance (ODA) to model the equilibrium RER are considered. Due to unavailability of data of government spending on non-tradable and tradable goods throughout the sample period, the data of total government spending (G) is used in the theoretical model of equilibrium RER (q*) determination that takes the following form:
 (1)
(1)
The empirical model for estimating the association between RER and fundamentals that determine it can, therefore, be given as
 (2)
(2)
It is expected that net financial assets position, relative productivity in the tradable sector to non-tradable sector, real interest rate differentials, and official development assistance have a positive impact on RER, while it is inversely related to trade openness. However, the impact of terms of trade, government spending, and investment can either be positive or negative.
To estimate the long-run parameters of the model in Equation 2, the approach involves the following steps: the first is to examine the stationarity or order of integration of the variables. The second step involves estimation of the long-run co-integration relationship among the variables that are integrated of the same order, that is, of order 11. A unique combination of fundamentals may not always form a long-run relationship with RER irrespective of countries. Consequently, the study will consider alternative combinations of fundamentals for estimating the long-run co-integration relationship, and the final choice will be based on the following criteria proposed by Montiel (2007). Specification for which there exists a long-run cointegration relationship among the variables and compliance with all necessary diagnostic checks will be taken into account. For the specification, the estimated parameters must be stable, signed according to economic theory, and significant. For more than one such specification, preference will be given to the one that minimizes the information criteria.
The presence of co-integration relationship infers the existence of a long-run equilibrium relationship between RER and its fundamentals. Therefore, it is necessary to obtain the sustainable values of the fundamentals that explain the long-run behaviour of RER, which is the third step of the procedure. Detrending the explanatory variables of the desirable specification derived by the Hodrick-Prescott filtering process will enable us to attain the sustainable or permanent values of the fundamentals, which can then be used to arrive at the long-run equilibrium values of RER. Finally, the misalignment series can be derived by simply taking the difference between actual and long-term equilibrium values of RER in terms of percent.
3.2 Trade Balance Model
The RER misalignment series2 derived above equipped us to examine the impact of RER misalignment on the trade balance. One of the most important issues regarding estimation of the trade balance model is the aggregation bias problem named by Bahmani-Oskooee and Brooks (1999). This measurement problem appears due to the consideration of the rest of the world’s income as income abroad, which requires constructing proxies for both incomes of the rest of the world and a country’s real exchange rate against the rest of the world. This problem can be solved by examining the association between exchange rate and trade balance from the bilateral point of view. Therefore, Bahmani-Oskooee and Brooks (1999) show trade balance as a function of real GDP, an index of real GDP of trading partners, and bilateral RER.
The traditional approach to build the trade balance model is to consider the domestic income, foreign income, and bilateral RER as explanatory variables. But, since we focus on the association between RER misalignment and trade balance, the variable of RER misalignment is added to the traditional trade balance model following Jongwanich (2009), who investigated the impact of the real effective exchange rate (REER) and RER misalignment together on total export volume, and Hsiao et al. (2012), who included relative income growth of trading partner, bilateral exchange rate and its volatility as explanatory variables in their trade model. Accordingly, the trade balance model for the EMEs relying on panel data is as follows:
 (3)
(3)
In Equation 3, TBijt measures trade balance as the ratio of home country i’s export to the rest of the world j to home country i’s import from the rest of the world j. Yit and Yjt are the income of home country i and the rest of the world j, respectively, measured in terms of an index of respective real GDP. REERijt is bilateral REER, and Mit is the misalignment of REER for the home country.
Initially, the study takes account of the undervaluation and overvaluation series constructed above and incorporates them in a separate trade equation to examine their corresponding impact on the trade balance. The trade equation with undervaluation and overvaluation series takes the following form:

 (4)
(4)
where underit and overit represent undervaluation and overvaluation, respectively. The undervaluation and overvaluation series are constructed decomposing the misalignment series of REER into its two counterparts – one incorporating the negative values or zero otherwise for the former and another incorporating the positive values or zero otherwise for the latter series. The model is designed in a dynamic fashion confirmed by inserting the lagged dependent variable TBij, t-1, the trade balance at the initial period, as a regressor to employ the dynamic panel generalized method of moments (GMM) estimation approach offered by Arellano and Bond (1991) and Blundell and Bond (1998). The study decided to employ the system GMM (SGMM) estimation approach because of its certain advantages. This estimation approach is preferred in examining the performance of macroeconomic variables in order to address the potential endogeneity problem which is encountered when some regressors are expected to be explained by unobserved common factor and must be checked to eliminate prospective bias in the estimated parameters (Ju et al., 2010; Schröder, 2017; Chiu and Ren, 2019). Besides, GMM estimators can be attractive since in many circumstances, they are robust to failures of auxiliary distributional assumptions that are not needed to identify key parameters. The instrumenting process of the standard GMM, also known as difference GMM proposed by Arellano and Bond (1991), works poorly in the presence of autocorrelation among errors due to which the resulting estimators could be imprecise or even biased. This swayed Arellano and Bover (1995) and Blundell and Bond (1998) to develop SGMM estimator. They extend the Arellano-Bond estimator based on the assumption of no correlation between instrumenting variables at first differences and fixed effects which allow them to introduce more instruments, which boosts the efficiency of estimators sharply. Bond et al. (2001) also argue that identification technique of SGMM is most suitable to produce more reasonable results.
The study then comprises the non-episodic absolute RER misalignment series in the regression equation to examine its impact on trade balance:
 (5)
(5)
The effect of change in domestic real income is uncertain: domestic real income growth may cause deficit by reducing trade balance stimulating imports, or it may lead to trade surplus if the rise in domestic real income results from an increase in production of goods that substitute imports due to which imports fall and trade balance rises. Therefore, the coefficient attached to domestic real income can be positive or negative. Traditionally, the increase in domestic real income is expected to reduce trade balance and therefore α2 is likely to be negative. An increase in real income of the rest of the world may improve the trade balance of the home country boosting demand for its exports (demand – side effect) or it may deter the trade balance of the home country deterring demand for exports particularly when the increase in income of the rest of the world is owing to the production of goods that substitute home country’s exports (supply – side effect). The ultimate sign of coefficient α3 can either be positive or negative depending on the relative power of demand – side and supply – side factors.
Two possible effects of a real depreciation reflected by a rise in REER are the price effect and volume effect. Due to a real depreciation, the price effect worsens the trade balance making exports cheaper, while the volume effect improves trade balance increasing export volume. If the volume effect is strong enough to outweigh the price effect, a real depreciation will improve the trade balance, and α4 will be positive. Conversely, higher overvaluation makes export less competitive and worsens trade balance, and the associated coefficient should be negative. Concerning the specification (4), higher undervaluation refers to higher competitiveness and higher trade balance, being undervaluation negative; the resulting undervaluation coefficient should be negative as well. Conversely, higher overvaluation makes export less competitive and worsens trade balance; the associated coefficient should be negative. Hence, both undervaluation and overvaluation coefficients should be negative, that is, θ1, θ2 < 0. Any distortions of RERs from their equilibrium values are expected to degrade the trade balance and hence α5 is anticipated to be negative.
3.3 Dataset
The annual frequency data on real domestic income, the income of the rest of the world, export and import are taken from the UNCTAD. Due to the absence of a unique source for comprehensive data on REER, data on the variable is compiled from various sources that include BRUEGEL, FRED, and IMF-IFS. However, the study was cautious in maintaining a common price index, namely consumer price index while collecting REER data. The trade balance and REER variables are transformed into the natural logarithm. Detailed description of the variables is presented in Table A (see the Appendix). The sample period is divided into non-intersecting 5-year intervals over which the data of the variables are averaged. This averaging is required to check non-seasonal components of time series variables similar to cyclical variation to embody the long-run perspective of data. Consequently, it produces 8 non-intersecting 5-year intervals over the sample period 1980-2016 apart from the last one that covers only two years. Outliers are identified for all of the series and excluded from the analysis to avoid any inconsistency.
4. Empirical Findings
Table 2 summarizes the impact of undervaluation segregated from overvaluation along with the impact of RER misalignment under both the fixed effect (FE) and SGMM estimators and presents pre- and post-diagnostic test results. As the Hausman test rejects the random effect model, the FE estimator is appropriate for the case. As far as the GMM specifications are concerned, the study primarily carries out the Wooldridge, Breusch-Pagan, and Wu-Hausman tests to identify whether there is prevalence of autocorrelation, heteroskedasticity, and endogeneity, respectively. Statistically significant test statistics at 1% level of significance for all these tests indicate that autocorrelation, heteroskedasticity, and endogeneity prevail in the model. Therefore, the chosen SGMM approach is suitable for studying the dynamic relationship between trade balance and regressors. As for post-diagnostic checks, significant AR (1) test statistic confirms autocorrelation among residuals at first order, however, autocorrelation among residuals at second order is absent as the AR (2) test statistics for all the cases are insignificant. Such an insignificant AR (2) test statistic validates the internal instrumentation structure used by SGMM. The study considers lagged trade balance as endogenous and the other regressors as extremely exogenous. The Hansen test statistics accept the null hypothesis of over-identifying restrictions for all SGMM specifications, and therefore instruments used for the SGMM estimations are overall valid. The number of instruments lies below the number of cross-sections, which means the estimated SGMM models are not subject to ‘over-fitting bias’.
Table 2. Determinants of Trade Balance of EMEs: The Relationship Between Real Exchange Rate Misalignment and Trade Balance
|
Dependent Variable: Trade Balance |
||||||
|
Regressors |
FE (1) |
SGMM (2) |
FE (3) |
SGMM (4) |
FE (5) |
SGMM (6) |
|
TBij, t-1 |
0.414* (5.313) |
0.689* (19.380) |
0.441* (6.044) |
0.582* (9.970) |
0.440* (6.100) |
0.651* (17.010) |
|
Yi |
-0.019 (0.251) |
-0.139* (5.530) |
-0.069 (0.974) |
-0.131* (4.350) |
-0.081 (1.155) |
-0.136* (5.490) |
|
Yj |
-0.077 (0.636) |
0.136** (2.270) |
0.017 (0.142) |
0.210* (2.950) |
0.048 (0.413) |
0.171* (3.200) |
|
REER |
-0.214* (2.744) |
-0.295* (3.690) |
-0.134** (1.775) |
-0.265* (4.500) |
-0.126*** (1.683) |
-0.180** (2.220) |
|
Undervaluation |
- |
- |
-0.009* (3.994) |
-0.010* (5.400) |
-0.015* (3.705) |
-0.017* (4.800) |
|
Overvaluation |
- |
- |
-0.002 (1.338) |
-0.001*** (2.020) |
0.005 (1.338) |
0.005 (1.610) |
|
Misalignment |
-0.002 (1.274) |
-0.001*** (1.710) |
- |
- |
-0.007** (2.039) |
-0.007*** (1.960) |
|
Pre- and Post-diagnostic Tests |
||||||
|
Hausman Test (p-value) |
26.57* (0.001) |
- |
41.3* (0.000) |
- |
54.25* (0.000) |
- |
|
Observations |
143 |
143 |
143 |
143 |
143 |
143 |
|
Cross Section |
21 |
21 |
21 |
21 |
21 |
21 |
|
Adjusted-R2 |
0.780 |
|
0.815 |
|
0.815 |
|
|
AR(1) p-value |
- |
0.005 |
- |
0.006 |
- |
0.009 |
|
AR(2) p-value |
- |
0.216 |
- |
0.499 |
- |
0.466 |
|
Hansen Test (p-value) |
- |
15.29*** (0.054) |
- |
11.89 (0.219) |
- |
15.02*** (0.090) |
|
Instrument |
- |
14 |
- |
16 |
- |
17 |
|
Wooldridge Test (p-value) |
- |
31.517* (0.000) |
- |
41.314* (0.000) |
- |
33.274* (0.000) |
|
Breusch-Pagan Test (p-value) |
- |
121.09* (0.000) |
- |
116.31* (0.000) |
- |
115.63* (0.000) |
|
Wu-Hausman Test (p-value) |
- |
434.93* (0.000) |
- |
358.43* (0.000) |
- |
356.33* (0.000) |
Note. *, **, and *** indicate statistical significance at 1%, 5% and 10% levels, respectively. Figures below the coefficients in parentheses are t-statistics.
Concerning the estimated coefficients, most of them bear theoretically expected signs. The significant positive lagged trade balance coefficients for all specifications imply that the trade balance of the current period is stirred by the increase in trade balance at the initial period. Coefficients accompanying the home real income are negative for all specifications but insignificant for standard FE estimates and significant for SGMM estimates that vary marginally. 1% increase in home real income causes the trade balance to fall by 0.14%. Except for Model 1 (in Column 1), the standard FE estimators assert an insignificant positive coefficient of real income of the rest of the world, however, the coefficients are significant and positive for all SGMM estimates, which indicates that trade balance is increased by 0.13% according to the baseline model (in Column 2) responding to 1% increase in real income of the rest of the world.
REER bears negative significant coefficients for all cases, which denote that a real depreciation brings about a fall in the trade balance. 1% depreciation represented by an equivalent increase in REER increases imports of EMEs from the rest of the world compared with their exports to the rest of the world by nearly 0.29% for the baseline model, while the figure is 0.18% for the augmented model (in Column 6). It implies that the price effect dominates over the volume effect of depreciation in EMEs.
The undervaluation coefficients are highly significant and negative for all specifications. The SGMM estimates indicate that the trade balance increases by 0.01% to 0.02% due to a 1% increase in undervaluation. The only case for which the overvaluation coefficient is significant maintains a theoretically expected sign, which is negative, indicating that a 1% increase in overvaluation deters trade balance by 0.001%. Finally, the RER misalignment coefficients are negative for all specifications and insignificant only for the baseline standard FE model. The negative significant coefficient for all the three other variants of analysis signifies the adverse impact of RER misalignment on the trade balance, a distortion of RER from its equilibrium value by 1% causes trade balance to fall by 0.001% as evident from the baseline model, which is 0.007% for the augmented model (in Column 6).
5. Conclusions
The trade balance effect of currency movements is a wide research topic in economic literature. Most of the studies evaluate the impact of exchange rate volatility on countries’ competitive positions. Studies on the impact of currency misalignment on trade balance are relatively scarce and are hardly available for EMEs in recent years. The study measures the RER misalignment for 21 EMEs and includes it in the trade regression together with undervaluation and overvaluation to get a complete picture of how currency movements influence the trade balance of the EMEs. The study suggests that higher RER misalignment helps recover trade imbalances. It also identifies that undervaluation improves trade balance, while overvaluation cuts it down.
The results of the study have important policy implications. Movement in the RER is perceived to be one of the factors that largely determines the trade competitiveness of the economies. Trade competitiveness is achieved when a country can produce better products at a lower cost than other countries competing in the international market. Currency undervaluation is supposed to increase the competitiveness of a country and is expected to escalate exports and curb imports and thereby improve the trade balance. One of the core observations of the study is that the misalignment series of RER for most of the EMEs are substantially dominated by overvaluation episodes. Consequently, the opposing impact of undervaluation and currency misalignment on the trade balance of EMEs is not surprising. Most importantly, a strong external payment position achieved through greater competitiveness can help EMEs repeal the vulnerability that arises from huge external borrowings. The findings of the study can further be explained by the relatively high export capacity in comparison to the import dependence of EMEs, which implies that these economies should reinforce their export promoting exchange rate policies to drive the trade balance in desired directions.
Acknowledgements
The authors would like to thank the journal’s editor and anonymous reviewers for their helpful comments and suggestions that greatly improved this study.
References
Abbas, S., Nguyen, V. C., Yanfu, Z., & Nguyen, H. T. (2020). The impact of China exchange rate policy on its trading partners evidence based on the GVAR model. Journal of Asian Finance, Economics and Business, 7(8), 131-141. https://doi.org/10.13106/jafeb.2020.vol7.no8.131
Arellano, M., & Bond, S. (1991). Some tests of specification for panel data: Monte Carlo evidence and an application to employment equations. The Review of Economic Studies, 58, 277–297. https://doi.org/10.2307/2297968
Arellano, M., & Bover, O. (1995). Another look at the instrumental variable estimation of error-components models. Journal of Econometrics, 68, 29–51. https://doi.org/10.1016/0304-4076(94)01642-D
Auboin, M., & Ruta, M. (2013). The relationship between exchange rates and international trade: A literature review. World Trade Review, 12(3), 577-605. https://dx.doi.org/10.2139/ssrn.1955847
Bajo-Rubio, O., Berke, B., & Esteve, V. (2016). The effects of competitiveness on trade balance: The case of Southern Europe. Economics: Open-Assessment E-Journal, 10(30), 1-27. http://dx.doi.org/10.5018/economics-ejournal.ja.2016-30
Bahmani-Oskooee, M., & Brooks, T.J. (1999). Bilateral J-curve between U.S. and her trading partners. Weltwirtschaftliches Archive, 135(1), 156–165.
Baldwin, R. & Krugman, P. (1989). Persistent trade effects of large exchange rate shocks. The Quarterly Journal of Economics, 104(4), 635-654. https://doi.org/10.2307/2937860
Banerjee, K., & Goyal, A. (2021). Behavioural equilibrium real exchange rates and misalignments: Evidence from large emerging markets. Economic Analysis and Policy, 70, 414-436. https://doi.org/10.1016/j.eap.2021.03.004
Béreau, S., Villavicencio, A.L., & Mignon, V. (2012). Currency misalignments and growth: A new look using nonlinear panel data methods. Applied Economics, 44(27), 3503-3511. https://doi.org/10.1080/00036846.2011.577022
Blundell, R., & Bond, S. (1998). Initial conditions and moment restrictions in dynamic panel data models. Journal of Econometrics, 87, 115–143. https://doi.org/10.1016/S0304-4076(98)00009-8
Bond, S.R., Hoeffler, A., & Temple, J. (2001). GMM estimation of empirical growth models. Economics Papers, Working Paper No. 21, Nuffield College, University of Oxford.
Broz, J. L., & Frieden, J. A. (2006). The political economy of exchange rates. In B. Weingast & D. Wittman (Eds.), Oxford Handbook of Political Science (pp. 587-97). Oxford University Press. http://doi:10.1093/oxfordhb/9780199548477.003.0032
Caporale, G. M., Hadj Amor, T., & Rault, C. (2011). International financial integration and real exchange rate long-run dynamics in emerging countries: Some panel evidence. The Journal of International Trade & Economic Development, 20(6), 789-808. https://doi.org/10.1080/09638190903365948
Chiu, Y. B., & Ren, R. (2019). Trade balance, savings rate, and real exchange rate: Evidence from China and its trading partners. Emerging Markets Finance and Trade, 55(2), 351-364. https://doi.org/10.1080/1540496X.2018.1431882
Clark, P. B., Bayoumi, T., Bartolini, L., & Symansky, S. A. (1994). Exchange rates and economic fundamentals: A framework for analysis. IMF Occasional Paper.
Duttagupta, R., & Pazarbasioglu, C. (2021). MILES to go. International Monetary Fund Finance & Development. Available Online: https://www.imf.org/external/pubs/ft/fandd/2021/06/pdf/the-future-of-emerging-markets-duttagupta-and-pazarbasioglu.pdf.
Edwards, S. (1989). Exchange rate misalignment in developing countries. The World Bank Research Observer, 4(1), 3-21. https://doi.org/10.1093/wbro/4.1.3
Edwards, S., & Savastano, M. A. (1999). Exchange rates in emerging economies: What do we know? What do we need to now? NBER Working Paper 7228, Cambridge, MA. https://doi.org/10.3386/w7228
Edwards, L., & Golub, S. S. (2004). South Africa’s international cost competitiveness and exports in manufacturing. World Development, 32(8), 1323-1339. https://doi.org/10.1016/j.worlddev.2004.03.005
Elbadawi, I. A. (1994). Estimating long-run equilibrium real exchange rates. In J. Williamson (Ed.), Estimating equilibrium exchange rates. Institute for International Economics, Washington, D.C.
Hsiao, Y. M., Pan, S. C., & Wu, P. C. (2012). Does the central bank’s intervention benefit trade balance? Empirical evidence from China. International Review of Economics and Finance, 21(1), 130–139. https://doi.org/10.1016/j.iref.2011.05.006
IMF (1984). Exchange Rate Volatility and World Trade. International Monetary Fund, Washington, D.C., United States.
IMF (2018). World Economic Outlook Report. Available Online: https://www.imf.org/external/datamapper/datasets
Iyke, B. N., & Ho, S. Y. (2017). The real exchange rate, the Ghanaian trade balance, and the J-curve. Journal of African Business, 18(3), 380-392. https://doi.org/10.1080/15228916.2017.1315706
Iyke, B. N., & Ho, S. Y. (2018). Nonlinear effects of exchange rate changes on the South African bilateral trade balance. The Journal of International Trade & Economic Development, 27(3), 350-363. https://doi.org/10.1080/09638199.2017.1378916
Ju, J., Wu, Y., & Zeng, L. (2010). The impact of trade liberalization on the trade balance in developing countries. IMF Staff Papers, 57(2), 427-449. https://doi.org/10.1057/imfsp.2009.19
Jongwanich, J. (2009). Equilibrium Real Exchange Rate, Misalignment, and Export Performance in Developing Asia. Asian Development Bank Economics Working Paper Series, No: 151. https://dx.doi.org/10.2139/ssrn.1604839
Kodongo, O., & Ojah, K. (2013). Real exchange rates, trade balance and capital flows in Africa. Journal of Economics and Business, 66, 22-46. https://doi.org/10.1016/j.jeconbus.2012.12.002
Krugman, P. R., Obstfeld, M., & Melitz, M. J. (2012). International Economics: Theory and Policy. Addison-Wesley, Massachusetts, USA.
Magud, N., & Sosa, S. (2013). When and why worry about real exchange rate appreciation? The missing link between Dutch disease and growth. Journal of International Commerce, Economics and Policy, 04(02), 1–27. https://doi.org/10.1142/S1793993313500099
Mamun, A., Bal, H., & Akça, E. E. (2019). The export-output growth nexus in Bangladesh: A leveraged bootstrap approach. Journal of Asia Business Studies, 13(2), 196-213. https://doi.org/10.1108/JABS-09-2017-0159
McCausland, W. D. (2002). Exchange rate hysteresis: The effects of overshooting and short‐termism. Economic Record, 78(240), 60-67. https://doi.org/10.1111/1475-4932.00039
Montiel, P. J. (2007). Equilibrium real exchange rates, misalignment and competitiveness in the Southern Cone. CEPAL, Economic Development Division, United Nations Publications, Santiago, Chile.
Nasir, M. A., & Jackson, K. (2019). An inquiry into exchange rate misalignments as a cause of major global trade imbalances. Journal of Economic Studies, 46(4), 902-924. https://doi.org/10.1108/JES-03-2018-0102
Nicita, A. (2013). Exchange rates, international trade and trade policies. International Economics, 135, 47-61. https://doi.org/10.1016/j.inteco.2013.10.003
Nouira, R., Plane, P., & Sekkat, K. (2011). Exchange rate undervaluation and manufactured exports: A deliberate strategy? Journal of Comparative Economics, 39(4), 584-601. https://doi.org/10.1016/j.jce.2011.08.002
Odedokun, M. O. (1997). An empirical analysis on the determinants of the real exchange rate in African countries. Journal of International Trade & Economic Development, 6(1), 63-82. https://doi.org/10.1080/09638199700000005
Rikhotso, P., & Bonga-Bonga, L. (2021). Exchange rate misalignments and current accounts in BRICS countries. MPRA Working Paper No. 170973.
Schröder, M. (2017). The equilibrium real exchange rate and macroeconomic performance in developing countries. Applied Economics Letters, 24(7), 506–509. https://doi.org/10.1080/13504851.2016.1205718
Sekkat, K., & Varoudakis, A. (2000). Exchange rate management and manufactured exports in Sub-Saharan Africa. Journal of Development Economics, 61(1), 237-253. https://doi.org/10.1016/S0304-3878(99)00067-X
Staiger, R. W., & Sykes, A.O. (2010). Currency manipulation and world trade. World Trade Review, 9(4), 583-627. https://doi.org/10.1017/S1474745610000340
Tan, K. G., Trieu Duong, L. N., & Chuah, H. Y. (2019). Impact of exchange rates on ASEAN’s trade in the era of global value chains: An empirical assessment. The Journal of International Trade & Economic Development, 28(7), 873–901. https://doi.org/10.1080/09638199.2019.1607532
BRUEGEL (2020). https://bruegel.org/publications/datasets/
FRED (2020). https://fred.stlouisfed.org/
IMF-IFS (2020). https://data.imf.org/?sk=4C514D48-B6BA-49ED-8AB9-52B0C1A0179B
OECD (2020). https://www.oecd-ilibrary.org/statistics
UNCTAD (2020). https://unctadstat.unctad.org/wds/ReportFolders/reportFolders.aspx
WB-WDI (2020). https://databank.worldbank.org/source/world-development-indicators
Appendix
Table A. Variables, Descriptions, and Sources
|
Variables |
Descriptions |
Sources |
|
Government |
Government consumption as a percent of GDP |
WB-WDI; UNCTAD; IMF-IFS (2020) |
|
Investment Spending |
Proxied by real gross capital formation as a percent of GDP |
|
|
Terms of Trade |
The ratio between the export and import price index |
|
|
Trade Openness |
The sum of exports and imports as a percent of GDP at constant prices |
|
|
Relative Productivity |
Productivity Differentials have been proxied by the relative productivity between EMEs and Group of Seven (G-7) countries |
|
|
Interest rates |
Long-term rate of interest measured by government bond rates is used |
|
|
Real Domestic Income |
GDP in US Dollars at constant prices (2010) |
|
|
Income of the Rest of the World |
World GDP over the GDP of EMEs in US dollars at constant prices (2010) |
|
|
Exports |
Exports of goods and services in US dollars at constant prices (2010) |
|
|
Imports |
Imports of goods and services in US dollars at constant prices (2010) |
|
|
Net Foreign Assets |
Net foreign assets as a percent of GDP at constant price |
|
|
Official Development Assistance |
Total, as a percentage of gross national income |
OECD (2020) |
|
Real Effective Exchange Rate |
Data on the variable is compiled from various sources, but the study cautiously maintains a common price index (CPI) and common base year while collecting REER data |
BRUEGE; FRED (2020) |
|
RER Misalignment |
Mean value of absolute misalignment |
Authors’ calculations |
|
Undervaluation & Overvaluation |
The undervaluation and overvaluation series are constructed by decomposing the misalignment series into its two counterparts – one including the negative values or zero otherwise for the former and the other incorporating the positive values or zero otherwise for the latter series. |