Organizations and Markets in Emerging Economies ISSN 2029-4581 eISSN 2345-0037
2022, vol. 13, no. 1(25), pp. 260–275 DOI: https://doi.org/10.15388/omee.2022.13.79
The Relationship Between Trading Volume and Market Returns: A VAR/Granger Causality Testing Approach in the Context of Saudi Arabia
Hanan Alhussayen
King Saud University, Saudi Arabia
https://orcid.org/0000-0002-3141-8659
halhussayen@ksu.edu.sa
Abstract. This paper investigates the relationship between trading volume and market returns in the Saudi stock market. Daily data of number of shares traded and TASI returns from 2010 till mid-2021 are used for the same. The Granger causality test reveals a unidirectional relationship from returns to volume. This is supported by the findings of the VAR test and the Impulse Response Function (IRF) test. Trading volume does not carry informational content and cannot predict prices. Returns do impact volume, but the effect is not steady. The results do not provide support for the Sequential Information Arrival Hypothesis (SIAH). The asymmetric information model and the difference of opinion model can provide an explanation for the obtained results.
Keywords: trading volume, market returns, Sequential Information Arrival Hypothesis (SIAH), VAR, Granger causality
Received: 21/8/2021. Accepted: 25/3/2022
Copyright © 2022 Hanan Alhussayen. Published by Vilnius University Press. This is an Open Access article distributed under the terms of the Creative Commons Attribution Licence, which permits unrestricted use, distribution, and reproduction in any medium, provided the original author and source are credited.
1. Introduction
One of the important aspects of a strong and developed economy is its stock market. It helps in fostering the economy’s growth and provides the required capital to businesses. Trading volume and market returns are considered essential indicators for any stock market, and the relationship between the two can have an implication on trading strategies and market efficiency (Adhikari, 2020). This paper studies the relationship between trading volume and market returns in the Saudi context to determine whether either of these two market indicators affects the other. Trading volume can reflect new information reaching the market, which in turn might affect the investor’s investment decisions (Harris & Raviv, 1991; Mahajan & Singh, 2009). On the contrary, variety of information and heterogeneity of investor behavior might hinder the ability of volume to transmit information to the market (Akpansung & Gidigbi, 2015). Hence, it is important to measure how trading volume and market returns are related.
Many theoretical models are developed to explain the relationship between trading volume and market returns (Copeland, 1976; Jensen, 1978; Daniel et al., 1998). The Efficient Market Hypothesis (EMH) proposed by Copeland (1976) assumes that trading volume has no informational content, and prices in the market reflect all available information. Other theories, such as Sequential Information Arrival Hypothesis (SIAH) and overconfidence hypothesis, contradict the EMH. According to these theories, prices do not reflect all available information, therefore, market returns vary. A large number of researchers have found evidence that does not support EMH (Remorov, 2014; Gupta et al., 2018; Kudryavtsev, 2019). Some papers reveal a bi-directional relationship between trading volume and market returns (Remorov, 2014; Miseman et al., 2019). Other papers disclose a unidirectional relationship between both variables (Kudryavtsev, 2017; Kudryavtsev, 2019). Some papers find no causal relationship between the two variables (Akpansung & Gidigbi, 2015).
This study continues the strand of literature that examines the dynamic relationship between trading volume and market returns. Defining the causality of the relationship between volume and returns, either unidirectional or bi-directional, is another goal assessed in this paper. Investors are attracted to invest in markets where information is quickly and correctly transmitted to prices. In such markets, assets seem to be fairly priced, and investors are encouraged to save and invest (Adhikari, 2020). Therefore, it is important to understand how return and volume are related, and whether the causality between them can stabilize the market and attract more investments.
The importance of this study results from its focus on two important market indicators, trading volume and market returns. The analysis of the relationship between trading volume and market returns should help investors and Saudi market officials to understand how information is transmitted in the Saudi market. Information could be conveyed from volume to prices, prices can relay information and affect volume, or neither of the two variables affect the other. Realizing how volume and returns are related should help: (1) investors to understand the dynamic relationship between the two variables and get a better forecast for stock returns and volatility. In this vein, investors should be able to take better investment decisions. (2) Saudi stock market officials can develop better rules and regulation that, in turn, can foster market stability and performance. The market is currently going through major improvements. There is a number of Saudi listed firms that are listed in leading indices, such as Morgan Stanley Capital International (MSCI) index. The market is also open for foreign investment to foster its stability and efficiency (www.cma.org.sa). Hence, understanding the forces behind the relationship between volume and returns is important for market officials to assess the best market enhancement decisions.
Employing daily volume and market return data from 2010 till mid-2021 reveals a unidirectional relationship from returns to volume. In the Saudi context, trading volume appears not to carry informational content. Market returns are driven by heterogeneity of investors’ behavior and the mixture of the information available. The results have important implications for the Saudi stock market due to the fact that volume and returns have a powerful impact on market stability and efficiency.
The rest of the paper is organized as follows. Section 2 reviews the related literature. Section 3 describes the Saudi stock market. Section 4 presents the data and definitions of the variables under study. Section 5 describes the methodology applied. Section 6 summarizes the results of the analysis. Section 7 concludes the study and presents its limitations and possibilities for future research.
2. Review of Literature
2.1 Theoretical Models
Scholars have developed many theoretical models to help explain the relationship between trading volume and market returns (Copeland, 1976; Jensen, 1978; DeLong et al., 1990). According to the Efficient Market Hypothesis (EMH) proposed by Jensen (1978), stock prices tend to reflect all available and relevant information in the market. Therefore, investors cannot predict a stock’s returns and generate profit from trading based on private information. Many other hypotheses and models challenge the EMH. The Sequential Information Arrival Hypothesis (SIAH) by Copeland (1976) assumes that a bi-directional relationship exists between trading volume and stock returns. As information reaches the market, investors do not receive it all at once; rather, they tend to receive it piecemeal. When the information moves from one group of investors to another, the price starts to react to this information based on the investor perception. The final price is reached after sequential price reaches equilibrium. Another model that contradicts the EMH is the noise trader model proposed by DeLong et al. (1990). Noise traders, who do not rely on dividends and fundamental data in their investment decisions, can outperform rational traders. Based on that, two assets with identical fundamentals can be traded at two different prices. This price differential can expand over time. The overconfidence hypothesis by Daniel et al. (1998) also contradicts the EMH. If investors are overconfident, they tend to overweigh their private information and underweigh public information. As a result, they trade more, and a price momentum occurs in the short run while price reversals happen in the long run. The asymmetric information model proposed by Kyle (1985) also challenges the EMH. Information is not symmetric among investors; some investors have better information than others. This information imperfection leads to an imbalance of powers among buyers and sellers and causes undesirable effects in the market. The difference of opinion model proposed by Varian (1985) presumes that value of assets is a function of an investor’s probability beliefs. Any increase in the spread of investors’ probability beliefs leads to a decrease in the value of assets.
2.2 The Relationship Between Trading Volume and Market Returns
A large number of empirical research are in support for the SIAH (Chuang et al., 2012; Gupta et al., 2018). These papers support bi-directional relationship between trading volume and returns. Gul and Javed (2009) found a strong positive relationship between various measures of trading volume and performance of the Karachi Stock Exchange index. The study by Remorov (2014) supports an inverse relationship between trading volume and stock prices. During market crashes, trading volume for major US stocks is inversely related with the square of stock price. The research by Miseman et al. (2019) found a predictive power of trading volume over stock returns. This requires a large change in trading volume before a modest change in stock returns can occur. The researchers also find a bi-directional causality between trading volume and stock returns in different market contexts, including Malaysia, Singapore and Indonesia. Lee and Rui (2000) show that trading volume can predict the volatility of stock returns and vice versa. Therefore, trading volume cannot predict returns directly; rather, it has an informational content through its impact on returns volatility. The study by Assan and Thomas (2013) reveals a bi-directional causality between trading volume and prices of three indices, the S&P CNX Nifty, Nifty Junior and Nifty Midcap. During pre-crisis and crisis period, volume Granger-causes prices and vice versa. This implies an informational content in both variables. Chuang et al. (2012) researched on ten Asian stock markets. Their findings disclose a bi-directional causal relationship between trading volume and stock returns in two markets, Taiwan and China. Also, the researchers unveil a causal relationship between volume and return volatility in six markets. Medeiros and Doornik (2008) found that trading volume Granger-causes the volatility of stock returns in the Brazilian market and vice versa. The study of Alsabban and Alarfaj (2019) supported the overconfidence bias in the Saudi stock market. Positive returns in the previous month encourages investors to trade more.
Stock price changes in any direction, either positive or negative, can predict upcoming trading activities through their informational content. A linear and non-linear Granger causality between trading volume and price was found by Chen (2008). The trading volume and the price of Shanghai A share has a bi-directional relationship. According to the findings of Gupta et al. (2018), the strength of bi-directional relationship between trading volume and returns of Chinese and Indian markets is affected by the investment-time horizon. In a short-time horizon, the lagged trading volume can predict market returns in the Chinese market but not in the Indian market. The findings contradict the EMH and support the speculative trading phenomenon. However, in a long-time horizon, lagged returns for both markets can predict trading volume.
While other papers provide support for the unidirectional relationship between trading volume and returns (Pathirawasam, 2011; Samman & Al-Jafari, 2015), Adhikari (2020) reveals the existence of a unidirectional causality between trading volume and stock returns in the Nepalese market. Trading volume Granger-causes stock returns in the commercial banks sector. However, stock returns tend to Granger-cause trading volume in the finance, hydropower and insurance sectors. Mpofu (2012) found a unidirectional causal relationship running from the market returns to trading volume. The impact of South African’s JSE stock index returns on trading volume is much stronger than the impact of volume on returns. Kudryavtsev (2019) disclosed that price drifts tend to occur after large decreases or increases in stock prices associated with low abnormal trading volume. However, large increases or decreases in prices, accompanied with high abnormal trading volume, lead to price reversals. Samman and Al-Jafari (2015) found a positive and significant impact of trading volume on stock returns. The trading volume of industrial firms listed on Muscat’s securities exchange Granger-causes its returns. Kudryavtsev (2017) unveiled the impact of price reversal of companies listed in the S&P 500 Index on trading volume. When a stock’s return reverses the sign after a sequence of previous returns with the opposite sign, this leads to a large increase in the stock’s trading volume. The study by Gallant et al. (1992) revealed a positive and significant impact of the S&P 500 trading volume on its price volatility. Trading days with high volume are accompanied by high price volatility. Similarly, Naka and Oral (2013) disclosed that Dow Jones Industrial Average returns’ volatility increases with trading volume. Since volume is considered as a proxy for unobservable information, this indicates that volatility increases with informational flow.
In the study by Pathirawasam (2011), a positive contemporaneous relationship was revealed between trading volume and portfolio returns. High volume portfolios outperform low volume portfolios. However, trading volume of the previous period is inversely related to the current portfolio returns. Therefore, high volume portfolios underperform low volume portfolios, which might result from illiquidity of low-volume stocks or misspecification of the investor regarding future earnings. Kamath (2008) found a causal relationship from the returns of the Santiago Stock Exchange index to its trading volume. Sabri (2008) showed a significant integration between trading volume and prices of eight Arab markets, including Saudi Arabia. A long-term causal relationship from price to trading volume was revealed by Chen (2008) for Shanghai B share, Shenzhen A share and Shenzhen B share.
Huddart et al. (2012) analyzed the impact of price on trading volume of stocks listed in leading indices, including NYSE and NASDAQ. When the stock price increases above its 52-week high or decreases below its 52-week low, the trading volume tends to increase. The longer the duration since the last extreme price occurred, the greater the increase in volume. Glaser and Weber (2009) disclosed that investors’ confidence increases with higher past portfolio returns, which leads to an increase in trading volume. Similarly, as market return increases, investors underestimate market volatility and tend to increase trading volume. In the study by Llorente et al. (2000), the impact of trading volume on returns of stocks listed in the NYSE and AMEX is shown to be affected by degrees of trade informativeness. In high volume trading days, stock returns tend to exhibit the same sign if the degree of informed trading is high. However, stock returns reverse in sign with a low degree of informed trading.
Other papers did not find a causal relationship between trading volume and returns (Medeiros & Doornik, 2008; Akpansung & Gidigbi, 2015). Bascl et al. (1996) revealed that stock prices cannot completely predict trading volume of the Turkish stock exchange, but this does not provide support for the EMH. The low informativeness of stock prices might result from the heterogeneous opinions among investors. Akpansung and Gidigbi (2015) found a long-term relationship between changes in the trading volume of Nigerian stocks and their returns but could not determine the direction of this relationship. Lee and Rui (2000) found that trading volume does not Granger-cause a stock’s returns in the Shanghai Stock Exchange. The findings imply no predictive power of the trading volume over future returns though there is a positive correlation between both. Similarly, Gallant et al. (1992) found that daily changes in the S&P 500 returns are not related to the trading volume. Whether the volume is heavy or low, the price of the index might rise or fall regardless of its trading activity. Medeiros and Doornik (2008) could not find a causal relationship between trading volume and Brazilian stock returns. The recent trading volume data cannot forecast the current or future stock returns in the short term, and the other way around.
The Saudi stock market is undergoing major restructuring. It has been promoted to an emerging market as of 2019 (www.cma.org.sa). Large Saudi companies are joining leading indices including MSCI and FTSE, and the market is open for foreign investments. The goal of these transformations is to attract more qualified investors to invest. This requires improving the market rules and regulations to promote its efficiency, stability and transparency. As a result, important market indicators such as trading volume and market returns should become more informative and predict one another. Therefore, a causal relationship, either unidirectional or bi-directional, is expected to occur between trading volume and market returns.
3. The Saudi Stock Market
Tadawul, the Saudi stock market, is the largest in the MENA region, with a market capitalization equal to 3 trillion as of 31st of December, 2021 (www.Tadawul.com.sa). Tadawul All Share Index (TASI) is a free float index, and it is the main index in the market with a total of 203 traded companies. There are other two indices, the NOMU Parallel Market Capped index, with a capping threshold of 20%, and the MSCI Tadawul 30 Index, with a capping threshold of 15%.
Major restructuring decisions took place in the Saudi stock market in previous years. The Capital Market Authority (CMA), the sole regulator of the Saudi market, opened the market of foreign qualified investors to invest as of June, 2015 (www.Tadawul.com.sa). The market was promoted to an emerging one as of 2019. The goal of CMA officials is to develop the investment environment, reduce its volatility, improve efficiency through better disclosure, and integrate with advanced global markets (www.CMA.org.sa).
4. Data
To analyze the relationship between Saudi stock market returns and its trading volume, data is extracted from the Saudi stock exchange website (www.saudiexchange.sa). Tadawul All Share Index (TASI) is the main index in the Saudi stock market and it is an all-share index based on the free float methodology. Market returns are measured as the difference between current TASI value minus its previous value, divided by its previous value. Trading volume is measured as the log value of the number of shares traded in the market (Samman & Al-Jafari 2015).
Figure 1
The Value of Saudi Market Main Index, TASI, from 2000 till mid-2021.
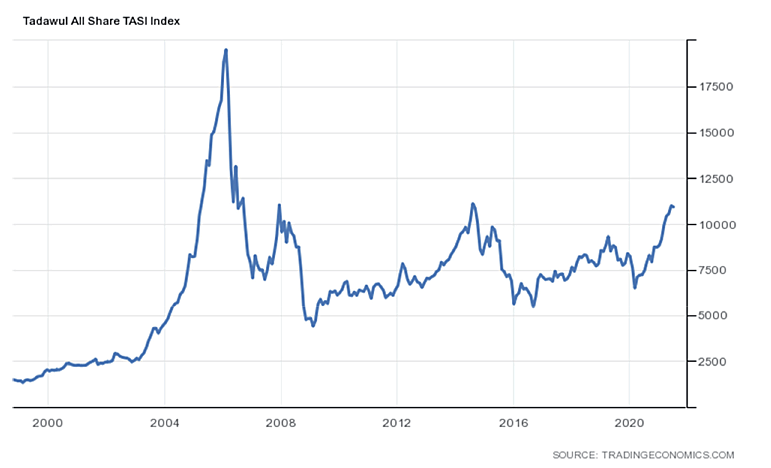
The variables under study are measured on a daily basis starting from the 2nd of January, 2010 till the 6th of June, 2021, with a total number of observations equal to 2857. This period is chosen to assure the stability of the market after the high volatility occurred as a result of the financial crisis of 2007–2008. TASI value reached its highest level of around 20,000 points at the beginning of 2006 as an early sign for the crisis. After that, the market faced high fluctuations in the value of TASI as presented in Figure 1. The value of TASI at the beginning of 2010 was around 5600 points, which was closest to the levels before the early signs of the crisis started to appear. As Figure 1 shows, the market faced some fluctuations after the year 2010 but none of these is considered a major event that affected the market sharply as the financial crisis did, including the COVID-2019 crisis. Therefore, it is important to measure the relationship between market returns and trading volume that is free from the impact of any major events.
5. Methodology
To test the causality between market returns and trading volume, the stationarity of the time series of variables under study should be tested. The Augmented Dickey-Fuller (ADF) unit root test is applied to check the stationarity of trading volume and market returns through the following regression model (Samman & Al-Jafari, 2015):
∆yt = α + βt + γyt−1 +∑δi∆yt−i + εt (1)
where y is either the stock return or the trading volume, α, β, γ and δ are model parameters, and εt is a white noise error term. The ADF test detects the occurrence of a serial correlation in the error term. This is done by adding lag variables for the dependent variable. If δ = 0, the null hypothesis indicates that the data series is not stationery and unit-root exist. The Phillips-Perron (PP) test is another unit-root model that measures the stationarity of trading volume and market returns. It differs from the ADF test in not adding lagged difference terms as defined in the following equation (Samman & Al-Jafari, 2015):
∆yt = α + βt + γyt−1 + εt (2)
where, yt is either the market return or the volume, α, β and γ are model parameters, and εt is a white noise error term. The same null hypothesis of ADF test applies in the PP test, where γ = 0 indicates that the data series is non-stationary.
If the variables are stationary, the Vector Autoregression model (VAR) and the Granger causality test are used to define the direction of relationship between trading volume and market returns. This requires defining the number of lags for both variables through a set of criteria including the Akaike information criterion (AIC) and the Hannan–Quinn information criterion (HQIC).
The following bivariate VAR model is applied using OLS method to measure the direction of relationship between market returns and trading volume (Akpansung & Gidigbi, 2015):
Rt = µR +∑αiRt−i +∑βiVt−i + εt (3)
Vt = θV +∑λiVt−i +∑δiRt−i + εt (4)
where Rt and Vt represent market returns and trading volume, respectively. The parameters αi and βI in model (3) represent the impact of previous returns and previous volume, respectively, on current returns. If βI ≠ 0, then we can assume that volume causes returns. If both parameters are statistically significant, it is concluded that past trading volume together with previous returns can provide better estimation for the current returns. The same applies to model (4), which defines the impact of the previous volume and returns on the current volume.
The analysis is extended to determine the direction of the relationship between the two variables. The Granger causality test, developed by Granger (1969), is carried out to define whether return causes volume, volume causes return, or either variable causes the other. A number of diagnostic tests are applied to assure that error terms are free from heteroscedasticity and serial correlation. The Breusch-Pagan test is applied to check for the presence of heteroscedasticity, and the Breusch-Godfrey test to check for serial correlation. The Zivot-Andrew (1992) test analyzes whether the time series data under study have any structural breaks.
The Impulse Response Function (IRF) test is crucial in empirical causal analysis. It traces the response of present and future values of the dependent variable, in the VAR system, to shocks in error terms. Therefore, the findings of the IRF test should provide support for VAR and Granger causality test results.
6. Results
The results of the unit root test in Tables 1 and 2 reveal that both variables, market returns and trading volume, are stationary. The test statistic values in the Dickey-Fuller and the Phillips-Perron tests are above the critical values at 1%, 5% and 10% level.
Table 1
Augmented Dickey-Fuller Unit Root Test
|
|
|
|
Test Critical Value |
||
|
Variable |
t-statistic |
Probability* |
1% |
5% |
10% |
|
Return |
-50.914 |
0.00 |
-3.430 |
-2.860 |
-2.570 |
|
Volume |
-14.323 |
0.00 |
-3.430 |
-2.860 |
-2.570 |
Note. * denotes significance at the 1% level.
Table 2
Phillips-Peron Unit Root Test
|
|
|
|
Test Critical Value |
||
|
Variable |
t-statistic |
Probability* |
1% |
5% |
10% |
|
Return |
-2117.407 |
0.00 |
-20.700 |
-14.100 |
-11.300 |
|
Volume |
-322.345 |
0.00 |
-20.700 |
-14.100 |
-11.300 |
Note. * Denotes significance at the 1% level.
The stationarity of variables under study allows applying the VAR model, but this requires a pre-estimation of the number of lags. The results of AIC and HQIC in Table 3 show that the optimal number of lags is four.
Table 3
AIC and HQIC Selection-order Criteria
|
Lag |
LL |
LR |
df |
P |
FPE |
AIC |
HQIC |
SBIC |
|
0 |
1978.36 |
|
|
|
2.8e-06 |
-7.1092 |
-7.10313 |
-7.09336 |
|
1 |
2384.64 |
812.57 |
4 |
0.00 |
6.6e-07 |
-8.55627 |
-8.53806 |
-8.50964 |
|
2 |
2403.06 |
36.83 |
4 |
0.00 |
6.3e-07 |
-8.60812 |
-8.57777 |
-8.53041 |
|
3 |
2421.21 |
36.305 |
4 |
0.00 |
5.9e-07 |
-8.65903 |
-8.61654 |
-8.5502* |
|
4 |
2431.71 |
20.991* |
4 |
0.00 |
5.8e-07* |
-8.6824* |
-8.6277* |
-8.54252 |
Note. * denotes significance at the 1% level.
The results of the VAR model in Table 4 reveal that the current Saudi stock market returns are positively and significantly affected by one period lag of returns at 5% level. However, the impact of lag (2) and lag (3) is significantly negative at a 5% level. The impact of lag (4) on the current market returns is insignificant. The differential of the impact of previous returns on the current could be the result of mixed information arriving to the market. This mix of information might mislead investors and prevent them from capturing the right information, which leads to a long-term price insufficiency, as proposed by Jennings et al. (1981).
The impact of the previous trading volume on the current market returns is not significant. Trading volume is found by many researchers to have an informational content that can predict future prices (Lee & Rui, 2000; Assan & Thomas, 2013). The insignificant impact of trading volume over market returns supports the differential of information among investors. Investors with different preferences tend to have a variety of information. Therefore, trading volume loses its informational content and cannot predict prices. Besides, the difficulty to predict returns through new observations about volume can be the cause for the insignificant results (Lee & Rui, 2000).
Current trading volume in the Saudi stock market is positively and significantly affected by its four previous lags at the 5% level for lag 1, 2 and 4 and at 10% level for lag 3. The results support the overconfidence hypothesis. Investors who have private information, which they are overconfident about, tend to outweigh it over public information. This leads to a continuous increase in the trading volume in the short run. This finding is reinforced by the findings of Alsabban and Alarfaj (2019) in the Saudi context and other research papers that support the overconfidence hypothesis (Griffin et al., 2007; Glaser & Weber, 2007; Liu et al., 2016). The impact of previous market returns on the current trading volume is positive and significant at the 5% level for the first lag, and significantly negative at the 10% level for the second lag. The impact of lag (3) and lag (4) on the volume is insignificant. This mix of results, as demonstrated by previous literature, could be the result of heterogeneous investors’ behavior (Barron et al., 2005; Kudryavtsev, 2019). Investors can have diverse private information; therefore, they tend to react accordingly and force market returns and volume to be unstable.
Vector Autoregression model (VAR) defines the direction of the relationship between trading volume and market return (see Table 4).
Table 4
Vector Autoregression Model Test
|
|
|
Std. Err. |
z |
P>z |
[95% |
|
|
|
Coef. |
|
|
|
Conf. Interval] |
|
|
Return |
|
|
|
|
|
|
|
Return |
|
|
|
|
|
|
|
L1. |
0.188941 |
0.039201 |
4.82 |
0 |
0.112107 |
0.265774 |
|
L2. |
-0.08012 |
0.036727 |
-2.18 |
0.029 |
-0.1521 |
-0.00813 |
|
L3. |
-0.09978 |
0.040657 |
-2.45 |
0.014 |
-0.17946 |
-0.02009 |
|
L4. |
-0.00081 |
0.027665 |
-0.03 |
0.977 |
-0.05504 |
0.05341 |
|
|
|
|
|
|
|
|
|
LOGVOLUME |
|
|
|
|
|
|
|
L1. |
0.005742 |
0.004454 |
1.29 |
0.197 |
-0.00299 |
0.014472 |
|
L2. |
0.004719 |
0.004719 |
1 |
0.317 |
-0.00453 |
0.013969 |
|
L3. |
-0.00925 |
0.005332 |
-1.73 |
0.083 |
-0.0197 |
0.001206 |
|
L4. |
0.001437 |
0.004215 |
0.34 |
0.733 |
-0.00682 |
0.009698 |
|
|
|
|
|
|
|
|
|
_cons |
-0.02078 |
0.017451 |
-1.19 |
0.234 |
-0.05498 |
0.013428 |
|
|
|
|
|
|
|
|
|
LOGVOLUME |
|
|
|
|
|
|
|
Return |
|
|
|
|
|
|
|
L1. |
1.14849 |
0.36566 |
3.14 |
0.002 |
0.43181 |
1.86517 |
|
L2. |
-0.56916 |
0.342582 |
-1.66 |
0.097 |
-1.24061 |
0.102285 |
|
L3. |
-0.44637 |
0.379239 |
-1.18 |
0.239 |
-1.18966 |
0.296926 |
|
L4. |
-0.19436 |
0.258051 |
-0.75 |
0.451 |
-0.70013 |
0.31141 |
|
|
|
|
|
|
|
|
|
LOGVOLUME |
|
|
|
|
|
|
|
L1. |
0.513244 |
0.041544 |
12.35 |
0 |
0.431818 |
0.594669 |
|
L2. |
0.098158 |
0.044021 |
2.23 |
0.026 |
0.011878 |
0.184438 |
|
L3. |
0.086291 |
0.049738 |
1.73 |
0.083 |
-0.01119 |
0.183777 |
|
L4. |
0.179598 |
0.039317 |
4.57 |
0 |
0.102539 |
0.256658 |
|
|
|
|
|
|
|
|
|
_cons |
1.020379 |
0.162782 |
6.27 |
0 |
0.701332 |
1.339426 |
The Granger causality Wald test results (Table 5) support unidirectional causality between trading volume and Saudi stock market returns. Trading volume does not Granger-cause market returns, which is in line with the findings of Sabri (2008), Mpofu (2012) and Kudryavtsev (2017). On the contrary, market returns do Granger-cause trading volume, which is consistent with the findings of Huddart et al. (2012) and Adhikari (2020). The findings support the insignificant impact previous volume has on the current market returns and the significant impact previous returns have on the current volume, as is revealed by the VAR test.
Table 5
Granger Causality Wald Test
|
Equation |
Excluded |
chi2 |
df |
Prob > chi2 |
|
Return |
Volume |
6.4825 |
4 |
0.166 |
|
Volume |
Return |
13.044 |
4 |
0.011* |
Note. * denotes significance at the 1% level.
The results of both the VAR test and the Granger causality test support the heterogeneity of investors’ behavior in the Saudi stock market and a variety of information arriving there. The Saudi stock market is dominated by national investors, individuals and institutions. At the end of 2020, their total ownership was around 84% of the total market ownership. Individual investors’ ownership stake is around 40% of total market ownership (www.saudiexchange.sa). Individual investors could differ in many aspects including the information available to them, their preference for risk and their understanding of the market news. This kind of heterogeneity among individual investors, together with information differentials, could be the driver for the results obtained in this research, especially if we consider the high ownership stake of individuals in the Saudi stock market that can determine the direction of its trading volume and returns.
Table 6
Breusch-Pagan-Godfrey Heteroskedasticity Test
|
F-statistic |
0.0000 |
Prob. F(1,2854) |
1.0000 |
|
R-squared |
0.0000 |
Adj R-squared |
-0.0004 |
The results of the Breusch-Pagan test in Table 6 reveal that there is no heteroskedasticity problem. The p-value of the F-statistic is above 0.01, therefore, there is no predictability in the error variance. The R-squared value of the Breusch-Godfrey test in Table 7 is around zero. The results rule out the presence of serial correlation in the error terms.
Table 7
Breusch-Godfrey Serial Correlation LM Test
|
F-statistic |
1.66 |
Prob. F(3,1687) |
0.1738 |
|
R-squared |
0.0029 |
Adj R-squared |
0.0012 |
Major events took place during the period under study. The upgrade of the Saudi stock market to an emerging one and the addition of Tadawul-listed shares in the MSCI and FTSE emerging market indices in 2019 made it an attractive destination for investors, both local and foreign ones. Foreign Institutional investments increased from USD 5,172.20 million as of March 7, 2015 to USD 60,601.00 million as of November 30, 2021. The economic downturn caused by COVID-19 crisis is another major event that had a huge effect on global markets, including the Saudi one. Hence, it is required to check if a structural break occurs in market returns time series data and trading volume time series data. The results of the Zivot-Andrew (1992) test are presented in Table 8. The null hypothesis is rejected at a 95% confidence level since the absolute value is greater than the critical value (1.96).The null hypothesis is rejected at a 99% confidence level since the absolute value is greater than the critical value (2.576). The results reveal the absence of structural break in both time series data on intercept, trend and both.
Table 8
Zivot-Andrews Unit Root Test
|
|
Null Hypothesis: Return has a unit root with a structural break in the intercept. |
Null Hypothesis: Volume has a unit root with a structural break in the intercept. |
Null Hypothesis: Return has a unit root with a structural break in the trend. |
Null Hypothesis: Volume has a unit root with a structural break in the trend. |
Null Hypothesis: Return has a unit root with a structural break in both the intercept and trend. |
Null hypothesis: Volume has a unit root with a structural break in both the intercept and trend. |
|
Zivot-Andrews test statistic |
-21.9080 |
-7.9035 |
-21.7960 |
-7.7429 |
-21.9041 |
-8.4384 |
|
1% critical value: |
-5.3400 |
-5.3400 |
-4.8000 |
-4.8000 |
-5.5700 |
-5.5700 |
|
5% critical value: |
-4.9300 |
-4.9300 |
-4.4200 |
-4.4200 |
-5.0800 |
-5.0800 |
|
10% critical value: |
-4.5800 |
-4.5800 |
-4.1100 |
-4.1100 |
-4.8200 |
-4.8200 |
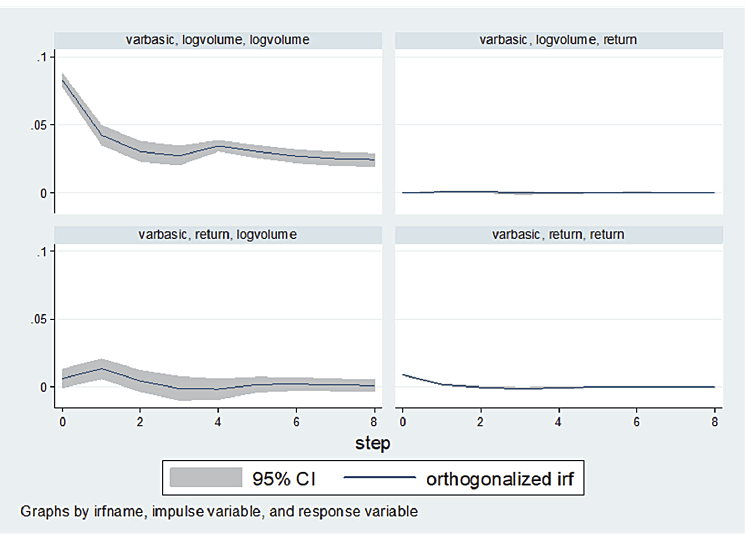
Figure 2 represents the impulse response function (IRF) to define the direction of relationship between trading volume and market return. The results of the IRF test support the findings of the VAR and the Granger causality tests. Market returns do not respond to changes in the trading volume. Similar results are obtained in the response of market return to its own values in the long term. In the short term, the return is negatively affected by its own shocks. The results are mixed in the response of volume to its own values and in the response of volume to returns.
Figure 2
Impulse Response Function (IFR)
The findings of this research do not provide support for the Sequential Information Arrival Hypothesis (SIAH). Investors in the Saudi stock market do not receive information in a sequence and then react accordingly. Therefore, trading volume and prices are not affected by changes in the demand curve due to new information arriving in the market. The asymmetric information model and the difference of opinion model can provide an explanation for the obtained results. The Saudi stock market is dominated by individual investors who tend to act differently because of their heterogeneity and the variety of information they have. Therefore, trading volume does not seem to carry informational content and does not predict market prices. On the contrary, market returns do influence volume, but the impact is unstable.
7. Conclusion
This research investigated the relationship between trading volume and market returns in the Saudi context. It covered daily data of a number of shares traded and TASI returns from 2010 till mid-2021. The VAR test reveals that current market returns are not affected by previous trading volume. The impact of previous returns on trading volume is mixed. A unidirectional relationship running from return to volume is proved by applying the Granger causality test. The results are in accordance with the findings of Adhikari (2020) and Kudryavtsev (2019). The IRF test results support the findings of the VAR test and the Granger causality test. The findings of the present paper do not support the Sequential Information Arrival Hypothesis (SIAH) proposed by Copeland (1976). The asymmetric information model and the difference of opinion model can provide an explanation for the attained results. Trading volume in the Saudi stock market seems not to carry informational content and does not convey information to prices. Conversely, returns do affect the trading volume but the impact could be positive, negative or insignificant. This results from the varied information that arrives in the market simultaneously, therefore investors are not able to capture the true essence of the information as proposed by Jennings et al. (1981).
An important implication can be driven from this research for market regulators and investors in the Saudi stock market. They should pay more attention to returns and their impact on the trading volume. Returns do impact volume, although the impact could be positive, negative or insignificant, but volume has no informational content and does not affect returns. Understanding how prices relay information and affect the volume is important to develop required policies and regulations that can foster market efficiency and stability. Investors will also be able to take right investment decisions.
This paper can be extended by defining how different economic and political aspects can affect the relationship between volume and returns. Also, considering the impact of specific events, such as COVID-19, can improve the findings and enrich the literature. Further research can also be conducted on individual stocks rather than on the whole market. This should provide a better understanding regarding the relationship under study.
References
Adhikari, P. (2020). The dynamic relationship between stock returns and trading volumes in Nepalese stock market. Management Dynamics, 23(2), 161–172.
Akpansung, A., & Gidigbi, M. (2015). The Relationship between Trading Volumes and Returns in the Nigerian Stock Market. International Research Journal of Finance and Economics, 132, 150–163.
Alsabban, S., & Alarfaj, O. (2019). An Empirical Analysis of Behavioral Finance in the Saudi Stock Market: Evidence of Overconfidence Behavior. International Journal of Economics and Financial Issues, 10(1), 73–86.
Assan, A., & Thomas, S. (2013). Stock Returns and Trading Volume: Does the Size Matter? Investment Management and Financial Innovations, 10(3), 76–88.
Barron, O. E., Harris, D. G., & Stanford, M. (2005). Evidence That Investors Trade on Private Event Period Information around Earnings Announcements. The Accounting Review, 80(2), 403–421.
Bascl, E., Ozydchnm, S., & Aydogan, K. (1996). A note on price-volume dynamics in an emerging stock market. Journal of Banking & Finance, 20, 389–400.
Chen, Shyh-Wei. (2008). Untangling the Nexus of Stock Price and Trading Volume: Evidence from the Chinese Stock Market. Economics Bulletin, 7(15), 1–16.
Chuang, W., Liu, H., & Susmel, R. (2012). The bivariate GARCH approach to investigating the relation between stock returns, trading volume, and return volatility. Global Finance Journal, 23, 1–15.
Copeland, T. (1976). A Model of Asset Trading under the Assumption of Sequential Information Arrival. The Journal of Finance, 31, 135–155.
Daniel, K., Hirshleifer, D., & Subrahmanyam, A. (1998). Investor Psychology and Security Market Under- and Overreactions. Journal of Finance, 53, 1839–1886.
De Long, J. B., Shleifer, A., Summers, L., & Waldmann, R. J. (1990). Positive Feedback Investment Strategies and Destabilizing Speculation. Journal of Finance, 45, 379–395.
Gallant, A., Rossi, P., & Tauchen, G. (1992). Stock Prices and Volume. The Review of Financial Studies, 5(2), 199–242.
Glaser, M., & Weber, M. (2007). Overconfidence and Trading Volume. Geneva Risk and Insurance Review, 32(1), 1–36. SSRN: https://ssrn.com/abstract=976374.
Glaser, M., & Weber, M. (2009) Which Past Returns Affect Trading Volume?. Journal of Financial Markets, 12, 1–31. SSRN: https://ssrn.com/abstract=686802.
Granger, C., W., J. (1969). Investigating Causal Relations by Econometric Models and Cross-spectral Methods. Econometrica, 37(3), 424–438.
Griffin, J. M., Nardari, F., & Stulz, R. M. (2007). Do Investors Trade More when Stocks Have Performed Well? Evidence from 46 Countries. The Review of Financial Studies, 20, 905–951. doi:10.1093/rfs/hhl019.
Gul, F., & Javed, T. (2009). Relationship Between Trading Volume and Stock Exchange Performance: A Case from Karachi Stock Exchange. International Business & Economics Research Journal, 8(8). doi: https://doi.org/10.19030/iber.v8i8.3155.
Gupta, S., Das, D., Hasim, H., & Tiwari, A. (2018). The Dynamic Relationship Between Stock Returns and Trading Volume Revisited: A MODWT-VAR Approach. Finance Research Letters, 27, 91-98. doi: 10.1016/j.frl.2018.02.018
Harris, M., & Raviv, A. (1991). Differences of Opinion Make a Horse Race. Review of Financial Studies, 6(3), 473–506.
Huddart, S., Lang, M., & Yetman, M. (2012). Volume and Price Patterns Around a Stock’s 52-Week Highs and Lows: Theory and Evidence. Management Science, 55(1), 16–31.
Jennings, R., Starks, L., & Fellingham, J. (1981). An Equilibrium Model of Asset Trading with Sequential Information Arrival. The Journal of Finance, 36(1), 143–161. https://doi.org/10.1111/j.1540-6261.1981.tb03540.x.
Jensen, M. C. (1978). Some Anomalous Evidence Regarding Market Efficiency. Journal of Financial Economics, 6, 95–101.
Kamath, R. (2008). The Price-Volume Relationship in The Chilean Stock Market. International Business and Economics Research Journal, 7(10), 1–13.
Kudryavtsev, A. (2017). The Effect of Stock Return Sequences on Trading Volumes. International Journal of Financial Studies, 5(4), 20. doi:10.3390/ijfs5040020
Kudryavtsev, A. (2019). The Effect of Trading Volumes on Stock Returns Following Large Price Moves. Economic Annals, 64(220), 85–116.
Kyle, A., S. (1985). Continuous Auctions and Insider Trading. Econometrica, 53, 1315–1336.
Lee, C., & Rui, O. (2000). Does Trading Volume Contain Information to Predict Stock Returns? Evidence from China’s Stock Markets. Review of Quantitative Finance and Accounting, 14, 341–360.
Liu, H. H., Chuang, W. I., Huang, J. J., & Chen, Y. H. (2016). The overconfident trading behavior of individual versus institutional investors. International Review Economics and Finance, 45, 518–539. doi:10.1016/j.iref.2016.07.016.
Llorente, G., Michaely, R., Saar, G., & Wang, J. (2000). Dynamic Volume-Return Relation of Individual Stocks. NYU Working Paper No. FIN-00-032. SSRN: https://ssrn.com/abstract=1295236.
Mahajan, S., & Singh, B. (2009). The Empirical Investigation of Relationship between Return, Volume and Volatility Dynamics in Indian Stock Market. Eurasian Journal of Business and Economics, 2(4), 113–137.
Medeiros, O., & Doornik, B. (2008). The Empirical Relationship between Stock Returns, Return Volatility and Trading Volume in the Brazilian Stock Market. Brazilian Business Review, 5(1), 01–17. DOI: http://dx.doi.org/10.15728/bbr.2008.5.1.1
Miseman, M., Yahya, M., Mustafa, H., & Lee, Y. (2019). The Dynamic Relationship Between Trading Volume, Stock Return, and Volatility-Domestic and Cross-Country: South Asian Markets. Finance, Accounting and Business Analysis, 1(1), 1–21.
Mpofu, R. (2012). The Relationship Between Trading Volume and Stock Returns in the JSE Securities Exchange In South Africa. Corporate Ownership and Control, 9(4), 199–207. https://doi.org/10.22495/cocv9i4c2art1
Naka, A., & Oral, E. (2013). Stock Return Volatility and Trading Volume Relationships Captured with Stable Paretian GARCH and Threshold GARCH Models. Journal of Business and Economics Research, 11(1), 47–53.
Pathirawasam, C. (2011). The Relationship Between Trading Volume and Stock Returns. Journal of Competitiveness, 3, 41–49.
Remorov, R. (2014). Stock Price and Trading Volume during Market Crashes. International Journal of Marketing Studies, 6(1), 21–30.
Sabri, N. (2008). The impact of trading volume on stock price volatility in the Arab economy. Journal of Derivatives and Hedge Funds, 14, 285–298. doi:10.1057/jdhf.2008.22
Samman, H., & Al-Jafari, M. (2015). Trading Volume and Stock Returns Volatility: Evidence from Industrial Firms of Oman. Asian Social Science, 11(24), 134–146.
Varian, H. (1985). Divergence of Opinion in Complete Markets: A Note. Journal of Finance, 40(1), 309–317.