Organizations and Markets in Emerging Economies ISSN 2029-4581 eISSN 2345-0037
2022, vol. 13, no. 1(25), pp. 209–237 DOI: https://doi.org/10.15388/omee.2022.13.77
Smart Beta Investing: An Alternative Investment Paradigm in Emerging Indian Equity Market
Reema Monga
University School of Management and Entrepreneurship
Delhi Technological University, India
https://orcid.org/0000-0001-9619-0205
reemamonga23@gmail.com
Deepti Aggrawal (corresponding author)
University School of Management and Entrepreneurship
Delhi Technological University, India
https://orcid.org/0000-0003-1899-1570
deeptiaggrawal@dtu.ac.in
Jagvinder Singh
University School of Management and Entrepreneurship
Delhi Technological University, India
https://orcid.org/ 0000-0002-4558-5220
jagvinder.singh@dtu.ac.in
Abstract. This paper fundamentally looks at the novel concept of Smart Beta investing in constructing a more efficient and well-diversified alternative investment. Smart beta has been a popular investment philosophy, although emerging countries have been slower to adopt and execute it.
In this way, the study investigates the existence, performance, and robustness of smart beta strategies in a divergent financial market. Moreover, it is an initial attempt to integrate the framework of stock selection and stock weighting to construct and test smart beta strategies against the traditional Indian market benchmark (S&P BSE 500). The findings show that smart beta investing results in a better risk-return profile on an absolute and risk-adjusted basis. Furthermore, the results demonstrate the consistency and robustness of smart beta strategies in different market conditions and display their outperformance even in bearish market conditions.
Keywords: active and passive investment, factor exposure, idiosyncratic risk, Indian equity market, innovative investment, risk parity, smart beta investing
Received: 9/9/2021. Accepted: 10/1/2022
Copyright © 2022 Reema Monga, Deepti Aggrawal, Jagvinder Singh. Published by Vilnius University Press. This is an Open Access article distributed under the terms of the Creative Commons Attribution Licence, which permits unrestricted use, distribution, and reproduction in any medium, provided the original author and source are credited.
1. Introduction
Since the introduction of the Capital Asset Pricing Model (CAPM) in 1960, the investment community has depended on the traditional capitalization-weighted indices or CAPM for asset allocations models. Based on the seminal work of Markowitz (1952), investors are just required to hold a ‘cap-weighted market portfolio,’ which is considered a mean-variance optimal. It has been presumed that investment in a market portfolio could be the optimum solution to generate a risk premium. However, in the subsequent years, numerous researchers (Basu, 1977; Fama & French, 1993, 1996; Jegadeesh & Titman, 1993; Zhang, 2005; Hou et al., 2015) found alternative risk factor-exposures that yielded surplus returns. Empirical analysis has additionally examined that portfolios having alternative risk factors can create superior returns compared with the traditional market portfolios, indicating that these market indices are not mean-variance efficient. As a result, it is imperative to construct well-diversified and mean-variance optimal portfolios apart from the conventional market portfolio.
An intensifying community of professional investors observed that the criticisms of traditional indices tend to center on areas such as concentration, high degree of volatility, absence of mean-reversion, and others (Russo, 2014). At the individual stock level, concentration refers to a couple of organizations having a large index weight, exposing asset holders to stock-specific risk. It is also evident from numerous nations that only a few names accounted for a significant portion of the market index, i. e., the highly concentrated index (Malevergne et al., 2009; Russo, 2014). Another potential flaw of the cap-weighted market index is that it imposes a return drag on portfolios, making it sub-optimal compared to the non-cap-weighted indices (Treynor, 2005; Hsu, 2006; Arnott & Hsu, 2008). Empirical evidence also proposes that cap-weighted market indices are neither diversified nor proficient, resulting in poor-risk adjusted returns (Ferson et al., 1987; Haugen & Baker, 1991; Grinold, 1992; Centineo & Centineo, 2017).
In light of the fluctuations in the traditional index and the impact of inefficient stock markets, investors have started looking for transparent and rule-based indices that apply non-market-cap weighting schemes. These alternative weighted portfolios are termed by the expressions “advanced beta,” “smart beta,” “alternative beta,” “factor investing,” and “alternative risk premium” and more (Kudoh et al., 2015; Blitz, 2016). The objective of these strategies is to alleviate the inherent frailty of traditional market indices, i. e., “overweighting overpriced stocks and underweighting underpriced stocks.” In other words, this relatively new approach to equity investing is prompted to address these shortcomings (heavy concentration and unfavorable factor exposures) of conventional market indices. Thus, smart beta indices aim to gain advantages from rewarded risk premia factors while diversifying unrewarded risks by using broadened weighting schemes.
This paper contributes to the growing literature by unveiling the existence and effective execution of smart beta strategies in an emerging financial market. The Indian stock market is the world’s sixth-largest stock market, with a market capitalization of USD 3.46 trillion (Bloomberg, 2021). It is an attractive emerging market for FIIs and other global portfolio investors because of its size, foreign interest, growth potential, market capitalization, and stable macroeconomic climate. During 2019, the foreign portfolio investors (FPIs) owned around 29% of the Indian equities. Interestingly, among emerging markets, FII inflows into the Indian stock market were the highest for the year 2020. India remains a popular investment destination with substantial foreign portfolio investment, considering the high growth rates and opportunities. For instance, in 2020–2021, the total net investment of these FPIs reached a new height of approximately USD 555 billion. Also, it is the world’s third-largest economy, with a PPP-adjusted GDP of USD 10.21 trillion (World Bank, 2021). Therefore, it is worthwhile to devise innovative indexing strategies in the context of the emerging Indian equity market. Considering the sample of the S&P BSE 500 index from July 1, 2003 to June 30, 2020, we construct smart beta strategies by implementing six well-documented factor exposures (such as value, size, investment, momentum, profitability, and low volatility) across three diverse weighting schemes (Risk parity, Factor Weighting, and Equal Weighting).
In line with the idea, the following research questions are proposed to be addressed in this study. First, will factor-based smart beta strategies outperform the traditional cap-weighted market index in the context of an emerging economy? Second, does the application of a specific weighting approach enhance portfolio diversification? Furthermore, the study offers criteria of stock selection with related attributes. It also deals with different portfolio weighting schemes that ought to assess the robustness and add diversification benefits across the selected stocks. Then, it offers a design of a sound integrated approach for the proper execution of the optimal smart beta investment. Finally, the study provides a more comprehensive performance analysis, including factor risk decomposition and performance sensitivity to different market conditions.
The rest of the article is organized into seven sections: Section 2 delves into the relevant literature. Section 3 outlines the research framework for the factor exposures across different portfolio weighting schemes. In Section 4, we provide details of the data used. Section 5 exhibits comparisons based on empirical outcomes for different smart beta strategies. Section 6 presents the conclusion of the study. Finally, Section 7 discusses the implications and future scope.
2. Literature Review
2.1 Overview of Smart Beta Investing
Smart beta is a novel investing ideology that integrates underlying factors such as size, low risk, profitability, value, investment, and momentum (Basu, 1977; Banz, 1981; Jegadeesh & Titman, 1993; Fama & French, 1996, 2012, 2015; Frazzini & Pedersen, 2014). These funds are often expressed as “the vehicle to deliver factor investing” (BlackRock). In other words, smart beta strategies aim to outperform traditional passive indices by introducing a factor-based investment ideology. Ang et al. (2009) analyzed that factor-driven smart beta strategies are intensifying because they are based on well-founded risk factors that substantially improve risk-adjusted performance. They documented that this relatively new indexing approach focuses on capturing exposure to various robust risk premia factors that have been extensively used in actively managed portfolios.
Cakici et al. (2013) examined factor indices of value and momentum in 18 emerging markets, including Eastern Europe, Asia, and Latin America. The authors found substantial evidence for the value and the momentum effects in all emerging economies except in Eastern Europe from January 1990 to December 2011. Amenc et al. (2014) evaluated the smart beta indices of momentum, value, mid-cap, and low volatility. They found a substantial annual outperformance ranging from 2.92% to 4.96%, even after considering high transaction costs. Arnott and Kose (2014) defined smart beta as a “category of valuation-indifferent strategies that consciously and deliberately break the link between the price of an asset and its weight in the portfolio, seeking to earn an excess return over cap-weighted benchmark by no longer weighing assets proportional to their popularity, while retaining most of the positive attributes of passive indexing.”
Jacobs and Levy (2014) stated that smart beta investing incorporates the concept of both active and passive investing. They argued that these strategies are centered on a rule-based ideology that weights equities differently from the traditional cap-weighting methodologies. Bender and Wang (2015) examined five-factor strategies from 1993 to 2013 and found that all of them outperformed the MSCI cap-weighted index. Blitz (2016) evaluated the effectiveness of smart beta strategies across two weighting methodologies and concluded that these portfolios consistently beat the cap-weighted index over the study period of 1990–2015. Hanauer and Linhart (2015) examined three factors: value, size, and momentum for 21 emerging and 24 developed countries over July 1996 to June 2012. They documented a strong value effect and a considerable but less significant momentum effect. Furthermore, they found that the value component is more prevalent in emerging economies than in developed markets.
Kahnand Lemmon (2016) observed that smart beta products deliver abnormal returns more cost-effectively and transparently than actively managed products. Agarwalla et al. (2017) examined value, size, and momentum factors in the Indian stock market over the study period of 1994 to 2017. They concluded that momentum and value are viable investments, but the size component does not outperform the market portfolio in the Indian equity market. Angelidis and Tessaromatis (2017) analyzed four factors portfolios: value, low-risk, small-cap, and momentum for 23 developed and 21 emerging economies from 1980 to 2015. They found that factor portfolios exhibited superior Sharpe ratios and, in most situations, statistically significant returns when compared to world market portfolios. The authors also broadened the research by creating global factor portfolios that included emerging economies and found evidence of improved factor return efficiency.
Bender et al. (2018) tested the five advanced beta strategies: value, profitability, investment, size, and momentum from 1963 to 2015 and reported that all these strategies delivered more excess returns than the cap-weighted market index. Martellini and Milhau (2018) evaluated the six fundamental lead factors from 1970–2015. They identified that these strategies outperformed the traditional index in terms of Sharpe ratio and could diversify the unrewarded risks. In the Korean Stock Market, between 2004 and 2020, Kim (2021) presented a comprehensive examination of five factors: value, size, profitability, low risk, and momentum. The results show that all factors outperformed the market index, with the size factor generating the highest return. Monga et al. (2021) evaluated optimization-based alternative indexing strategies in the emerging Indian equity market from April 2004 to March 2020. They found evidence of extensive outperformance and increased diversification for optimized strategies compared to the standard market index. Silvasti et al. (2021) tested smart beta strategies based on momentum, value, and low beta from December 1991 to January 2019. They noted that these strategies outperformed the Nordic equity market, with momentum and low beta having the highest alpha and Shape ratio.
Empirically, there is substantial evidence regarding the effectiveness of smart beta strategies. However, the literature is mainly limited to the U.S. and other mature markets. In a growing market like India, these investing strategies may or may not be effective. Therefore, given the paucity of such empirical evidence, the current study focuses on the construction, execution, and performance of the smart beta investment in the scarcely researched emerging Indian equity market.
2.2 Theoretical Framework of Factor Exposures
Our study incorporates six factor-based smart beta exposures: value, investment, profitability, size, momentum, and low volatility. Exclusively, all these factors are broadly esteemed in the academic literature (Jagadeesh & Titman, 1993; Fama & French, 1996, 2012; Frazzini & Pedersen, 2014; Hou et al., 2015). The persistence and robustness of the factor exposures are presented as follows:
Value Factor: This factor measures how well value stocks (those with low valuation) outperform growth stocks. For the most part, value investing has been examined by the most prominent researchers (Basu, 1977; Chan et al., 1991; Zhang, 2005). They found an affirmative association between stocks with low prices and their fundamentals, such as book value, dividends, sales, and earnings. The theoretical rationale for the value premium is intuitive, i. e., value firms carry a higher level of risk because they are more vulnerable to economic shocks during times of financial distress and hence demand a substantial risk premium (Fama & French, 1996; Zhang, 2005). Another strand of research for the value premium has been studied in the context of behavioral biases. Investors tend to extrapolate “growth stocks with past positive news” and “overreact to past negative news about value stocks,” resulting in higher returns for value stocks (Lakonishok et al., 1994).
Investment Factor: This fundamental factor exhibits inclination towards lower investment strategies over higher investment ones. Li and Zhang (2010) and Hou et al. (2015) examined “investment” as a relatively more recent asset pricing factor in the q-theory of investment. They found that the rationale behind low investment frictions is characterized by a larger asset size, greater sales growth, higher cash flows, lower debt-to-asset ratio, and higher dividend payout ratio. Similarly, Fama and French (2015) investigated the difference between conservative and aggressive levels of investment and concluded that lower investment levels are associated with higher anticipated returns.
Profitability Factor: Researchers are increasingly emphasizing the “profitability factor” in addition to the conventional value, size, and momentum factors. This factor targets to capture the “quality factor” premium by purchasing “High-profit” companies and evading “Low-profit” companies. The academic explanation for the profitability premium can be explained using a rational risk-based “q-theory of investment” (Hou et al., 2015). Unlike traditional criteria that rely on market price, profitability indicators are solely based on accounting data. For instance, Novy Marx (2013) used the gross profit margin for measuring profitability. Famaand French (2015) considered operating profit as a dimension of profitability in their five-factor model. Hou et al. (2015) illustrated this factor by the Return on Equity (ROE).
Size Factor: This factor has more exposure to smaller companies and less correspondence to the larger companies. Size as a factor was originated by Banz (1981) to target that smaller companies capture relative returns corresponding to the larger ones. Various theories explain the rationale for the outperformance of small size effect. For instance, Fama and French (1993, 2012) proposed that small caps exposed to undiversifiable risk result in a higher premium. Other studies, in particular, argued that smaller companies are associated with financial distress, low dividends (Chan & Chen, 1991), lower liquidity (Amihud, 2002), information uncertainty (Zhang, 2006), and thus offer superior returns.
Momentum Factor: It suggests that stocks with stronger past performance substantially outperform those with lower past performance. Jegadeesh and Titman (1993) observed that buying past outperformers and selling past underperformers generated extensive “abnormal” returns from 1965–1989 in the U.S. stock market. Similarly, Fama and French (2012) discovered strong persistence of momentum returns from 1989 to 2011. They also considered “momentum” as a robust and persistent factor that was not captured by either value or size effect. The most widely cited theories underlying this premium are all behavioral (Hong et al., 2000). Evidently, the theories around the momentum effect have been developed in the context of investor behavior, i. e., their over-reaction or under-reaction to new information (such as corporate results or dividend announcements). Another possible reason could be herding behavior, which occurs when profit-seeking investors create a feedback system that causes prices to drift away from fundamentals (Dasgupta et al., 2011).
Low Volatility Factor: The “low volatility” premium measures the outperformance of low volatility stocks over highly volatile stocks. Blitzand Vliet (2007) and Hsu et al. (2015) examined the low-volatility effect and found that low-risk stocks substantially outperformed the market benchmark. The low volatility anomaly and its persistence may be explained by a variety of cognitive and behavioral factors. One of the first explanations is the “lottery effect,” which refers to an investor’s readiness to pay a higher price for a slight chance of making a significant profit, even when the chances of losing are much higher than winning (Baker et al., 2011). Other behavioral explanations include investors being leverage-constrained and seeking substantial returns in highly volatile stocks (Frazzini & Pedersen, 2014). Also, investors have a natural tendency to overestimate the performance of a few “well-publicized high-riskier stocks” and hence overpay in the hope of owning the enormous returns.
3. Research Framework
The study involves an integrated approach to the construction of smart beta strategies. First, it includes the stock selection criterion by six well-documented factor exposures and then employs three distinct weighting schemes to allocate these selected stocks.
3.1 Factor Selection
The first stage in constructing smart beta strategies is determining well-acknowledged factor exposures for selecting the stocks. To construct portfolios, we used a set of factor attributes and selected stocks according to the accompanying determination rules (see Table 1).
The details of the construction of factor portfolios are as follows:
Value Factor: Stocks are sorted by their high to low B/M ratio, and after that, Top 50% are selected to explore the value tilt.
Investment Factor: First, stocks are arranged as per the two-year growth rate of total assets. Afterward, the stocks from the bottom 50% are selected to get the exposure of low investment.
Table 1
Methodology for Construction of Portfolios Based on Factor Exposures
|
Factor |
Measure |
Signal |
Supporting Literature |
|
Value (HML) |
Book-to-Market Ratio (B/M) |
High |
Cakici et al. (2013); Hsu et al. (2015); Blitz (2016); Hu et al. (2019) |
|
Investment (INV) |
The two-year growth rate of Total asset |
Low |
Hou et al. (2015); Blitz (2016); Bender et al. (2018) |
|
Profitability (PROF) |
Return On Equity |
High |
Hou et al. (2015); Hsu et al. (2015) |
|
Size (SMB) |
Log value of Market Capitalization |
Small |
Cakici et al. (2013); Hanauer and Linhart (2015); Hou et al. (2015); Bender et al. (2018) |
|
Momentum (MOM) |
Stock return over 12-months, minus the last month’s return |
High |
Hanauer and Linhart (2015); Blitz (2016); Agarwalla et al. (2017) |
|
Low Volatility (LVOL) |
The standard deviation of returns over the most recent 104 weeks |
Low |
Hsu et al. (2015); Centineo and Centineo (2017) |
Profitability Factor: To explore this strategy, Top 50% of stocks are picked up as per the ROE signal.
Size Factor: The bottom 50% of stocks are selected as per the log value of market capitalization.
Momentum Factor: This strategy looks into the Top 50% of stocks based on the returns over 12 months, skipping the most recent month.
Low volatility: This tilt utilizes the standard deviation of stock returns in the course of the most recent 104 weeks. Afterward, the Bottom 50% of stocks is selected as per this criterion.
3.2 Description of the Weighting Schemes
After selecting appropriate factor exposures, the next significant move is to choose the diversified portfolio weighting methodologies. In other words, stock weighting plays a vital role in evaluating the performance, consistency, and robustness of smart beta strategies. As a result, we tested the portfolios by implementing the following three notable and effectual types of weighting schemes:
Risk Parity Weighting (RP): It is recognized as the “Diversified Risk-Weighted” strategy based on the phenomenon that each stock has an equivalent risk contribution to the portfolio. It is assumed that the strategy attempts to reduce risk concentrations by allocating large weights to less risky stocks while moving away from riskier stocks. This method is used as a proxy for Inverse Volatility Strategy, and thereby weights are inversely proportional to the stock’s volatility (Chaves et al., 2011; Russo, 2014). It is determined as per Equation (1):
 (1)
(1)
where wi represents the weight of ith stock; n is the number of stocks; σi stands for ith stock’s volatility.
Factor Weighting (FW): This strategy follows a methodology that ranks stocks based on their factor criteria. For instance, the B/M ratio is used to capture value tilt. Likewise, other factors are formulated as per the desired measurement criteria (see Table 1). Following that, the strategy assigns Z-scores to all the stocks with desired factor attributes. Consequently, the calculated Z-factor scores are then transformed into Standardized factor scores (S-factor scores) by normalizing them between 0 and 1 (refer to Appendix 1). Finally, to calculate stock weights, a common practice is adopted by various factor index providers, i. e., to adjust market cap-weight to the normalized S-factor scores. Hence, the final weights are calculated as per Equation (2):
 (2)
(2)
where Si is the standardized factor score of ith stock, and MCi is the market cap-weight of ith stock.
Equal Weighting (EW): It is perceived as a “Maximum Deconcentration” strategy and has only one parameter: the number of stocks. This approach gives each stock the same weight, thereby avoiding the large-cap tendency while also taking advantage of smaller companies. It is utilized as a proxy for the diversified weighting plan (Chaves et al., 2011; Amenc et al., 2017). Equation (3) is used to determine the weights:
 (3)
(3)
where n is the number of stocks.
3.3 Integrated Framework for Constructing Smart Beta Strategies
The next major step is to apply an integrated framework, i. e., an approach that links factor-based stock selection and diversified weighting schemes. As a result, our analysis integrates different stock selection and stock weighting methodologies for constructing smart beta strategies (see Figure 1).
Figure 1
Integrated Framework for Construction of Smart Beta Strategies
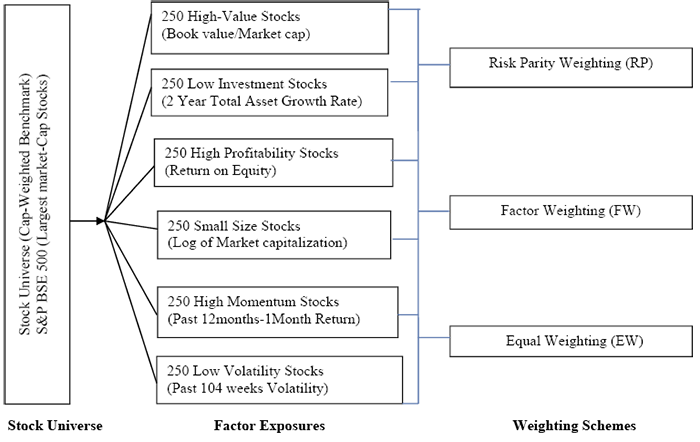
Figure 1 gives an outline of the smart beta strategies for the study. First, we selected S&P BSE 500 stock universe to construct smart beta strategies. Following that, we developed portfolios that comprise value, investment, profitability, size, momentum, and low volatility. Afterward, to add diversification, we applied different weighting allocation schemes to these selected stocks.
4. Data
The entire set of strategies is applied to S&P BSE 500 Stock universe from July 1, 2003 to June 30, 2020. The logical rationale for using this data period is that Indian stock markets underwent numerous structural and economic downturns, including financial crisis of 2007–08, demonetization in 2016, implementation of GST (Goods and Services Tax) in 2017, and recently, the COVID-19 pandemic. In other words, the selected sample period with 204 monthly observations encompasses both bull and bear market circumstances. As a result, the study uses the approach of Fuller and Goldstein (2011), which divides the entire sample period into two sub-periods, bull and bear. The bull sample includes 126 monthly observations, i. e., the period of positive market returns, while the bear sample has 78 months, which corresponds to the period of negative market returns. Such analysis is significant for investors who want to understand how their portfolio performs in various market conditions and how that behavior contributes to their overall portfolio performance.
All the factors strategies are re-balanced annually, except momentum, which is re-balanced semi-annually. Apart from that, we obtained the weights from the smart beta strategies, retained the portfolio till the following re-balancing period, and accounted for their monthly performance. The entire set of relevant data is collected using the Bloomberg database.
5. Empirical Results and Discussion
The considered smart beta strategies incorporate six factor-exposures across three weighting schemes. Each portfolio is measured from July 1, 2003 to June 30, 2020, and is compared with the Indian Market Index S&P BSE 500.
Table 2
Absolute Performance of Smart Beta Strategies
|
Panel A: Value Strategy |
||||
|
|
RP |
FW |
EW |
BSE500 |
|
Monthly Return |
1.58 (0.04) |
1.60 (0.12) |
1.90 (1.15) |
1.57 |
|
Volatility |
7.99 |
9.20 |
9.07 |
7.07 |
|
Sharpe ratio |
0.13 (-0.54) |
0.11 (-0.48) |
0.15 (0.19) |
0.14
|
|
Maximum Drawdown |
26.78 |
30.34 |
29.88 |
27.11 |
|
Downside Risk |
4.24 |
4.83 |
4.70 |
3.99 |
|
Sortino Ratio |
0.24 (-0.54) |
0.22 (-0.48) |
0.29 (0.76) |
0.25 |
|
Panel B: Investment Strategy |
||||
|
|
RP |
FW |
EW |
BSE500 |
|
Monthly Return |
1.71 (0.72) |
2.02* (2.09) |
2.13* (2.39) |
1.57 |
|
Volatility |
6.85 |
8.03 |
8.16 |
7.07 |
|
Sharpe ratio |
0.17* (2.12) |
0.18* (3.16) |
0.19* (3.35) |
0.14 |
|
Maximum Drawdown |
22.62 |
27.41 |
26.98 |
27.11 |
|
Downside Risk |
3.59 |
4.16 |
4.19 |
3.99 |
|
Sortino Ratio |
0.32* (2.35) |
0.35* (7.89) |
0.38* (8.72) |
0.25 |
|
Panel C: Profitability Strategy |
||||
|
|
RP |
FW |
EW |
BSE500 |
|
Monthly Return |
2.53* (5.41) |
3.04* (9.50) |
3.13* (9.49) |
1.57 |
|
Volatility |
5.92 |
6.80 |
7.03 |
7.07 |
|
Sharpe ratio |
0.33* (2.74) |
0.36* (5.37) |
0.37* (6.57) |
0.14 |
|
Maximum Drawdown |
19.53 |
22.86 |
23.07 |
27.11 |
|
Downside Risk |
3.06 |
3.44 |
3.52 |
3.99 |
|
Sortino Ratio |
0.64* (5.63) |
0.72* (11.46) |
0.73* (13.70) |
0.25 |
|
Panel D: Size Strategy |
||||
|
|
RP |
FW |
EW |
BSE500 |
|
Monthly Return |
2.30* (2.62) |
2.86* (3.88) |
3.01* (4.33) |
1.57 |
|
Volatility |
7.89 |
9.05 |
9.12 |
7.07 |
|
Sharpe ratio |
0.22* (10.67) |
0.25* (3.35) |
0.27* (4.06) |
0.14 |
|
Maximum Drawdown |
24.49 |
28.86 |
28.56 |
27.11 |
|
Downside Risk |
3.97 |
4.43 |
4.42 |
3.99 |
|
Sortino Ratio |
0.44* (12.46) |
0.52* (8.23) |
0.55* (9.36) |
0.25 |
|
Panel E: Momentum Strategy |
||||
|
|
RP |
FW |
EW |
BSE500 |
|
Monthly Return |
2.44* (4.05) |
2.93* (6.08) |
2.98* (6.05) |
1.57 |
|
Volatility |
6.58 |
7.59 |
7.79 |
7.07 |
|
Sharpe ratio |
0.29* (3.19) |
0.31* (11.4) |
0.31* (15.54) |
0.14 |
|
Maximum Drawdown |
22.10 |
25.63 |
26.61 |
27.11 |
|
Downside Risk |
3.36 |
3.79 |
3.86 |
3.99 |
|
Sortino Ratio |
0.56* (6.60) |
0.62* (14.82) |
0.63* (15.22) |
0.25 |
|
Panel F: Low Volatility Strategy |
|||||
|
|
RP |
FW |
EW |
BSE500 |
|
|
Monthly Return |
1.70* (2.13) |
1.89* (2.39) |
1.94* (3.81) |
1.57 |
|
|
Volatility |
5.33 |
5.87 |
6.11 |
7.07 |
|
|
Sharpe ratio |
0.21* (2.09) |
0.23* (2.42) |
0.24* (2.79) |
0.14 |
|
|
Maximum Drawdown |
18.51 |
20.99 |
21.37 |
27.11 |
|
|
Downside Risk |
2.88 |
3.14 |
3.24 |
3.99 |
|
|
Sortino Ratio |
0.40* (2.21) |
0.42* (2.68) |
0.43* (3.22) |
0.25 |
|
Note. Authors’calculation based on monthly total returns from July 1, 2003 to June 30, 2020. The cap-weighted index is represented by the S&P BSE 500. The risk-free rate is calculated using the yield on 91 days Treasury bills. The computed results are reported in percentages except for the Sharpe and Sortino ratios. The t-statistics are presented in parentheses, and (*) values are significant at the 5% level.
Table 2 summarizes the absolute performance statistics of the smart beta strategies over the study period. The results demonstrate that smart beta portfolios outperformed the market index, which is consistent with previous studies (Bender & Wang, 2015; Blitz, 2016; Bender et al., 2018; Kim, 2021). It is noteworthy that smart beta strategies have led to statistically significant higher returns, superior Sharpe, and Sortino ratios than the S&P BSE 500 index. However, we have found no robust value effect in recent years. This result aligns with Hillard and Zhang (2015) and Hu et al. (2019). Particularly, profitability and low volatility are optimal strategies with higher returns and lower volatility than the market index. It is also evident that the EW portfolio delivers comparatively good risk-adjusted performance, i. e., beat other portfolios in terms of monthly return, the Sharpe ratio, and the Sortino ratio. These results where EW portfolios outperformed are consistent with DeMiguel et al.(2009), Malladi and Fabozzi(2017) and more recently, Bermejo et al. (2021).
The RP portfolios hold the lowest volatility, which is consistent with the rationale of risk-minimization strategies (Chaves et al., 2011). At the same time, for the other attributes, e. g., Maximum Drawdown and Downside risk, RP portfolios are clearly at an advantage compared to other stock weighting schemes. Typically, Panel C, E, and F of Table 2 show that profitability, momentum, and low volatility have maximum drawdown generally around 18.51% to 26.61% as compared to 27.11% for the S&P BSE 500 and downside risk ranging between 2.88% to 3.86% as contrasted to 3.99% for the market index. These attributes show lower levels of underperformance for smart beta strategies than the traditional market index.
Table 3
Relative Risk/Return Profile of Smart Beta Strategies
|
Panel A: Value Strategy |
|||
|
|
RP |
FW |
EW |
|
Relative Return |
0.01 |
0.03 |
0.33 |
|
Tracking Error |
3.13 |
3.87 |
3.81 |
|
Information Ratio |
0.003 |
0.008 |
0.09 |
|
Maximum Relative Drawdown |
12.17 |
10.44 |
10.26 |
|
Extreme Relative Returns (5th %ile) |
-4.61 |
-5.28 |
-5.10 |
|
Extreme Tracking Error (95th %ile) |
4.84 |
5.84 |
6.16 |
|
Panel B: Investment Strategy |
|||
|
|
RP |
FW |
EW |
|
Relative Return |
0.14 |
0.45 |
0.56 |
|
Tracking Error |
2.64 |
2.91 |
3.15 |
|
Information Ratio |
0.05 |
0.15 |
0.18 |
|
Maximum Relative Drawdown |
12.95 |
10.99 |
11.47 |
|
Extreme Relative Returns (5th %ile) |
-3.65 |
-3.96 |
-4.30 |
|
Extreme Tracking Error (95th %ile) |
4.75 |
5.48 |
6.10 |
|
Panel C: Profitability Strategy |
|||
|
|
RP |
FW |
EW |
|
Relative Return |
0.96 |
1.47 |
1.56 |
|
Tracking Error |
2.38 |
2.08 |
2.17 |
|
Information Ratio |
0.40 |
0.71 |
0.72 |
|
Maximum Relative Drawdown |
9.17 |
5.39 |
5.30 |
|
Extreme Relative Returns (5th %ile) |
-2.61 |
-1.83 |
-1.76 |
|
Extreme Tracking Error (95th %ile) |
4.62 |
5.03 |
5.27 |
|
Panel D: Size Strategy |
|||
|
|
RP |
FW |
EW |
|
Relative Return |
0.73 |
1.29 |
1.44 |
|
Tracking Error |
3.73 |
4.46 |
4.45 |
|
Information Ratio |
0.20 |
0.29 |
0.32 |
|
Maximum Relative Drawdown |
12.17 |
11.19 |
9.42 |
|
Extreme Relative Returns (5th %ile) |
-4.58 |
-4.60 |
-4.59 |
|
Extreme Tracking Error (95th %ile) |
7.46 |
9.68 |
10.02 |
|
Panel E: Momentum Strategy |
|||
|
|
RP |
FW |
EW |
|
Relative Return |
0.87 |
1.36 |
1.41 |
|
Tracking Error |
2.89 |
3.00 |
3.13 |
|
Information Ratio |
0.30 |
0.45 |
0.45 |
|
Maximum Relative Drawdown |
9.35 |
7.41 |
8.41 |
|
Extreme Relative Returns (5th %ile) |
-3.62 |
-3.15 |
-3.39 |
|
Extreme Tracking Error (95th %ile) |
5.26 |
6.20 |
6.33 |
|
Panel F: Low Volatility Strategy |
|||
|
|
RP |
FW |
EW |
|
Relative Return |
0.13 |
0.32 |
0.37 |
|
Tracking Error |
2.73 |
2.35 |
2.36 |
|
Information Ratio |
0.05 |
0.14 |
0.16 |
|
Maximum Relative Drawdown |
11.66 |
11.22 |
10.67 |
|
Extreme Relative Returns (5th %ile) |
-3.97 |
-3.60 |
-3.43 |
|
Extreme Tracking Error (95th %ile) |
3.88 |
3.43 |
3.60 |
Note. Relative returns are the excess return of the factor strategy over the benchmark (S&P BSE 500 index). All results are reported per month and in percentages except for the information ratio.
The results presented in Table 3 measure the relative risk-return performance of these diverse portfolios. An examination of relative performance shows that the smart beta strategies outperformed the standard index, with monthly excess returns ranging from 0.01% and 1.56%. It is noted that the EW portfolios generate the highest excess returns, which is not surprising as Table 2 displays an identical pattern for the absolute returns. From Table 3, we find that EW portfolios also lead to superior risk-adjusted performance, i. e., information ratio.
Furthermore, it is interesting to examine the tracking error (the volatility of excess returns) for the factor strategies across different weighting schemes. By comparison, the RP weighted portfolios have the lowest tracking error to the S&P BSE 500 in four out of 6 cases. On the other hand, the FW portfolios deliver a lower tracking error in profitability and low volatility. Finally, Panel C of Table 3 displays that the profitability strategy generates the highest relative return and is accompanied by the lowest tracking error, resulting in the highest information ratio. However, value strategy (Table 3, Panel A) gives the lowest excess return compared to other strategies.
Table 4
Robustness of Smart Beta Strategies: Under Bullish and Bearish Market Conditions
|
Panel A: Value Strategy |
|||
|
|
RP |
FW |
EW |
|
Upside Participation |
1.06 |
1.20 |
1.27 |
|
Downside Participation |
1.27 |
1.48 |
1.36 |
|
Average Participation |
1.17 |
1.34 |
1.32 |
|
Participation Advantage |
-0.21 |
-0.28 |
-0.09 |
|
Panel B: Investment Strategy |
|||
|
|
RP |
FW |
EW |
|
Upside Participation |
1.04 |
1.22 |
1.26 |
|
Downside Participation |
0.96 |
1.10 |
1.10 |
|
Average Participation |
1.00 |
1.16 |
1.18 |
|
Participation Advantage |
0.08 |
0.12 |
0.16 |
|
Panel C: Profitability Strategy |
|||
|
|
RP |
FW |
EW |
|
Upside Participation |
1.20 |
1.41 |
1.42 |
|
Downside Participation |
0.53 |
0.53 |
0.54 |
|
Average Participation |
0.87 |
0.97 |
0.98 |
|
Participation Advantage |
0.67 |
0.88 |
0.88 |
|
Panel D: Size Strategy |
|||
|
|
RP |
FW |
EW |
|
Upside Participation |
1.30 |
1.54 |
1.59 |
|
Downside Participation |
1.03 |
1.08 |
1.06 |
|
Average Participation |
1.17 |
1.31 |
1.33 |
|
Participation Advantage |
0.27 |
0.46 |
0.53 |
|
Panel E: Momentum Strategy |
|||
|
|
RP |
FW |
EW |
|
Upside Participation |
1.23 |
1.44 |
1.47 |
|
Downside Participation |
0.68 |
0.73 |
0.75 |
|
Average Participation |
0.96 |
1.09 |
1.11 |
|
Participation Advantage |
0.55 |
0.71 |
0.72 |
|
Panel F: Low Volatility Strategy |
|||
|
|
RP |
FW |
EW |
|
Upside Participation |
0.93 |
1.02 |
1.06 |
|
Downside Participation |
0.67 |
0.75 |
0.78 |
|
Average Participation |
0.80 |
0.89 |
0.92 |
|
Participation Advantage |
0.26 |
0.27 |
0.28 |
Note. In upside participation, the bull market corresponds to the positive market returns, while in downside participation, months with negative returns comprise bear markets.
Besides examining the attributes of return and volatility for different portfolios, our approach includes other parameters that are also valuable for analyzing the consistency and robustness of these strategies. Furthermore, previous literature (Fuller & Goldstein, 2011; Amenc et al., 2014; Monga et al., 2021) suggested separating bull and bear phases when analyzing conditional performance. In light of this, we used the method proposed by Qian (2015) to evaluate a portfolio’s ability to capture upside returns while limiting downside risk. As a result, we computed upside and downside participation ratios (refer to Appendix 1) to evaluate whether the performance of smart beta strategies is persistent across different market environments. Following that, we calculated the participation advantage and average participation. Interestingly, participation advantage measures the difference between the upside and downside participation ratios and demonstrates the strategy’s effectiveness to create value over the entire market cycle.
A strategy with a positive participation advantage is considered better than the one with negative participation because a strategy with a positive advantage gives “upside participation and downside protection” (Qian, 2015). In comparison, the average participation indicates whether the portfolio is cyclical or defensive. A portfolio can be classified as cyclical when its accumulating benefits arise in the period when the market is up. Conversely, the strategy accruing with substantial benefits when the market is down is considered a defensive one. The convention is that if the average participation value is greater than one, the strategy is cyclical, and if that value is less than one, it turns to be defensive. However, with the average value of 1, the portfolio is termed as neutral, i. e., neither cyclical nor defensive (Sorensen et al., 2018).
To test this empirically, we evaluated the performance patterns of smart beta strategies over different market cycles (Table 4). From the results obtained, the EW approach is progressively preferred as it has the highest participation advantage and thus gives the maximum upside participation and downside protection. The outcome also illustrates that profitability, momentum, and size strategies show relatively high participation advantages and provide more opportunities over the cycle. In comparison to this, other strategies substantially have low participation advantages. Moreover, according to the average participation, low volatility and profitability strategies are more defensive and pay off more when the market is down. As a result, the present study shows ample evidence that these strategies are consistent, robust, and outperforming irrespective of the market conditions. The results achieved are aligned with Amenc et al. (2014), Sorensen et al. (2018), and Bermejo et al. (2021).
Table 5
Measures of Diversification and Active Risk
|
Panel A: Value Strategy |
|||
|
|
RP |
FW |
EW |
|
Effective No. of Stocks |
151 |
157 |
250 |
|
GLR Measure (%) |
38.29 |
39.80 |
37.66 |
|
Active Factor Risk (%) |
3.07 |
3.81 |
3.75 |
|
Idiosyncratic Risk (%) |
1.56 |
1.61 |
1.60 |
|
Residual Sharpe ratio |
0.18 |
0.27 |
0.31 |
|
Panel B: Investment Strategy |
|||
|
|
RP |
FW |
EW |
|
Effective No. of Stocks |
146 |
164 |
250 |
|
GLR Measure (%) |
32.75 |
33.34 |
33.44 |
|
Active Factor Risk (%) |
2.59 |
2.87 |
3.10 |
|
Idiosyncratic Risk (%) |
1.39 |
1.48 |
1.48 |
|
Residual Sharpe ratio |
0.36 |
0.45 |
0.47 |
|
Panel C: Profitability Strategy |
|||
|
|
RP |
FW |
EW |
|
Effective No. of Stocks |
139 |
147 |
250 |
|
GLR Measure (%) |
29.18 |
28.45 |
28.94 |
|
Active Factor Risk (%) |
2.32 |
2.04 |
2.14 |
|
Idiosyncratic Risk (%) |
1.37 |
1.49 |
1.55 |
|
Residual Sharpe ratio |
0.45 |
0.47 |
0.48 |
|
Panel D: Size Strategy |
|||
|
|
RP |
FW |
EW |
|
Effective No. of Stocks |
144 |
168 |
250 |
|
GLR Measure (%) |
33.71 |
32.13 |
32.01 |
|
Active Factor Risk (%) |
3.65 |
4.39 |
4.38 |
|
Idiosyncratic Risk (%) |
1.55 |
1.51 |
1.52 |
|
Residual Sharpe ratio |
0.28 |
0.42 |
0.45 |
|
Panel E: Momentum Strategy |
|||
|
|
RP |
FW |
EW |
|
Effective No. of Stocks |
158 |
155 |
250 |
|
GLR Measure (%) |
30.24 |
24.53 |
25.81 |
|
Active Factor Risk (%) |
2.82 |
2.94 |
3.07 |
|
Idiosyncratic Risk (%) |
1.46 |
1.51 |
1.47 |
|
Residual Sharpe ratio |
0.49 |
0.37 |
0.41 |
|
Panel F: Low Volatility Strategy |
|||
|
|
RP |
FW |
EW |
|
Effective No. of Stocks |
163 |
164 |
250 |
|
GLR Measure (%) |
31.83 |
34.03 |
34.23 |
|
Active Factor Risk (%) |
2.65 |
2.29 |
2.29 |
|
Idiosyncratic Risk (%) |
1.35 |
1.38 |
1.43 |
|
Residual Sharpe ratio |
0.38 |
0.43 |
0.44 |
To quantify the properties of diversification, we calculated ENS and GLR (Goetzmann et al., 2005; Amenc et al., 2017), as shown in Table 5. The results illustrate that the RP weighting leads to a concentrated index implying a low number of effective constituents, while EW portfolios have considerably higher ENS. Besides this, the findings show that GLR measures for all the smart beta strategies range from 24.53% to 39.80% compared to the 41.33% GLR for the traditional counterpart (BSE S&P 500). The higher GLR suggests that the traditional index accounts for high correlation across stocks and therefore gives sufficient evidence that it is not well diversified. The findings support previous results (Amenc et al., 2014, 2017).
Furthermore, we tested a multi-factor regression model (Equation 4) to examine the two components of active risk, i. e., factor and idiosyncratic risk. Active factor risk is calculated as the square root of the product of R2 and TE2, (i. e., R-Squared and Tracking error Squared), whereas the idiosyncratic risk measures the standard deviation of residuals.
 (4)
(4)
where RP represents factor portfolio return, RM stands for the market return, and RF denotes the risk-free rate.
An essential feature of Table 5 is that the profitability factor has the lowest factor risk, while the low volatility strategy has the lowest idiosyncratic risk. The rationale for low idiosyncratic risk for this strategy is that it accounts for volatility and, therefore, eliminates risk concentration. Furthermore, the findings show that EW portfolios have a predominant residual Sharpe ratio (alpha return per unit of idiosyncratic risk). More specifically, Panel C of Table 5 shows that the profitability factor in the EW approach has the highest residual Sharpe ratio, implying the highest idiosyncratic risk-adjusted return.
Table 6
Exposure of Smart Beta Strategies: A Multi-Factor Regression Approach
|
Panel A: Value Strategy |
|||
|
|
RP |
FW |
EW |
|
Alpha (%) |
0.28 |
0.43* |
0.49* |
|
Market Beta |
0.85* |
0.89* |
0.89* |
|
SMB Beta |
0.28* |
0.21* |
0.29* |
|
HML Beta |
0.25* |
0.34* |
0.29* |
|
MOM Beta |
0.02 |
0.02 |
0.02 |
|
LVOL Beta |
-0.08* |
-0.20* |
-0.19* |
|
INV Beta |
0.07 |
0.10 |
0.07 |
|
PROF Beta |
-0.06 |
-0.08 |
-0.06 |
|
R-Squared (%) |
96.23 |
96.97 |
96.93 |
|
Factor Intensity |
0.48 |
0.39 |
0.42 |
|
Relative Return/Factor Intensity (%) |
0.02 |
0.08 |
0.79 |
|
Panel B: Investment Strategy |
|||
|
|
RP |
FW |
EW |
|
Alpha (%) |
0.50* |
0.67* |
0.70* |
|
Market Beta |
0.84* |
0.92* |
0.91* |
|
SMB Beta |
0.31* |
0.27* |
0.32* |
|
HML Beta |
0.04 |
0.04 |
0.06 |
|
MOM Beta |
0.02 |
0.01 |
0.02 |
|
LVOL Beta |
0.02 |
-0.09* |
-0.10* |
|
INV Beta |
0.28* |
0.35* |
0.35* |
|
PROF Beta |
-0.05 |
-0.06 |
-0.05 |
|
R-Squared (%) |
95.93 |
96.63 |
96.74 |
|
Factor Intensity |
0.62 |
0.52 |
0.60 |
|
Relative Return/Factor Intensity (%) |
0.23 |
0.87 |
0.93 |
|
Panel C: Profitability Strategy |
|||
|
|
RP |
FW |
EW |
|
Alpha (%) |
0.61* |
0.70* |
0.74* |
|
Market Beta |
0.86* |
0.94* |
0.93* |
|
SMB Beta |
0.30* |
0.28* |
0.31* |
|
HML Beta |
0.00 |
0.01 |
0.03 |
|
MOM Beta |
0.04 |
0.02 |
0.02 |
|
LVOL Beta |
0.05 |
-0.05 |
-0.07 |
|
INV Beta |
0.08 |
0.09 |
0.05 |
|
PROF Beta |
0.22* |
0.33* |
0.30* |
|
R-Squared (%) |
94.67 |
95.57 |
95.18 |
|
Factor Intensity |
0.69 |
0.68 |
0.64 |
|
Relative Return/Factor Intensity (%) |
1.39 |
2.18 |
2.44 |
|
Panel D: Size Strategy |
|||
|
|
RP |
FW |
EW |
|
Alpha (%) |
0.44* |
0.63* |
0.68* |
|
Market Beta |
0.87* |
0.92* |
0.92* |
|
SMB Beta |
0.63* |
0.72* |
0.71* |
|
HML Beta |
0.08 |
0.06 |
0.07 |
|
MOM Beta |
0.04 |
0.04 |
0.05* |
|
LVOL Beta |
0.00 |
-0.09* |
-0.12* |
|
INV Beta |
0.06 |
0.05 |
0.02 |
|
PROF Beta |
-0.01 |
-0.03 |
-0.01 |
|
R-Squared (%) |
96.16 |
97.26 |
97.23 |
|
Factor Intensity |
0.80 |
0.75 |
0.72 |
|
Relative Return/Factor Intensity (%) |
0.91 |
1.72 |
2.00 |
|
Panel E: Momentum Strategy |
||||
|
|
RP |
FW |
EW |
|
|
Alpha (%) |
0.72* |
0.56* |
0.60* |
|
|
Market Beta |
0.85* |
0.87* |
0.89* |
|
|
SMB Beta |
0.35* |
0.25* |
0.32* |
|
|
HML Beta |
0.11* |
-0.06 |
0.03 |
|
|
MOM Beta |
0.33* |
0.38* |
0.39* |
|
|
LVOL Beta |
0.01 |
-0.19* |
-0.18* |
|
|
INV Beta |
0.07 |
0.09 |
0.05 |
|
|
PROF Beta |
0.04 |
-0.05 |
0.00 |
|
|
R-Squared (%) |
95.16 |
96.06 |
96.48 |
|
|
Factor Intensity |
0.91 |
0.42 |
0.61 |
|
|
Relative Return/Factor Intensity (%) |
0.96 |
3.24 |
2.31 |
|
|
Panel F: Low Volatility Strategy |
|||
|
|
RP |
FW |
EW |
|
Alpha (%) |
0.51* |
0.59* |
0.63* |
|
Market Beta |
0.80* |
0.89* |
0.89* |
|
SMB Beta |
0.29* |
0.29* |
0.32* |
|
HML Beta |
0.00 |
-0.02 |
0.00 |
|
MOM Beta |
0.04* |
0.05* |
0.03 |
|
LVOL Beta |
0.18* |
0.18* |
0.16* |
|
INV Beta |
0.02 |
0.06 |
0.01 |
|
PROF Beta |
-0.02 |
-0.02 |
-0.04 |
|
R-Squared (%) |
93.72 |
94.56 |
94.45 |
|
Factor Intensity |
0.51 |
0.54 |
0.48 |
|
Relative Return/Factor Intensity (%) |
0.25 |
0.59 |
0.77 |
Note. The market factor represents the excess return of the cap-weighted benchmark over the risk-free rate. For the regression part, factor portfolios are created by providing equal weight to the top and bottom three deciles of stocks. Factor intensity is the total of all betas, excluding market beta. Relative return to factor intensity is a proportion of relative return over per unit of factor intensity. The results are based on 204 monthly return observations. (*) value corresponds to the regression coefficients (beta(s) and alpha(s)) that are significant at 5% level.
We used a seven-factor regression model to examine the role of factors in smart beta strategies (Equation 4). Table 6 demonstrates positive and statistically significant monthly alpha ranges from 0.43% and 0.74%. In particular, EW portfolios have the highest monthly alpha, generally around 0.49% to 0.74% in five out of 6 cases, with momentum being the only exception. Table 6 also provides notable insights into the assessment of factor exposures. For example, the SMB varies between 0.21 and 0.72, i. e., positive and substantial across all strategies. Also, exposure to low volatility (LVOL) is significant for the larger part of the strategies; however, the magnitude is not as extraordinary as its worth in terms of the size factor.
Moreover, our analysis extends the outcome for other strategies as well. For example, the investment strategy leads to significant INV factor loadings for RP, FW, and EW as 0.28, 0.35, and 0.35, respectively. Besides, the high profitability strategy has a significant PROF beta of 0.22, 0.33, and 0.30 for the three weighting schemes. In this way, it shows sufficient evidence on different exposures for the smart beta strategies.
Finally, we looked at the statistics of Relative Return to factor intensity, which depicts how efficiently the factor intensity is employed (Amenc et al., 2017). By comparison, EW portfolios have the highest relative return to factor intensity, with momentum being the exception. The highest relative return to factor intensity ratio indicates that the EW portfolios effectively used various factor exposures to generate excess returns. Conversely, the RP portfolios have the lowest relative return to factor intensity, implying that they are unable to efficiently bring their factor exposure.
6. Concluding Remarks
Investors in emerging markets are exposed to higher risk in comparison with the developed markets. However, increment in risk exposure prompts more chances for proficient investors in these emergent markets. Earlier studies by Salomons and Grootveld (2003), Kohers et al. (2006), and Chen (2018) found that the developed and emerging economies contrast to a certain extent, inclusive of the evolution of capital markets, regulatory framework, international diversification, integration of stock market, and others.
The criticism for market cap indices is the starting point for the development of new indexing opportunities. In pursuit of this, researchers have developed various innovative investment styles that offer outperformance over time. Evidently, smart beta as an investment philosophy has rapidly evolved in financial markets and gained popularity worldwide. Numerous studies have already been performed to determine the efficacy of smart beta strategies in developed markets, while the research on emergent markets is limited. With this gap, we conducted an empirical analysis of popular smart beta strategies to affirm their existence and potential execution in the under-researched emerging Indian stock market.
To the extent of the authors’ best information, this study is an initial attempt to integrate the framework of factor-based stock selection with the diversified weighting strategies in the Indian context. Our motivation is to assess smart beta investing as an alternative investment compared to the traditional Indian market index. As a result, we implemented six-factor exposures across three weighting schemes to proxy distinctive investment approaches and examined their return-risk characteristics. The results indicate that the smart beta strategies consistently outperformed the market benchmark in terms of higher returns, superior Shape ratio, improved information ratio, lower drawdown, better diversification, and downside protection. This analysis recommends that smart beta investing has extensively led to robust outperformance resulting in a better risk-return profile in terms of absolute and risk-adjusted basis (Amenc et al., 2014; Bender et al., 2018; Sorensen et al., 2018; Bermejo et al., 2021).
Moreover, the study provides valuable insights into the factor exposures and highlight that the profitability strategy has provided the best risk-return profile (higher returns and lower drawdown) among the other strategies analyzed. The other noteworthy point is that profitability and low volatility are strategies that report stability and robust results even in bearish market conditions. Thus, it is evident that these factor-based strategies can effectively diversify investment portfolios across different market situations.
Overall, the empirical results illustrate that the Equal Weighting (EW) approach is progressively compelling due to its potential to generate higher excess returns, superior information ratio, high and significant alpha, enhanced relative factor intensity, maximum downside protection, and better diversification. These findings, however, are consistent with other notable studies (DeMiguel et al., 2009; Chaves et al., 2011; Blitz, 2016; Malladi & Fabozzi, 2017). The results are particularly significant because most of the asset management benchmarks are focused on cap-weighting. Furthermore, EW indices also provide increased portfolio diversification by allowing for a higher percentage of investment in mid-cap or small-cap stocks.
The advantage of equal weighting is that EW indices implicitly adopt a “contrarian investment approach,” as they instinctively re-balance away from the overvalued stocks. As a result, the EW approach can withstand price fluctuations because of its simplicity, maximum diversification, and improved performance. RP weighting, however, has an essential consideration in building risk-balanced portfolios (Chaves et al., 2011). In conclusion, the findings of this study support the widely held belief that smart beta investing “reduces unrewarded risk, promotes diversification and increases risk-adjusted performance” compared to a cap-weighted market index. To summarize, the study suggests that market participants may consider the diverse range of smart beta strategies that best suit their risk appetite.
7. Implications and Future Scope
Smart beta investing is a major development in the field of index investing. In general, it provides researchers, practitioners, and investors’ communities with new investment opportunities. These novel strategies enable various market participants to access the returns and risks of a specific investment style through a more transparent and standardized investment product. Moreover, it is gaining widespread popularity for several reasons. First, implementing smart beta strategies generates value additions in terms of improved diversification, drawdown management, and the ability to conduct a better strategic allocation.
Second, this innovative strategy aims to incorporate the advantages of active and passive investment strategies. These strategies can be considered active investing because they harvest “risk premia factors” at a lower cost, and therefore, potentially result in better solutions than conventional cap-weighted indices. Simultaneously, these strategies also have the same characteristics as passive investing, most notably by their transparency and rule-based systematic approach. Third, in the asset management industry, smart beta investing helps numerous portfolio analysts and fund managers to gain exposure to a range of investment styles, thereby achieving the objective of diversification and return enhancement.
In addition, the findings of the study opened up further prospects for the policymakers, index providers, equity analysts, asset managers, and investors to target alternative investments, such as smart beta exchange-traded funds (ETF) and other diversified funds, which could potentially improve the returns. We are optimistic that this framework enhances financial research towards the viability and future advancement of smart beta strategies. It keeps growing popularity, but despite this, we advise various market participants to understand the attributes of these strategies, know about the costs associated with smart beta investing, and vigilantly consider which set of investment styles is best lined up with their investment values and goals.
For future studies, one area of research could be the adoption of smart beta investing in different asset classes and other emerging markets. Further, it is highly encouraged to investigate the risk-return analysis for different multi-factor portfolios. It would likewise be interesting to see the top-down and bottom-up approaches for constructing smart beta strategies; moreover, considering new dimensions of smart beta investing such as consolidating the ESG factor with other robust factors could be a significant and novel criterion for further research.
References
Agarwalla, S. K., Jacob, J., &Varma, J. R. (2017). Size, value, and momentum in Indian equities. Vikalpa, 42(4), 211–219. https://doi.org/10.1177/0256090917733848
Amenc, N., Ducoulombier, F., Esakia, M., Goltz, F., & Sivasubramanian, S. (2017). Accounting for Cross-Factor Interactions in Multi-factor Portfolios without Sacrificing Diversification and Risk Control. The Journal of Portfolio Management, 43(5), 99–114. https://doi.org/10.3905/jpm.2017.43.5.099
Amenc, N., Goltz, F., Lodh, A.,& Martellini, L. (2014). Towards Smart Equity Factor Indices: Harvesting Risk Premia without Taking Unrewarded Risks. The Journal of Portfolio Management, 40(4), 106–122. https://doi.org/10.3905/jpm.2014.40.4.106
Amihud, Y. (2002). Illiquidity and stock returns: cross-section and time-series effects. Journal of Financial Markets, 5(1), 31–56. https://doi.org/10.1016/S1386-4181(01)00024-6
Ang, A., Goetzmann, W. N., & Schaefer, S. (2009). Evaluation of Active Management of the Norwegian Government Pension Fund–Global. Retrieved from: https://www0.gsb.columbia.edu/faculty/aang/papers/report%20Norway.pdf
Angelidis, T., &Tessaromatis, N. (2017). Global Equity Country Allocation: An Application of Factor Investing. Financial Analysts Journal, 73(4), 55–73. https://doi.org/10.2469/faj.v73.n4.7
Arnott, R. D., &Kose, E. (2014). What “Smart Beta” Means to Us. Research Affiliates Fundamentals, 61–74. Retrieved from: https://www.researchaffiliates.com/en_us/publications/articles/292_what_smart_beta_means_to_us.html.
Arnott, R. D., &Hsu, J. (2008). Noise, CAPM and the Size and Value Effects. Journal of Investment Management, 6(1), 1–11. Available at: https://www.researchaffiliates.com/documents/JOIM_First_Quarter_2008_Noise_CAPM_and_the_Size_and_Value_Effects.pdf
Baker, M., Bradley, B., &Wurgler, J. (2011). Benchmarks as limits to arbitrage: Understanding the low-volatility anomaly. Financial Analysts Journal, 67(1), 40–54. https://doi.org/10.2469/faj.v67.n1.4
Banz, R. W. (1981). The relationship between return and market value of common stocks. Journal of Financial Economics, 9(1), 3–18. https://doi.org/10.1016/0304-405X(81)90018-0
Basu, S. (1977). Investment Performance of Common Stocks in Relation to their Price‐Earnings Ratios: A Test of the Efficient Market Hypothesis. The Journal of Finance, 32(3), 663–682. https://doi.org/10.1111/j.1540-6261.1977.tb01979.x
Bender, J., Sun, X., Thomas, R., &Zdorovtsov, V. (2018).The promises and pitfalls of factor timing. The Journal of Portfolio Management, 44(4), 79–92. https://doi.org/10.3905/jpm.2018.44.4.079
Bender, J., & Wang, T. (2015). Tilted and Anti-Tilted Portfolios: A Coherent Framework for Advanced Beta Portfolio Construction. The Journal of Index Investing, 6(1), 51–64. https://doi.org/10.3905/jii.2015.6.1.051
Bermejo, R., Figuerola-Ferretti, I., Hevia, T., & Santos, A. (2021). Factor investing: A stock selection methodology for the European equity market. Heliyon, e08168. https://doi.org/10.1016/j.heliyon.2021.e08168
BlackRock. Factor-based investing. Retrieved from: https://www.blackrock.com/institutions/en-au/investment-capabilities-and-solutions/smart-beta
Blitz, D. (2016). Factor investing with smart beta indices. The Journal of Index Investing, 7(3), 43–48. https://doi.org/10.3905/jii.2016.7.3.043
Blitz, D. C., &Van Vliet, P. (2007). The Volatility Effect. The Journal of Portfolio Management, 34(1), 102–113. https://doi.org/10.3905/jpm.2007.698039
Bloomberg (2021). Retrieved from: https://www.bloomberg.com/news/articles/2021-10-11/roaring-india-stock-market-on-track-to-overtake-u-k-s-in-value
Cakici, N., Fabozzi, F. J., & Tan, S. (2013). Size, value, and momentum in emerging market stock returns. Emerging Markets Review, 16, 46–65. https://doi.org/10.1016/j.ememar.2013.03.001
Centineo, S., &Centineo, S. (2017). Investment innovation trends: Factor-based investing. Serbian Journal of Management, 12(1), 65–75. https://doi.org/10.5937/sjm12-10764
Chan, K. C., & Chen, N. F. (1991). Structural and return characteristics of small and large firms. The Journal of Finance, 46(4), 1467–1484. https://doi.org/10.1111/j.1540-6261.1991.tb04626.x
Chan, L. K., Hamao, Y., & Lakonishok, J. (1991). Fundamentals and Stock Returns in Japan. The Journal of Finance, 46(5), 1739–1764. https://doi.org/10.1111/j.1540-6261.1991.tb04642.x
Chaves, D., Hsu, J., Li, F., & Shakernia, O. (2011). Risk parity portfolio vs. other asset allocation heuristic portfolios. The Journal of Investing, 20(1), 108–118. https://doi.org/10.3905/joi.2011.20.1.108
Chen, P. (2018). Understanding international stock market comovements: A comparison of developed and emerging markets. International Review of Economics & Finance, 56, 451–464. https://doi.org/10.1016/j.iref.2017.12.004
Dasgupta, A., Prat, A., & Verardo, M. (2011). The price impact of institutional herding. The Review of Financial Studies, 24(3), 892–925. https://doi.org/10.1093/rfs/hhq137
DeMiguel, V., Garlappi, L., & Uppal, R. (2009). Optimal versus naive diversification: How inefficient is the 1/N portfolio strategy? The Review of Financial Studies, 22(5), 1915–1953. https://doi.org/10.1093/rfs/hhm075
Fama, E. F., & French, K. R. (1993). Common risk factors in the returns on stocks and bonds. Journal of Financial Economics, 33(1), 3–56. https://doi.org/10.1016/0304-405X(93)90023-5
Fama, E. F., & French, K. R. (1996). Multi-factor explanations of asset pricing anomalies. The Journal of Finance, 51(1), 55–84. https://doi.org/10.1111/j.1540-6261.1996.tb05202.x
Fama, E. F., & French, K. R. (2012). Size, value, and momentum in international stock returns. Journal of Financial Economics, 105(3 ), 457–472. https://doi.org/10.1016/j.jfineco.2012.05.011
Fama, E. F., & French, K. R. (2015). A five-factor asset pricing model. Journal of Financial Economics, 116(1), 1–22. https://doi.org/10.1016/j.jfineco.2014.10.010
Ferson, W. E., Kandel, S. & Stambaugh, R. F. (1987). Tests of Asset Pricing with Time-Varying Expected Risk Premiums and Market Betas. The Journal of Finance, 42(2), 201–220. https://doi.org/10.1111/j.1540-6261.1987.tb02564.x
Frazzini, A., & Pedersen, L. H. (2014). Betting against beta. Journal of Financial Economics, 111(1), 1–25. https://doi.org/10.1016/j.jfineco.2013.10.005
Fuller, K. P., & Goldstein, M. A. (2011). Do dividends matter more in declining markets?. Journal of Corporate Finance, 17(3), 457–473. https://doi.org/10.1016/j.jcorpfin.2011.01.001
Goetzmann, W. N., Li, L., & Rouwenhorst, K. G. (2005). Long-Term Global Market Correlations.The Journal of Business, 78(1), 1–38. http://dx.doi.org/10.1086/426518
Grinold, R. (1992). Are Benchmark Portfolios Efficient? The Journal of Portfolio Management, 19(1), 34–40. https://doi.org/10.3905/jpm.1992.34
Hanauer, M. X., & Linhart, M. (2015). Size, value, and momentum in emerging market stock returns: Integrated or segmented pricing?. Asia‐Pacific Journal of Financial Studies, 44(2), 175–214.https://doi.org/10.1111/ajfs.12086
Haugen, R. A., & Baker, N. L. (1991). The efficient market inefficiency of capitalization-weighted stock portfolios. The Journal of Portfolio Management, 17(3), 35–40. https://doi.org/10.3905/jpm.1991.409335
Hilliard, J., & Zhang, H. (2015). Size and price-to-book effects: Evidence from the Chinese stock markets. Pacific-Basin Finance Journal, 32, 40-55. https://doi.org/10.1016/j.pacfin.2015.02.003
Hong, H., Lim, T., & Stein, J. C. (2000). Bad news travels slowly: Size, analyst coverage, and the profitability of momentum strategies. The Journal of Finance, 55(1), 265–295. https://doi.org/10.1111/0022-1082.00206
Hou, K., Xue, C., & Zhang, L. (2015). Digesting anomalies: An investment approach. The Review of Financial Studies, 28(3), 650–705. https://doi.org/10.1093/rfs/hhu068
Hsu, J. C. (2006). Cap-weighted portfolios are sub-optimal portfolios. Journal of Investment Management, 4(3), 1–10. Retrieved from: https://www.researchaffiliates.com/documents/JOIM_Third_Quarter_2006_Cap-Weighted_Portfolios_are_Sub-Optimal_Portfolios.pdf
Hsu, J., Kalesnik, V., & Viswanathan, V. (2015). A Framework for Assessing Factors and Implementing Smart Beta Strategies. The Journal of Index Investing, 6(1), 89–97. https://doi.org/10.3905/jii.2015.6.1.089
Hu, G. X., Chen, C., Shao, Y., & Wang, J. (2019). Fama–French in China: Size and value factors in Chinese stock returns. International Review of Finance, 19(1), 3–44. https://doi.org/10.1111/irfi.12177
Jacobs, B. I., & Levy, K. N. (2014). Smart Beta versus Smart Alpha. The Journal of Portfolio Management, 40(4), 4–7. https://doi.org/10.3905/jpm.2014.40.4.004
Jegadeesh, N., & Titman, S. (1993). Returns to Buying Winners and Selling Losers: Implications for Stock Market Efficiency. The Journal of Finance, 48(1), 65–91. https://doi.org/10.1111/j.1540-6261.1993.tb04702.x
Kahn, R. N., & Lemmon, M. (2016). The Asset Manager’s Dilemma: How Smart Beta Is Disrupting the Investment Management Industry. Financial Analysts Journal, 72(1), 15–20. https://doi.org/10.2469/faj.v72.n1.1
Kim, S. (2021). Enhanced factor investing in the Korean stock market. Pacific-Basin Finance Journal, 67, 101558. https://doi.org/10.1016/j.pacfin.2021.101558
Kohers, G., Kohers, N., & Kohers, T. (2006). The risk and return characteristics of developed and emerging stock markets: The recent evidence. Applied Economics Letters, 13(11), 737–743. https://doi.org/10.1080/13504850500407210
Kudoh, H., Miazzi, A., & Yamada, T. (2015). The Low-Correlation Enhancement: How to Make Alternative Beta Smarter. The Journal of Investing, 24(4), 81–91. https://doi.org/10.3905/joi.2015.24.4.081
Lakonishok, J., Shleifer, A., & Vishny, R. W. (1994). Contrarian investment, extrapolation, and risk. The Journal of Finance, 49(5), 1541–1578. https://doi.org/10.1111/j.1540-6261.1994.tb04772.x
Li, D., & Zhang, L. (2010). Does q-theory with investment frictions explain anomalies in the cross section of returns?. Journal of Financial Economics, 98(2), 297–314. https://doi.org/10.1016/j.jfineco.2010.06.001
Malevergne, Y., Santa-Clara, P., & Sornette, D. (2009). Professor Zipf Goes to Wall Street. NBER Working Paper, National Bureau of Economic Research. https://doi.org/10.3386/w15295
Malladi, R., & Fabozzi, F. J. (2017). Equal-weighted strategy: Why it outperforms value-weighted strategies? Theory and evidence. Journal of Asset Management, 18(3), 188–208. 10.1057/s41260-016-0033-4
Markowitz, H. (1952). Portfolio Selection. The Journal of Finance, 7(1), 77–91. https://doi.org/10.1111/j.1540-6261.1952.tb01525.x
Martellini, L. & Milhau, V. (2018). Smart Beta and Beyond: Maximising the Benefits of Factor Investing. Available at: https://risk.edhec.edu/sites/risk/files/edhec_publication_smart_beta_and_beyond_1.pdf
Monga, R., Aggrawal, D., & Singh, J. (2021). Exploring new frontiers in indexing strategies: an optimization-based risk-efficient solution. International Journal of System Assurance Engineering and Management, 1–13. https://doi.org/10.1007/s13198-021-01138-3
Novy-Marx, R. (2013). The other side of value: The gross profitability premium. Journal of Financial Economics, 108(1), 1–28. https://doi.org/10.1016/j.jfineco.2013.01.003
Qian, E. (2015). On the Holy Grail of “Upside Participation and Downside Protection”. The Journal of Portfolio Management, 41(2), 11–22. https://doi.org/10.3905/jpm.2015.41.2.011
Russo, A. (2014).Understanding Smart Beta: Beyond Diversification and Low Risk Investing. Available at: https://silo.tips/download/understanding-smart-beta-beyond-diversification-and-low-risk-investing
Salomons, R., & Grootveld, H. (2003). The equity risk premium: Emerging vs. developed markets. Emerging Markets Review, 4(2), 121–144. https://doi.org/10.1016/S1566-0141(03)00024-4
Silvasti, V., Grobys, K., & Äijö, J. (2021). Is smart beta investing profitable? Evidence from the Nordic stock market. Applied Economics, 53(16), 1826–1839. https://doi.org/10.1080/00036846.2020.1853669
Sorensen, E., Barnes, M., Alonso, N., & Qian, E. (2018). Not All Factor Exposures Are Created Equal. The Journal of Portfolio Management, 44(4), 39–45. https://doi.org/10.3905/jpm.2018.44.4.039
Treynor, J. (2005). Why Market-Valuation-Indifferent Indexing Works. Financial Analysts Journal, 61(5), 65–69. https://doi.org/10.2469/faj.v61.n5.2757
World Bank (2021). Retrieved from: https://www.worldbank.org/en/country/india
Zhang, L. (2005). The value premium. The Journal of Finance, 60(1), 67–103. https://doi.org/10.1111/j.1540-6261.2005.00725.x
Zhang, X. F. (2006). Information uncertainty and stock returns. The Journal of Finance, 61(1), 105–137. https://doi.org/10.1111/j.1540-6261.2006.00831.x
Appendix 1
Description of the Measures