Organizations and Markets in Emerging Economies ISSN 2029-4581 eISSN 2345-0037
2022, vol. 13, no. 1(25), pp. 96–116 DOI: https://doi.org/10.15388/omee.2022.13.72
The Relationship Between White Ocean Strategy, Customer Value, and Customer Engagement
Sri Hartini (corresponding author)
Airlangga University, Indonesia
https://orcid.org/0000-0001-7447-5154
sri-hartini@feb.unair.ac.id
Masmira Kurniawati
Universitas Airlangga, Indonesia
https://orcid.org/0000-0002-9585-8135
masmira-k@feb.unair.ac.id
Jovi Sulistiawan
Universitas Airlangga, Indonesia
https://orcid.org/0000-0001-9910-3461
jovisulistiawan@feb.unair.ac.id
Muhammad Ihwanudin
Universitas Airlangga, Indonesia
https://orcid.org/0000-0003-4074-1295
m.ihwanudin@alumni.unair.ac.id
Abstract. White Ocean Strategy (WOS) has a positive impact on the company. However, many companies have not implemented this strategy. There is a research gap between customer value and customer engagement (CE). This research explains that customer value is an antecedent of CE. However, some studies discuss that customer value is a consequence of CE. This study aims to explain the relationship of WOS, customer value, and CE. This research is quantitative explanatory research and used accidental sampling to obtain the samples. The survey was conducted online with Google Forms distributed on social media and obtained 220 respondents who are users of the Surabaya bus services. The hypotheses were tested using the SEM-PLS. Seven hypotheses were accepted, while other two were rejected. It was found that WOS increases CE, customer green value, functional value, and emotional value. Nevertheless, it does not significantly affect customer social value. The customers’ green, functional, and emotional values impact CE, while social customer values do not affect CE. The contribution of this study is to clarify the research gap of the relationship between customer value and CE. This study supports previous research that discusses customer value as an antecedent variable for CE.
Keywords: White Ocean Strategy (WOS), Customer Engagement (CE), functional value, emotional value, green value, social value
Received: 10/10/2021. Accepted: 21/12/2021
Copyright © 2022 Sri Hartini , Masmira Kurniawati, Jovi Sulistiawan, Muhammad Ihwanudin. Published by Vilnius University Press. This is an Open Access article distributed under the terms of the Creative Commons Attribution Licence, which permits unrestricted use, distribution, and reproduction in any medium, provided the original author and source are credited.
Introduction
In the global market, business competition requires companies to develop strategies to gain a competitive advantage. Customers’ attention to the environment is getting higher, and customers prefer companies that care about the environment. White Ocean Strategy (WOS) is a business strategy that uses environmental concerns to create a competitive advantage. WOS focuses on company activities that care about the social and natural environment. This strategy carries out Corporate Social Responsibility (CSR) activities in a sustainable manner (Aithal, 2016), which focuses on People, Planet, Profit, and Passion (Chanchaochai, 2012). WOS is considered a viable choice for companies to balance people, planet, and profit with a passion for doing good.
CSR activities, such as caring for people and the earth, will increase customer loyalty (Gunawan et al., 2020), customer value perceptions, competitive advantage (Hartini et al., 2021), and financial performance (Ramzan et al., 2021). As a responsibility to environmental issues, philanthropy determines customers’ emotional, functional, and social values (Green & Peloza, 2011). WOS increases the customer’s emotional and social value (Hartini et al., 2021). Emotional value arises from the customer’s pride when involved in environmental care activities carried out by the company. Social value arises because customers feel that society views customers as intelligent and wise individuals. Companies that implement WOS produce environmentally friendly products. Customers perceive a higher functional value because the product does not harm themselves and the environment (Green & Peloza, 2011; Hartini et al., 2021). Customer perceived value can affect Customer Engagement (CE). CE includes customer purchases, customer referrals, customer social influence, and customer knowledge sharing (Pansari & Kumar, 2017). The higher the value perceived by the customer, the higher emotional bond of the customer with the product and more effective word of mouth (Itani et al., 2019; Sukaris et al., 2019).
There is a research gap between customer value and CE. Jakkola, Elina and Alexander (2014) found that CE is an antecedent variable of value co-creation, which will enhance the company’s offering. CE determines customer value (Hollebeek, 2013; Zhang et al., 2017). Several studies have a different opinion that CE is a consequence variable of customer value. It has significantly affected CE (Itani et al., 2019) and CE behaviour on social media (Carlson et al., 2018). Rather et al. (2018) found that customer value determines CE. Terason et al. (2021), in their research on the automobile business, found that customer value has a positive effect on CE. Ngo et al. (2019), in their study of restaurants in Vietnam, found that customer value affects CE. However, there is a research gap of the relationship between customer value and CE. Some studies put CE as an antecedent variable of customer value.
Conversely, many studies place CE as a consequence variable of customer value. Previous studies have proven that the company’s concern for the environment positively affects perceived customer value (Hartini et al., 2021, Green & Peloza, 2011). On the other hand, few companies still care about the environment (Awaliyah & Maharani, 2019). In his study, Suki (2016b) proves that customer environmental knowledge does not affect Malaysia’s green food purchasing decisions. This study aims to explain the relationship between WOS, customer value, and CE. The contribution of this study is to explain the research gap between customer value and CE. The study results show that this research supports customer value as an antecedent variable of CE (Itani et al., 2019; Carlson et al., 2018; Rather et al., 2018; Terason et al., 2021; Ngo et al., 2019).
1. Theoretical Background and Hypotheses
1.1 White ocean strategy
According to Chanchaochai (2012), WOS is a strategy to manage the company by applying environmental concerns to create a competitive advantage. This strategy requires the company’s business to uphold moral values and benefit the environment. This strategy can be applied in various situations, helping to strengthen the company’s position and increase competitiveness with a high moral image. WOS is a strategy that focuses on People, Planet, Profit, and Passion (Chanchaochai, 2012). People means that the company is oriented towards the social environment, welfare, and the sustainability of human resources. Planet means the company focuses on preserving the natural environment by making environmentally friendly products. Also, profit means the company remains profit-oriented. Passion is controlling emotions and passion for doing business by balancing people, planet, and profit. Concern for the environment can generate maximum profit and increase the company’s reputation (Gunawan et al., 2020). The resulting product will attract public interest because it provides green, emotional, and social added value (Green & Peloza, 2011).
According to Chanchaochai (2012), WOS is a company management approach based on ethics and morals that will create organizational transparency. Businesses that implement WOS are concerned about honesty, sincerity, morality, customer justice, sharing with others, and other social characteristics. Business ethics is a reference for conducting business activities, including aspects of individuals, institutions, policies, and business behavior. Ethical business behavior impacts the company’s performance in the long term. WOS is a business strategy that prioritizes ethics and morals in the company’s business activities (Hartini et al., 2017). Some of the principles of implementing WOS that companies can apply are: 1) The existence of a company must have a positive impact on the community; 2) Setting long term goals; 3) Finding a balance between people, planet, profit, and passion factors; 4) Maintaining the company concept by preserving natural resources for the common welfare; 5) Establishing a company based on ethics, truth, and sincerity; 6) Companies gaining strength from within themselves through individual social responsibility, and 7) Determining the benchmark for WOS success in the business sector. WOS determines customer social value and customer emotional value (Hartini et al., 2021). Customer perceived CSR positively impacts CE (Abbas et al., 2018; Agyei et al., 2021). WOS variable is measured from customers’ perspective so that WOS is seen from the company’s responsibility towards nature and society. In this study, WOS is a company’s responsibility to the environment as a whole, which includes the natural environment and the social environment (Chanchaochai, 2012; Aithal, 2016).
1.2 Customer perceived value
All marketing decisions are based on the value of the customer. Gummerus (2013) and Khalifa (2004) discovered that customer value is a complicated, context-specific phenomenon that still deserves attention from academics. In the marketing literature, customer perceived value is examined in two ways: as a ratio between the value received by the customer and the cost incurred when purchasing or using a service or product (Petrick, 2002; Wang et al., 2004; Smith & Colgate, 2007). Perceived value is the customer’s overall assessment of the product utility of what is received and what is given. Customer perceived value consists of salient intrinsic attributes, extrinsic attributes, perceived quality, and relevant high-level abstractions. The sacrifice components of perceived value include monetary prices and non-monetary prices (Zeithaml, 1988). The Customer Value Hierarchy Model discusses customer value at three levels: attribute performance, consequences in use situations, customer’s goals and purposes. Customer value is a customer’s perceived preference for evaluating those product attributes, performances, and consequences arising from use that facilitate and achieve the customer’s goals and purposes in use situations (Woodruff, 1997).
Customer perceived value as a multi-dimensional construct incorporates various customer perceived value dimensions (e. g., Sweeney & Soutar, 2001; Smith & Colgate, 2007; Park & Ha, 2016). According to Sukaris et al. (2019), their study of adventure tourism distinguishes between epistemic and emotional value. Meanwhile, Williams et al. (2017) segments a customer’s perceived value into functional value, price value for money, emotional value, social value, and novelty value. Yang et al. (2016) identified five value measures: quality value, emotional value, social value, price value, and experiential value. It is related to the environment and implementing CSR (Green & Peloza, 2011; Hartini et al., 2021) using emotional, social, and functional values. Xia et al. (2019), in their study on purchasing green products, used three customers’ perceived values: green value, functional value, and social value. Yu and Lee (2019) used two customer-perceived values, which are green value and functional value. Bielawska and Grębosz-Krawczyk (2021) studied customers’ functional, social, emotional, green, epistemic, and conditional value in purchasing green clothing products.
Customer perceived value consists of green, functional, social, and emotional values (Hartini et al., 2021; Green & Peloza, 2011; Yu & Lee, 2019). WOS will increase customers’ emotional and social value (Hartini et al., 2021). The company’s philanthropic activities determine its emotional and social value. Environmentally friendly products will determine the customer’s functional value (Green & Peloza, 2011). According to Servera-Francés and Piqueras-Tomás (2019), companies implementing sustainable CSR will increase customer perceived value.
1.3 Green value
Green value is a customer’s overall assessment of a product or service that has perceived benefits. What is received and what the customer provides is based on the customer’s environmental desires, sustainable expectations, and environmentally friendly needs (Wei & Jung, 2017). Green value, also often referred to as ecological value, represents the usefulness of a product or service based on its positive impact on the environment (Suki, 2016a). The green value defines the benefits of products for the environment and the social impact of environmentally friendly products (Yu & Lee, 2019).
Human nature as a social being has a concern for the environment. Customers with higher altruism will look for products with high green value. At the same time, WOS will increase customer perceived green value. Green value is the benefit for the environment that customers feel when consuming a product. Servera-Francés and Piqueras-Tomás (2019) found that companies that take sustainable care for nature and society and behave ethically will create customer perceived value.
1.4 Functional value
Functional value is the perceived utility obtained from the specific attributes of a product or service. The essential functional attributes include price, reliability, and durability (Sheth et al., 1991). Meanwhile, Yu and Lee (2019) state that functional value is the customer’s perception of the product’s physical, functional, and utilitarian performance. In the implementation of WOS, companies that care about the environment will make environmentally friendly products. These products will increase functional customer value because of the environmentally friendly attributes attached to the product (Green & Peloza, 2011).
1.5 Social value
Social value is the customer’s perspective on the environment. When customers consume environmentally friendly products, the environment will accept them well. It is because customers have been concerned about environmental sustainability (Green & Peloza, 2011). When customers buy products or services that are environmentally friendly, they will feel accepted by their social environment. They are considered wise and caring people by consuming these products. Hence, the white ocean strategy increases the social value of customers (Hartini et al., 2021).
1.6 Emotional value
Emotional value is the feeling of pleasure that customers feel because they participate in environmental activities. Customers feel proud of themselves by buying environmentally friendly products. They feel happy to help the environment and feel smart because they buy environmentally friendly products. Corporate philanthropy influences emotional and social values (Green & Peloza, 2011). WOS influences emotional and social values (Hartini et al., 2021).
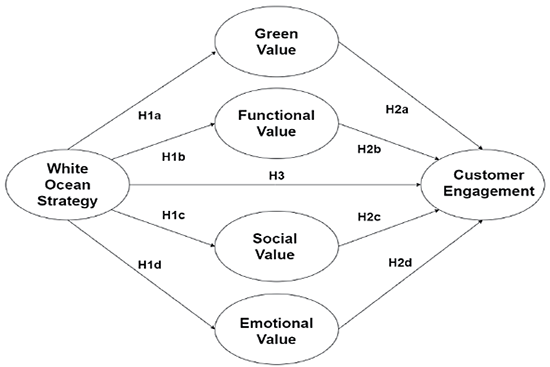
The companies that implement WOS will pay attention to community welfare and care about environmental problems. Implementing CSR in the company reflects the WOS (Chanchaochai, 2012; Aithal,2016). Philanthropy is one form of CSR activity (Kotler & Lee, 2008). Green and Peloza (2011) found that philanthropic activities will increase customer perceived emotional and social value. Customer perceived value related to environmentally friendly products consists of functional value, green value, social value, and emotional value (Green & Peloza, 2011; Pansari & Kumar, 2017; Yu & Lee, 2019). WOS influences customers’ social and emotional value (Hartini et al., 2021). Accordingly, this study proposes the following hypotheses:
H1a. White ocean strategy positively affects customer perceived green value.
H1b. White ocean strategy positively affects customer perceived functional value.
H1c. White ocean strategy positively affects customer perceived social value.
H1d. White ocean strategy positively affects customer perceived emotional value.
1.7 Customer engagement
According to Bowden (2009), CE is a psychological process that underlies new customer loyalty and maintains loyalty for customers who repurchase a brand. According to Tripathi (2009), CE is a process of protecting, nurturing and developing consumers to stay connected with the company. According to Brodie et al. (2011), CE is a psychological process resulting from an interactive and co-creative customer experience with a focal object (e.g., a brand) in a service-focused relationship. Many concepts associated with CE include engagement, participation, flow, rapport, satisfaction, commitment, trust, self-brand connection, emotional brand attachment, and loyalty (Brodie et al., 2011). Hollebeek (2011) defines the level of motivation, brand, and context-dependent state of mind of an individual customer based on cognitive, emotional, and behavioural aspects.
Previous research has suggested that CE has a wide range of valence (positive vs negative) and intensity (high vs low) (Dessart et al., 2015; Malthouse et al., 2013). CE reflects the interactive customer’s relationship with particular context-specific objects. CE is the emotional and cognitive engagement of customers with the product. When customers are emotionally and cognitively connected to a brand, they become more concerned and like it (Frost & Strauss, 2016). From the customer’s point of view, CE represents the level of cognitive, emotional, and behavioural involvement with the brand (Hollebeek, 2011; Piligrimienė et al., 2020). CE as a second-order construct consists of four dimensions: customer purchases, customer referrals, social influence, and knowledge sharing (Kumar & Pansari, 2016). CE is the level of customer involvement physically, cognitively, and emotionally in company relationships (So et al., 2016). Pansari and Kumar (2017) describe CE with two dimensions (matrix): emotion and satisfaction. From a business perspective, CE marketing refers to a company’s purposeful efforts to encourage, empower, and value a customer’s voluntary commitment to its marketing operations outside of key economic transactions (Harmeling et al., 2017).
The definition of CE has mostly used the customer’s physical, cognitive, and emotional relationship with the organization, product, or brand. CE reflects a customer’s interactive relationship with a specific object. Some academics have suggested that the number of dimensions for measuring customer engagement is determined by a one-dimensional or multi-dimensional construct (Piligrimienė et al., 2020). For example, viewing customer engagement is a one-dimensional concept beyond purchase, participation, and engagement (Dolan et al., 2019; Piligrimienė et al., 2020). In the one-dimensional approach, specific dimensions are identified as the most important ones. Usually, it is defined differently by different authors (Piligrimienė et al., 2020). However, the dominant multi-dimensional approach often involves three main dimensions: cognitive, emotional, and behavioural (Piligrimienė et al., 2020). Indicators widely used to measure CE include repeat purchases, customer referrals, participation, satisfaction, commitment, trust, self-brand connection, and emotional brand attachment.
Jaakkola and Alexander (2014) found that CE is an antecedent variable of customer co-creation value that could increase the company’s bargaining power and determine customer value (Hollebeek, 2013; Zhang et al., 2017). On the other hand, many studies prove CE as a consequence variable of customer value. Customer hedonic and entitativity value positively affect CE behaviour on social media (Carlson et al., 2018). Rather et al. (2018) found that customer value determines CE. Terason et al. (2021), in their research on the Automotive business, found that customer value has a positive effect on CE. Ngo et al. (2019), in their study of restaurants in Vietnam, found that customer value influences CE. The higher the value perceived by the customer, the higher the customer’s intention to do word of mouth (Sukaris et al., 2019; Hartini et al., 2020).
High customer perceived value increases customer satisfaction. This high value makes customers think that the product is the best. Customers will make referrals and reuse the product. According to Itani et al. (2019), customer perceived value influences CE. Meanwhile, Green and Peloza (2011) stated that the customer’s perceived value consists of functional, emotional, and social value that influence marketing outcomes such as loyalty, referral behaviour, and willingness to pay. The perceived value of customers regarding environmentally friendly products consists of functional value, green value, social value, and emotional value (Green & Peloza, 2011; Pansari & Kumar, 2017; Yu & Lee, 2019). Accordingly, this study formulates the following hypotheses:
H2a. Customer perceived green value positively affects customer engagement.
H2b. Customer perceived functional value positively affects customer engagement
H2c. Customer perceived social value positively affects customer engagement.
H2d. Customer perceived emotional value positively affects customer engagement.
CSR implementation is a reflective form of WOS (Chanchaochai, 2012). Companies with WOS focus on activities that care about the social and natural environment. These environmental care activities have been implemented since the company was founded and are sustainable (Aithal, 2016). Philanthropy is one example of CSR activities (Kotler & Lee, 2008). Philanthropic activities will increase marketing outcomes (Green & Peloza, 2011). According to Gunawan et al. (2020), the authenticity of the company’s CSR activities affects the company’s credibility and customer loyalty. CSR perceived by customers positively impacts CE (Abbas et al., 2018; Agyei et al., 2021). Therefore, this study hypothesizes:
H3. White ocean strategy positively affects customer engagement.
Based on the theoretical background and hypotheses development, Figure 1 presents the proposed research model.
Figure 1
Conceptual Research Model
2. Methodology
2.1 Sampling method
The population of the study is Surabaya bus users. This study used an accidental sampling technique, with online questionnaires distributed via Google Forms on social media such as Instagram, Twitter, and Facebook. Initially, respondents were asked screening questions to confirm their appropriateness and suitability, and the quality of the data acquired. The respondents were users of the Surabaya bus who had used the service in the past month. Thus, they recall the service experience. As a result, 220 samples were obtained. To test the hypotheses, SEM-PLS was used in conjunction with the SmartPLS v.3.2.9. This study used Surabaya bus because it is one of Surabaya’s public transportation services that use WOS. This service contributes to the campaign to address social and environmental issues. Surabaya buses are said to be capable of addressing societal problems. This service is anticipated to minimize the usage of private automobiles, reduce traffic congestion and plastic waste on the natural environment because to get on Surabaya bus, people must pay the ticket with plastic trash.
2.2 Measurement
This research is a quantitative explanatory study, which examines the relationship between White Ocean Strategy (WOS), green value, functional value, social value, emotional value, and customer engagement (CE). Variables were measured using a Likert scale by modifying the measurement items according to the research objectives. WOS in this study is a customer perspective about WOS of the Surabaya bus that cares for the natural and social environment. WOS consists of four items (Chanchaochai, 2012; Aithal, 2016). Functional value is customers’ benefits from the Surabaya bus service, and this variable is measured by three items (Yu & Lee, 2019). The green value is the benefit to the environment from using the Surabaya bus that customers feel. Green value is measured by three items (Yu & Lee, 2019). Emotional value is customers’ emotional benefits from Surabaya bus services and is measured by three items (Yu & Lee, 2019). Social value is the social benefit felt by customers from Surabaya bus services. Finally, CE is the cognitive, emotional, and behavioural interaction with the Surabaya bus. This variable is measured by six items (Itani et al., 2019; Piligrimienė et al., 2020).
3. Data analysis and result
3.1 Demographic analysis
Table 1 describes the demographic characteristics of the respondents.
Table 1
Respondents’ Demographic Characteristics (N=220)
|
Items |
N |
Percentage |
|
|
Gender |
Female |
107 |
48.6 |
|
Male |
113 |
51.4 |
|
|
Age |
19-23 years old |
164 |
74.5 |
|
24-28 years old |
35 |
15.9 |
|
|
29-33 years old |
8 |
3.6 |
|
|
34-38 years old |
3 |
1.4 |
|
|
39-43 years old |
4 |
1.8 |
|
|
44-48 years old |
5 |
2.3 |
|
|
49-53 years old |
1 |
0.5 |
|
|
Education |
Senior High School |
132 |
60.0 |
|
Diploma |
8 |
3.6 |
|
|
Bachelor’s degree |
66 |
30.0 |
|
|
Master’s degree |
14 |
6.4 |
|
|
Job |
Student |
142 |
64.5 |
|
Entrepreneur |
26 |
11.8 |
|
|
Public servant |
35 |
15.9 |
|
|
Professional |
8 |
3.6 |
|
|
Housewife |
6 |
2.7 |
|
|
Unemployed |
3 |
1.4 |
|
|
Income per month |
< Rp 999,999 |
115 |
52.3 |
|
Rp 1,000,000 - Rp 2,999,999 |
70 |
31.8 |
|
|
Rp 3,000,000 - Rp 4,999,999 |
15 |
6.8 |
|
|
Rp 5,000,000 - Rp 9,999,999 |
17 |
7.7 |
|
|
> Rp 10,000,000 |
3 |
1.4 |
|
The total number of respondents who answered the questionnaires was 220. Regarding gender, the numbers in the sample were relatively equal, with 51.4% of male and 48.6% of female population. According to age, the group of 19-23 years dominated (74.5%). It shows that most of the respondents belong to Generation Z. Then, at the level of education, respondents with a high school background dominate (60%). With regard to the type of work, students made up the largest proportion (64.5%) in the sample. Moreover, respondents with a monthly income of less than Rp 999,999 dominate (52.3%). Based on the results above, users of the Surabaya bus service are dominated by Generation Z and characterized by a relatively high level of education, which affects knowledge, awareness, and selective use of a product or service.
3.2 Measurement model assessment
Table 2 describes the CFA test result of the SEM-PLS research instrument.
Table 2
Reliability, Validity, and Iternal Consistency Results
|
|
Mean |
σ |
λ |
α |
CR |
AVE |
|
WOS1 |
4.695 |
0.669 |
0.761 |
0.865 |
0.909 |
0.714 |
|
WOS2 |
4.455 |
0.746 |
0.876 |
|||
|
WOS3 |
4.482 |
0.677 |
0.876 |
|||
|
WOS4 |
4.436 |
0.751 |
0.862 |
|||
|
CGV1 |
4.364 |
0.760 |
0.895 |
0.879 |
0.925 |
0.805 |
|
CGV2 |
4.423 |
0.700 |
0.920 |
|||
|
CGV3 |
4.409 |
0.778 |
0.875 |
|||
|
CFV1 |
4.364 |
0.927 |
0.840 |
0.847 |
0.908 |
0.766 |
|
CFV2 |
4.573 |
0.744 |
0.902 |
|||
|
CFV3 |
4.386 |
0.751 |
0.883 |
|||
|
CSV1 |
4.245 |
0.735 |
0.792 |
0.765 |
0.859 |
0.671 |
|
CSV2 |
4.227 |
0.709 |
0.807 |
|||
|
CSV3 |
4.114 |
0.714 |
0.857 |
|||
|
CEV1 |
4.277 |
0.864 |
0.839 |
0.757 |
0.859 |
0.671 |
|
CEV2 |
3.791 |
1.325 |
0.763 |
|||
|
CEV3 |
3.723 |
1.206 |
0.852 |
|||
|
CE1 |
4.309 |
0.806 |
0.640 |
0.832 |
0.877 |
0.545 |
|
CE2 |
4.486 |
0.697 |
0.766 |
|||
|
CE3 |
4.541 |
0.740 |
0.747 |
|||
|
CE4 |
4.205 |
0.948 |
0.728 |
|||
|
CE5 |
4.164 |
0.934 |
0.810 |
|||
|
CE6 |
4.045 |
0.990 |
0.729 |
Note. σ = standard deviation; λ = factor loadings; α = cronbach’s alpha; CR = composite reliability; AVE = average variance extracted.
The loading factor (λ) is 0.640 to 0.920, and all values are more than 0.50 (Malhotra, 2015). It shows that all items are valid. Cronbach’s alpha (α) is 0.757 to 0.879, and composite reliability (CR) is 0.859 to 0.925, which is more than 0.70 so that it meets internal consistency (Ghozali & Latan, 2015; Hair et al., 2011). Finally, the Rho_A reliability coefficient values are all above 0.70, according to the suggestion of Dijkstra and Henseler (2015). Convergent and discriminant validity were also evaluated for construct validity. The mean extracted variance (AVE) was used to assess convergent validity. The AVE is more than 0.50, as seen in Table 2. It establishes convergent validity.
Table 3
Discriminant Validity – Correlations between Latent Variables
|
Constructs |
1 |
2 |
3 |
4 |
5 |
6 |
|
Fornell-Larcker Criterion |
||||||
|
1. WOS |
(0.845) |
|
|
|
|
|
|
2. Green Value |
0.575 |
(0.897) |
|
|
|
|
|
3. Functional Value |
0.495 |
0.728 |
(0.875) |
|
|
|
|
4. Social Value |
0.027 |
0.047 |
0.058 |
(0.819) |
|
|
|
5. Emotional Value |
0.230 |
0.412 |
0.398 |
0.093 |
(0.819) |
|
|
6. Customer Engagement |
0.522 |
0.685 |
0.676 |
0.084 |
0.597 |
(0.738) |
|
Heterotrait-Monotrait Ratio (HTMT) |
||||||
|
1. WOS |
|
|
|
|
|
|
|
2. Green Value |
0.657 |
|
|
|
|
|
|
3. Functional Value |
0.578 |
0.839 |
|
|
|
|
|
4. Social Value |
0.072 |
0.057 |
0.090 |
|
|
|
|
5. Emotional Value |
0.261 |
0.469 |
0.442 |
0.106 |
|
|
|
6. Customer Engagement |
0.615 |
0.796 |
0.799 |
0.109 |
0.716 |
|
Note. Numbers between brackets represent SQRT AVEs.
The discriminant validity of the reflective model can be evaluated through cross-loading values, then comparing the results of the square root of the AVE with the correlation values between constructs and assessing the heterotrait-monotrait ratio (HTMT). According to Table 3, the square root of each AVE construct is more significant than the squared value of each latent variable association. It shows that discriminant validity is met (Kock, 2015). The HTMT ratio values for all constructs ranged from 0.057 to 0.839, well below the 0.85 to 0.90 threshold (Hair et al., 2021). Based on the cross-loading assessment, the square root of the AVE with the correlation between the constructs and the ratio of HTMT, this research model is feasible and follows discriminant validity criteria.
The risk of common method variance (CMV) was evaluated by performing Harman’s single factor test with all measurement items (Podsakoff et al., 2012). All constructs consist of 6 variables with a total of 22 items. All things were entered into dimension reduction and continued factor analysis using a principal axis factoring method with no rotation. According to this technique, if a single factor emerges from the factor analysis, or one “general” factor accounts for more than 50% of the covariation in the variables, common method variance is present. The test results get the total variance explained, the initial eigenvalues for each item ranging from 0.477% to 37.749%, while the extraction sums of squared loadings with a combined percentage variance of 35.255% are less than 50%. The results showed that CMV was not a critical issue because no single factor alone explained variance of greater than 50% (Podsakoff et al., 2003). CMV will not be an issue in any study if the correlation among constructs is less than 0.90 (Bagozzi et al., 1991). Then the latent variables’ correlation was observed through PLS Algorithm. Fornell-Larcker Criterion, which is the correlation among all the constructs, was found between 0.027 and 0.897, and less than 0.90 (see Table 3). Thus, CMV is not an issue in this study.
3.3 Structural model assessment
The PLS-SEM results suggested a good fit of the model (SRMR = 0.076, NFI = 0.640) according to the criteria of acceptance (Byrne, 2010; Hair et al., 2017; Kline, 2011). In addition, average path coefficient (APC) was 0.264, p < 0.05; average R-squared (ARS) = 0.256, p < 0.05; average adjusted R-squared (AARS) = 0.251, p < 0.05; average block VIF (AVIF) = 2.353; average full collinearity VIF (AFVIF) = 1.393. These results are in accordance with the threshold of 3.30. Given these results, the analysis concluded that the proposed model fits the data satisfactorily (Kock, 2015).
The results of the hypotheses test can be seen in Table 4.
Table 4
Summary of the Hypotheses Testing
|
Path |
β |
T Statistics |
P Values |
Status |
|
H1a. WOS -> Green Value |
0.575 |
8.955 |
0.000 |
Supported |
|
H1b. WOS -> Functional Value |
0.495 |
6.052 |
0.000 |
Supported |
|
H1c. WOS -> Social Value |
0.027 |
0.309 |
0.757 |
Rejected |
|
H1d. WOS -> Emotional Value |
0.230 |
2.453 |
0.014 |
Supported |
|
H2a. Green Value -> Cust Engagement |
0.245 |
3.385 |
0.001 |
Supported |
|
H2b. Func Value -> Cust Engagement |
0.278 |
2.932 |
0.004 |
Supported |
|
H2c. Social Value -> Cust Engagement |
0.020 |
0.399 |
0.690 |
Rejected |
|
H2d. Emot Value -> Cust Engagement |
0.346 |
4.421 |
0.000 |
Supported |
|
H3. WOS -> Customer Engagement |
0.163 |
2.666 |
0.008 |
Supported |
Note. β = coefficient; and threshold of t-statistic > 1.96 and p-value < 0.05.
Hypotheses testing is shown in Table 4, where there are nine hypotheses, with seven accepted and two rejected. The next step of the analysis is to measure the hypothesized correlations among the latent variables through path coefficients (β), t-statistic value; (t) must be greater than 1.96, and significance levels (p) are less than 0.05 (Hair et al., 2011). H1a is accepted, the WOS construct on green value has a significant positive effect (β = 0.575, t = 8.955, p = 0.000). Then, H1b is accepted, with the WOS construct having a significant positive effect on the functional value (β = 0.495, t = 6.052, p = 0.000). However, H1c was rejected, with the WOS construct having a positive and insignificant effect on social value (β = 0.027, t = 0.309, p = 0.757). H1d is accepted, with the WOS construct having a significant positive effect on emotional value (β = 0.230, t = 2.453, p = 0.014). Next, there are some constructs that have a relationship with customer engagement. H2a is accepted with green value construct (β = 0.245, t = 3.385, p = 0.001); H2b is accepted with functional value construct (β = 0.278, t = 2,932, p = 0.004); H2c with the social value construct was rejected (β = 0.020, t = 0.399, p = 0.690); H2d is accepted with the emotional value construct (β = 0.346, t = 4.421, p = 0.000); and finally, H3 is accepted with the WOS construct (β = 0.163, t = 2.666, p = 0.008). WOS affects customer perceived green value, functional value, emotional value, and CE. Meanwhile, the strategy does not affect customer perceived social value. Customers’ perceived green value, functional value, and emotional value affect CE. Likewise, customer perceived social value has no role in forming CE.
Table 5
Indirect Impact Results
|
Path |
Direct Effect |
Indirect Effect |
|
|
Outcome |
|
|
t-stat |
p-value |
Mediator |
t-stat |
p-value |
||
|
WOS -> Customer Engagement |
2.666 |
0.008 |
Green Value |
3.412 |
0.001 |
Partial mediation |
|
Functional Value |
2.469 |
0.014 |
Partial mediation |
|||
|
Social Value |
0.094 |
0.925 |
No mediation |
|||
|
Emotional Value |
2.291 |
0.022 |
Partial mediation |
|||
Note. Threshold of t-statistic (t > 1.96) and p-value (p < 0.05).
This study also analyzes the indirect effect of each construct in Table 5. The direct effect between WOS on CE has a significant positive effect (t = 2.666, p = 0.008). The indirect effect of WOS on CE has a significant positive effect with the mediator variable. The constructs of green value (t = 3.412, p = 0.001), functional value (t = 2.469, p = 0.014), and emotional value (t = 2.291, p = 0.022) have a significant positive effect as a mediator between WOS on customer engagement. However, the social value construct (t = 0.094, p = 0.925) has a positive and insignificant effect, so it does not have a role as a mediator between WOS and CE.
4. Discussion
4.1 Theoretical implications
WOS is a corporate strategy that implements CSR in a sustainable manner (Aithal, 2016). There are four pillars of WOS: People, Planet, Passion, and Profit (Chanchaochai, 2012). The company will gain high profits by balancing people, planet, and passion. From the customer’s point of view, WOS is the company’s level of concern for the natural environment and the social environment in a sustainable manner. This study proves that companies that implement WOS will increase customers’ green value, functional value, emotional value, and CE. Many companies are concerned about the environment; their customers see companies as ethical, responsible, and trustworthy organizations. This strategy has an impact on satisfaction, brand connection, and recommendations from customers. Customers are more emotionally attached to environmentally friendly products. Philanthropic behaviour increases marketing results, loyalty, and customer referrals (Green & Peloza, 2011). CSR determines customer credibility and loyalty (Gunawan et al., 2020) and drives CE (Abbas et al., 2018; Agyei et al., 2021).
Environmental sustainability is essential for customers. Humans as social beings express a concern about the environment. Everyone’s level of concern is different. The customer with higher altruism will look for products with high green value. At the same time, WOS will increase customer perceived green value. Companies that care about the environment will make products or services that are pro-environment, thereby increasing the benefits of these products for the environment. Thus, the higher the company’s concern for the environment, the higher the green value perceived by customers. Customer perceived green value can mediate the effect of WOS on CE. Therefore, in formulating a program of WOS implementation activities, it is necessary to consider activities that increase the perceived green value of customers.
The company’s concern for the environment triggers the company to produce environmentally friendly products that are safe to use, and strive to provide the best for customers. So, it will increase customer perception of the functional product. Creating products related to the environment increases the functional value of customers (Green & Peloza, 2011; Yu & Lee, 2019). The customer’s perception of the high functional value section will increase CE. Quality products with good performance will increase product reuse, recommendations, and brand connections. The results of this study support the research of Green and Peloza (2011) that the functional value perceived by the customer will increase marketing results, loyalty, and brand connection. Customer perceived functional value is proven to act as a mediating variable that links WOS with CE. Maintaining consistent product quality, high performance, and high benefit products is essential in preparing programs to implement WOS to achieve CE.
Customers are not influenced by the social environment when deciding to consume environmentally friendly products because WOS does not affect the social value of customers. The results of this study are different from the results of research by Green and Peloza (2011), which states that philanthropy will impact social customer value. According to Hartini et al. (2021), WOS affects social values. This difference in results could be due to environmental issues that are less attractive to Generation Z (most respondents in this study were 19-23 years old). The characteristics of Generation Z are having self-confidence and being most interested and proficient with digital (Kompas.com, 2021). The company does not affect the customer’s social value because it is less interested in environmental issues. They are more interested in digital trend issues. Generation Z high self-confidence makes them not care about other people’s opinions. Pro-environmental activities are not crucial for Generation Z, and customer social values do not affect CE. It is possible because Generation Z like to be alone, so there is no need for other people’s opinions to break ties with certain products or brands.
Companies that implement WOS carry out many activities that care about the social and natural environment. It makes customers feel proud when actively participating in pro-environment programs. The more programs in WOS carried out by the company, the higher the emotional value felt by the customer. It supports previous research which found that WOS affects emotional value (Hartini et al., 2021). Corporate philanthropy increases emotional customer value (Green & Peloza, 2011). This customer perceived emotional value had been shown to act as a mediating variable for the relationship between WOS and customer engagement. Thus, WOS should be directed at the company’s activities that increase the customer’s perceived emotional value.
4.2 Managerial implications
This study proves that WOS has a significant positive effect on CE, green value, functional value, and emotional customer value. CE is the key to the company’s success in increasing profits. In this study, WOS was shown to affect CE. Thus, companies need to increase concern for the natural and social environment. Companies must promote this program to customers to understand the pro-environmental activities carried out by the company.
The customer’s perceived green, functional, and emotional values are mediating variables for WOS on CE. It means that companies must pay attention to the value felt by customers to get high CE. The implementation of WOS is directed at activities that increase these three values. These include increasing product benefits for the environment, maintaining quality consistency, improving product performance, and involving customers in various environmental care activities. Companies need to campaign the benefits of products for the environment and massively promote all company activities related to the company’s concern for the environment.
4.3 Limitations and further research
The results of this study indicate that WOS does not affect the perceived social value of customers. It is possible because 74.5 per cent of the respondents are Generation Z, who have inclination and abilities in the information or digital technology. They are less interested in social-environmental issues, so friends’ views are not necessary to them. The social value perceived by customers does not have a significant impact on CE. It is related to the dominance of research respondents who belong to Generation Z who have aloof characteristics (Kompas.com, 2021). Based on the results of this study, it is suggested that the first follow-up research can be replicated by distinguishing between different generations. Second, this research was conducted within the Surabaya bus service. In the future, research may be conducted in other industrial settings. The social value perceived by customers has no significant effect on customer engagement. There is a research gap in the relationship between customer value and customer engagement. Third, research can be done by placing customer involvement as an antecedent variable of customer value in the future. Fourth, WOS in this study is analyzed from a customer perspective, so they can only judge people and the planet. In the future, WOS research can be carried out from a company perspective. Fifth, customer characteristics play an essential role in customer behaviour. In the future, research needs to be done by adding altruistic customer variables.
References
Abbas, M., Gao, Y., & Shah, S. S. H. (2018). CSR and customer outcomes: The mediating role of customer engagement. Sustainability, 10(11), 4243. https://doi.org/10.3390/su10114243.
Agyei, J., Sun, S., Penney, E. K., Abrokwah, E., & Ofori-Boafo, R. (2021). Linking CSR and Customer Engagement: The Role of Customer-Brand Identification and Customer Satisfaction. SAGE Open, 11(3), 21582440211040113. https://doi.org/10.1177%2F21582440211040113.
Aithal, P. S. (2016). The concept of ideal strategy and its realization using white ocean mixed strategy. International Journal of Management Sciences and Business Research, 5(4), 171–179. http://dx.doi.org/10.5281/zenodo.161108.
Awaliyah, G., & Maharani, E. (2019, March 26). Banyak Perusahaan Masih Abaikan CSR. Republika.co.id. https://nasional.republika.co.id/berita/nasional/daerah/poz82g335/banyak-perusahaan-masih-abaikan-csr.
Bagozzi, R. P., Yi, Y., & Phillips, L. W. (1991). Assessing construct validity in organizational research. Administrative Science Quarterly, 421–458. https://doi.org/10.2307/2393203.
Bielawska, K., & Grębosz-Krawczyk, M. (2021). Customers’ Choice Behaviour Toward Green Clothing. European Research Studies, 24(2), 238–256. http://dx.doi.org/10.35808/ersj/2124.
Bowden, J. L. H. (2009). The process of customer engagement: A conceptual framework. Journal of Marketing Theory and Practice, 17(1), 63–74. https://doi.org/10.2753/MTP1069-6679170105.
Brodie, R. J., Hollebeek, L. D., Jurić, B., & Ilić, A. (2011). Customer engagement: Conceptual domain, fundamental propositions, and implications for research. Journal of Service Research, 14(3), 252–271. https://doi.org/10.1177%2F1094670511411703.
Byrne, B. M. (2010). Structural Equation Modeling with AMOS: Basic Concepts, Applications, and Programming (2nd ed.). New York: Taylor & Francis Group.
Carlson, J., Rahman, M., Voola, R., & De Vries, N. (2018). Customer engagement behaviours in social media: Capturing innovation opportunities. Journal of Services Marketing, 32(1), 83–94. https://doi.org/10.1108/JSM-02-2017-0059.
Chanchaochai, D. (2012). White Ocean Strategy. DMG books.
Dessart, L., Veloutsou, C., & Morgan-Thomas, A. (2015). Customer engagement in online brand communities: A social media perspective. Journal of Product & Brand Management, 24(1), 28–42.https://doi.org/10.1108/JPBM-06-2014-0635
Dijkstra, T. K., & Henseler, J. (2015). Consistent partial least squares path modeling. MIS Quarterly, 39(2), 297–316. http://dx.doi.org/10.25300/MISQ/2015/39.2.02.
Dolan, R., Conduit, J., Frethey-Bentham, C., Fahy, J., & Goodman, S. (2019). Social media engagement behavior: A framework for engaging customers through social media content. European Journal of Marketing, 53(10), 2213–2243 . https://doi.org/10.1108/EJM-03-2017-0182.
Frost, R. D., & Strauss, J. (2016). E-marketing. Routledge. https://doi.org/10.4324/9781315506531.
Ghozali, I., & Latan, H. (2015). Konsep, Teknik, Aplikasi Menggunakan Smart PLS 3.0 Untuk Penelitian Empiris. BP Undip. Semarang..
Green, T., & Peloza, J. (2011). How does corporate social responsibility create value for customers? Journal of Customer Marketing, 28(1), 48–56. https://doi.org/10.1108/07363761111101949.
Gummerus, J. (2013). Value creation processes and value outcomes in marketing theory: Strangers or siblings?. Marketing Theory, 13(1), 19–46. https://doi.org/10.1177%2F1470593112467267.
Gunawan, S., Budiarsi, S. Y., & Hartini, S. (2020). Authenticity as a corporate social responsibility platform for building customer loyalty. Cogent Business & Management, 7(1), 1775023. https://doi.org/10.1080/23311975.2020.1775023.
Hair, J. F., Ringle, C. M., & Sarstedt, M. (2011). PLS-SEM: Indeed a silver bullet. Journal of Marketing Theory and Practice, 19(2), 139–152. https://doi.org/10.2753/MTP1069-6679190202.
Hair Jr, J. F., Hult, G. T. M., Ringle, C. M., & Sarstedt, M. (2021). A Primer on Partial Least Squares Structural Equation Modeling (PLS-SEM). Sage publications.
Hair Jr, J. F., Sarstedt, M., Ringle, C. M., & Gudergan, S. P. (2017). Advanced Issues in Partial Least Squares Structural Equation Modeling. Sage publications.
Harmeling, C. M., Moffett, J. W., Arnold, M. J., & Carlson, B. D. (2017). Toward a theory of customer engagement marketing. Journal of the Academy of Marketing Science, 45(3), 312–335. https://doi.org/10.1007/s11747-016-0509-2.
Hartini, S., Kurniawati, M., Sulistiawan, J., & Ihwanudin, M. (2021). From Practice to Theory: White Ocean Strategy of Creative Industry in East Java Indonesia. Review of International Geographical Education Online, 11(5), 4214–4222. Doi: 10.48047/rigeo.11.05.303.
Hartini, S., Mardhiyah, & D. Sukaris (2020). A conceptual framework for relationship between symbolic risk consumption with electronic word of mouth. Opcion, 26(26s), 1282–1295.
Hartini, S., Premananto, G. C., & Sulistiawan, J. (2017). Relationships Consumer Characteristic and Perceive Business Ethics of Creative Industry in Indonesia: Study of Y Generations. International Journal of Applied Business and Economic Research, 15(24), 513–521.
Hollebeek, L. D. (2011). Demystifying customer brand engagement: Exploring the loyalty nexus. Journal of Marketing Management, 27(7-8), 785–807. https://doi.org/10.1080/0267257X.2010.500132.
Hollebeek, L. D. (2013). The customer engagement/value interface: An exploratory investigation. Australasian Marketing Journal (AMJ), 21(1), 17–24. https://doi.org/10.1016/j.ausmj.2012.08.006.
Itani, O. S., Kassar, A. N., & Loureiro, S. M. C. (2019). Value get, value give: The relationships among perceived value, relationship quality, customer engagement, and value consciousness. International Journal of Hospitality Management, 80, 78–90. https://doi.org/10.1016/j.ijhm.2019.01.014.
Jaakkola, E., & Alexander, M. (2014). The role of customer engagement behavior in value co-creation: A service system perspective. Journal of Service Research, 17(3), 247–261. https://doi.org/10.1177%2F1094670514529187.
Khalifa, A. S. (2004). Customer value: A review of recent literature and an integrative configuration. Management Decision, 42(5), 645–666. https://doi.org/10.1108/00251740410538497.
Kline, R. B. (2011). Convergence of structural equation modeling and multilevel modeling. In M. Williams & W. P. Vogt (Eds.), The SAGE Handbook of Innovation in Social Research Methods (pp. 562–589). https://dx.doi.org/10.4135/9781446268261.n31.
Kock, N. (2015). Common method bias in PLS-SEM: A full collinearity assessment approach. International Journal of e-Collaboration (ijec), 11(4), 1–10. http://dx.doi.org/10.4018/ijec.2015100101.
Kompas.com (2021, April 17). Jangan Tertukar, Ini Pengertian Generasi X, Z, Milenial, dan Baby Boomers. Kompas.com. https://www.kompas.com/skola/read/2021/04/17/130000069/jangan-tertukar-ini-pengertian-generasi-x-z-milenial-dan-baby-boomers.
Kotler, P., & Lee, N. (2008). Corporate Social Responsibility: Doing the Most Good for Your Company and Your Cause. John Wiley & Sons.
Kumar, V., & Pansari, A. (2016). Competitive advantage through engagement. Journal of Marketing Research, 53(4), 497–514. https://doi.org/10.1509%2Fjmr.15.0044.
Malhotra, N. K. (2015). Essentials of Marketing Research: A Hands-on Orientation. Essex: Pearson. ISBN-13: 978-0137066735. ISBN-10: 0137066732.
Malthouse, E. C., Haenlein, M., Skiera, B., Wege, E., & Zhang, M. (2013). Managing customer relationships in the social media era: Introducing the social CRM house. Journal of Interactive Marketing, 27(4), 270–280. https://doi.org/10.1016/j.intmar.2013.09.008.
Ngo, H. Q., Nguyen, T. H., & Kang, G. D. (2019). The effect of perceived value on customer engagement with the moderating role of brand image: A study case in Vietnamese restaurants. International Journal of Innovative Technology and Exploring Engineering, 8(7C2), 451–461.
Pansari, A., & Kumar, V. (2017). Customer engagement: the construct, antecedents, and consequences. Journal of the Academy of Marketing Science, 45(3), 294–311. https://doi.org/10.1007/s11747-016-0485-6.
Park, J., & Ha, S. (2016). Co-creation of service recovery: Utilitarian and hedonic value and post-recovery responses. Journal of Retailing and Customer Services, 28, 310–316. https://doi.org/10.1016/j.jretconser.2015.01.003.
Petrick, J. F. (2002). Development of a multi-dimensional scale for measuring the perceived value of a service. Journal of Leisure Research, 34(2), 119–134. https://doi.org/10.1080/00222216.2002.11949965.
Piligrimienė, Ž., Žukauskaitė, A., Korzilius, H., Banytė, J., & Dovalienė, A. (2020). Internal and external determinants of customer engagement in sustainable consumption. Sustainability, 12(4), 1349. https://doi.org/10.3390/su12041349.
Podsakoff, P. M., MacKenzie, S. B., Lee, J. Y., & Podsakoff, N. P. (2003). Common method biases in behavioral research: A critical review of the literature and recommended remedies. Journal of Applied Psychology, 88(5), 879. http://dx.doi.org/10.1037/0021-9010.88.5.879.
Podsakoff, P. M., MacKenzie, S. B., & Podsakoff, N. P. (2012). Sources of method bias in social science research and recommendations on how to control it. Annual Review of Psychology, 63, 539–569. https://doi.org/10.1146/annurev-psych-120710-100452.
Ramzan, M., Amin, M., & Abbas, M. (2021). How does corporate social responsibility affect financial performance, financial stability, and financial inclusion in the banking sector? Evidence from Pakistan. Research in International Business and Finance, 55, 101314. https://doi.org/10.1016/j.ribaf.2020.101314.
Rather, R. A., Tehseen, S., & Parrey, S. H. (2018). Promoting customer brand engagement and brand loyalty through customer brand identification and value congruity. Spanish Journal of Marketing-ESIC, 22(3), 319–337. https://doi.org/10.1108/SJME-06-2018-0030.
Servera-Francés, D., & Piqueras-Tomás, L. (2019). The effects of corporate social responsibility on customer loyalty through customer perceived value. Economic Research-Ekonomska istraživanja, 32(1), 66–84. https://doi.org/10.1080/1331677X.2018.1547202.
Sheth, J. N., Newman, B. I., & Gross, B. L. (1991). Why we buy what we buy: A theory of consumption values. Journal of Business Research, 22(2), 159–170. https://doi.org/10.1016/0148-2963(91)90050-8.
Smith, J. B., & Colgate, M. (2007). Customer value creation: a practical framework. Journal of Marketing Theory and Practice, 15(1), 7–23. https://doi.org/10.2753/MTP1069-6679150101.
So, K. K. F., King, C., Sparks, B. A., & Wang, Y. (2016). The role of customer engagement in building customer loyalty to tourism brands. Journal of Travel Research, 55(1), 64–78. https://doi.org/10.1177%2F0047287514541008.
Sukaris, S., Hartini, S., & Mardhiyah, D. (2019). Increasing Electronic Word-of-Mouth Activities through Self-Congruity and Tourist Values. International Journal of Innovation, Creativity and Change, 9(10), 162–183.
Suki, N. M. (2016a). Green product purchase intention: Impact of green brands, attitude, and knowledge. British Food Journal, 118(12), 2893–2910. https://doi.org/10.1108/BFJ-06-2016-0295.
Suki, N. M. (2016b). Customer environmental concern and green product purchase in Malaysia: Structural effects of consumption values. Journal of Cleaner Production, 132, 204–214. https://doi.org/10.1016/j.jclepro.2015.09.087.
Sweeney, J. C., & Soutar, G. N. (2001). Customer perceived value: The development of a multiple item scale. Journal of Retailing, 77(2), 203–220. https://doi.org/10.1016/S0022-4359(01)00041-0.
Terason, S., Zhao, S., & Pattanayanon, P., (2021). Customer value and customer brand engagement: Their effects on brand loyalty in automobile business. Innovative Marketing, 17(2), 90–101. http://dx.doi.org/10.21511/im.17(2).2021.09.
Tripathi, M. N. (2009). Customer Engagement-Key to Successful Brand Building. Vilakshan: The XIMB Journal of Management, 6(1), 11–140.
Wang, Y., Lo, H. P., & Yang, Y. (2004). An integrated framework for service quality, customer value, satisfaction: Evidence from China’s telecommunication industry. Information Systems Frontiers, 6(4), 325–340. https://doi.org/10.1023/B:ISFI.0000046375.72726.67.
Wei, X., & Jung, S. (2017). Understanding Chinese customers’ intention to purchase sustainable fashion products: The moderating role of face-saving orientation. Sustainability, 9(9), 1570. https://doi.org/10.3390/su9091570.
Williams, P., Soutar, G., Ashill, N. J., & Naumann, E. (2017). Value drivers and adventure tourism: A comparative analysis of Japanese and Western customers. Journal of Service Theory and Practice, 27(1), 102–122. https://doi.org/10.1108/JSTP-05-2015-0116.
Woodruff, R. B. (1997). Customer value: The next source for competitive advantage. Journal of the Academy of Marketing Science, 25(2), 139–153. https://doi.org/10.1007/BF02894350.
Xia, D., Yu, L., Zhang, M., & Zhang, X. (2019, February). Influence of Online Interaction on Customers’ Willingness to the Consumption of Green Products. Earth and Environmental Science, 233(5), 052032). http://dx.doi.org/10.1088/1755-1315/233/5/052032.
Yang, Y., Jing, F., & Nguyen, B. (2016). China’s outbound tourism: Investigating word-of-mouth and its effect on perceived value, satisfaction and loyalty. Journal of China Tourism Research, 12(2), 159–178. https://doi.org/10.1080/19388160.2016.1223776.
Yu, S., & Lee, J. (2019). The effects of customers’ perceived values on intention to purchase upcycled products. Sustainability, 11(4), 1034. https://doi.org/10.3390/su11041034.
Zeithaml, V. A. (1988). Customer perceptions of price, quality, and value: A means-end model and synthesis of evidence. Journal of Marketing, 52(3), 2–22. https://doi.org/10.1177%2F002224298805200302.
Zhang, M., Guo, L., Hu, M., & Liu, W. (2017). Influence of customer engagement with company social networks on stickiness: Mediating effect of customer value creation. International Journal of Information Management, 37(3), 229–240. https://doi.org/10.1016/j.ijinfomgt.2016.04.010.
Appendix
Table A1
Variables, Items, and References
|
Variables |
Items |
References |
|
White Ocean Strategy |
Concern for the natural environment |
Chanchaochai, 2012 |
|
Priority for community welfare |
||
|
Good company reputation |
||
|
Trustworthy company |
||
|
Green Value |
High benefit for the environment |
Yu & Lee, 2019 |
|
Environment friendly |
||
|
Care for the environment |
||
|
Functional Value |
Quality consistent |
Yu & Lee, 2019 |
|
Good performance |
||
|
High benefit using the product |
||
|
Social Value |
My friends see me as a wise person. |
Yu & Lee, 2019 |
|
My friends see me as an intelligent person. |
||
|
My friends see me as an altruistic person. |
||
|
Emotional Value |
Feels participating in the green program |
Yu & Lee, 2019 |
|
Feels proud to be a good person |
||
|
Feels support for solving social problems |
||
|
Customer Engagement |
Service reuse |
Itani et al., 2019; Piligrimienė et al., 2020 |
|
Recommendation to use |
||
|
Satisfaction |
||
|
Brand connection |
||
|
Actively discuss |
||
|
Think the service is the best |