Organizations and Markets in Emerging Economies ISSN 2029-4581 eISSN 2345-0037
2023, vol. 14, no. 1(27), pp. 26–55 DOI: https://doi.org/10.15388/omee.2023.14.81
Global Value Chain and Total Factor Productivity in Africa
Folorunsho M. Ajide
University of Ilorin, Nigeria
ajide2010@gmail.com, ajide.fm@unilorin.edu.ng
https://orcid.org/0000-0003-3231-2423
Abstract. This paper examines the impact of global value chain (GVC) participation on total factor productivity in African economies. The analysis is based on panel corrected standard errors, IV-estimation technique and the novel Method of Moment (MM)-panel quantile regression. The results reveal that there is positive and significant relationship between global value chain and total factor productivity in African economies. Specifically, we discover that the impact of GVC participation on total factor productivity is positive and significant. This result is consistent across all the quartiles after employing MM-panel quartile regression. The coefficients of global value chains improve as we approach a higher quantile. The study concludes that GVC participation allows access to a larger global market which local firms may explore to gain from scale economies, and to learn using modern technology and innovations. It facilitates connections to cheaper and quality inputs for domestic production, while efficiency is guaranteed.
Keywords: Africa, domestic added value, forward added value, MM-panel quartile regression
Received: 6/12/2021. Accepted: 17/1/2023
Copyright © 2023 Folorunsho M. Ajide. Published by Vilnius University Press. This is an Open Access article distributed under the terms of the Creative Commons Attribution Licence, which permits unrestricted use, distribution, and reproduction in any medium, provided the original author and source are credited.
1. Introduction
In the new millennium, global value chain (GVC) has reshaped the pace for economic development leading to changes in global division of labour and fragmentation processes for borderless production system (Feng et al., 2020). Reduction in the cost of transportation and communication coupled with elimination of trade barriers in relation to trade and foreign investment has led to an expansion in globalization and GVC in particular (Foster‐McGregor et al., 2016). Globalization also changes the way primary products are transformed in production processes through GVC. In this era, production is organized around GVC, where firms rely on a complex network of suppliers across the World. This new trend has led to the emergence of value added at different production stages from many countries. GVC is the system by which production systems are sliced into different level of specializations by different components undertaken at countries or locations across international borders in order to take the advantage of the economies of scale. This implies that at each stage, value is added depending on where the necessary skills and materials are found at competitive costs (Globerman, 2011).
There are numerous benefits that developing regions such as Africa can derive from engaging in GVC. Developing nations do not need to create the entire sectors and industries for the purpose of being industrialized and competitive in the international markets (Baldwin, 2012; Foster‐McGregor et al., 2016). This implies that there is interconnection between nations. For instance, developing nations can provide some specific skills within the GVC network, and countries with low labour costs may produce at least high quality manufactured products and services. Participation in GVC may expose African nations to opportunities in global markets which may encourage inflows of foreign direct investment into African nations. Technology spillover effects may occur through technology transfer. These effects may brace up best practice in terms of organizational management and business methods via the use of high-tech intermediates and production of high quality services. It can also emerge from the use of developed nations’ intellectual property, trademarks, knowledge and technology sharing through skills demand and upgrading via learning from customers (Foster‐McGregor et al., 2016; Olasehinde-Williams & Oshodi, 2021).
Theoretically, there are two different views on the relationship between GVC and factor productivity. Grossman and Helpman (1991) maintain that restrictive policy, a policy against participation in GVC, may help to improve economic performance and reduce unnecessary competitive pressure from foreign competitors in the global market. In addition, intervention in trade may help in improving long run growth, especially when it encourages innovation and huge investment in research and development initiative for specific sectors in an economy. On the other hand, GVC can enhance factor productivity through trade intermediation, learning by interacting and openness of new market opportunities as well as the possibility of upgrading the country’s position in the chains (UNCTAD, 2013; Yanikkaya & Altun, 2020). By this way, participating in GVC may enhance the achievement of macroeconomic objectives of developing countries in terms of income and full employment (Liu & Saam, 2021; Olasehinde-Williams & Oshodi, 2021). Fessehaie and Morris (2018) report that GVC has the necessary apparatus to upgrade the total factor productivity of an economy due to technology spillovers and access to rare sophisticated production mechanisms. However, whether GVC promotes the productivity growth or not remains an empirical question that needs empirical answers. The few studies conducted in this area reveal some interesting results which remain inconclusive, while little is known about the case of developing countries such as Africa (Yanikkaya & Altun, 2020; Feng et al., 2020; Liu & Saam, 2021). Our study fills this important gap and provides new evidence for the case of African countries.
Therefore, the purpose of this study is to examine the impact of GVC on total factor productivity in Africa. Total factor productivity can be related to GVC due to technological innovation accrued from participation in association with more advanced economies, or probably with all countries (Baldwin & Gu, 2004). GVC participation may impact productivity through a number of channels. First, given its cheap labour costs, the participation of African countries in GVC will manifest in lower costs of inputs, and more productivity efficiency would be accrued. The benefits may also come by participating with more advanced economies, leading to Africa’s access to advanced technology and innovation diffusion (Kelly, 2004). The novelties of this study are hereby highlighted. We examine the relationship between productivity proxied by total factor productivity and global value chain participation. The literature of this nature rarely discusses African perspectives. In our analysis, we take into consideration the cross-sectional dependence as a result of substantial inter-economic connections among countries. This issue is addressed in order to avoid erroneous and inconsistent estimates in the panel (Tachie et al., 2019). Unlike previous studies that estimate the parameters of the variables at the average of conditional distribution of dependent variable, our study adds textures to the literature by employing the Method of Moments Panel Quantile regression recently developed by Machado and Santos (2019). This technique uses non-parametric approach to uncover the heterogeneous impacts of individual countries under different quantiles of factor productivity distribution conditions while accounting for the fixed effects’ presence. Our results show that participation in GVC improves the level of African productivity, but the impacts are heterogeneous across quartiles.
This paper is organised into 5 sections. The next section discusses the literature review, while Section 3 accounts for the methods adopted for the analysis. Section 4 discusses the results of the study, Section 5 concludes the study and analyses the policy implications.
2. Literature Review
2.1 Brief Overview of Global Value Chain and Total Factor Productivity in Africa
Global value chains (GVC) can be called the global production sharing, in which production system is broken down into different stages. These stages are further carried out in different economies throughout the globe. The production system is fragmented into cross-border networks in different locations which have implications for industrial productivity and development in African economies (Sydor, 2013; Seric & Tong, 2019). Over the years, researchers have been concerned with the measurement of country’s GVC with the use of global input-output tables (Nomaler & Verspagen, 2014). Based on this, an economy’s exports or final demand is split into components including domestic and imported value added that are incorporated into the exports (the final demand). Hummels et al. (2001) propose the idea of foreign value added in trade (FVA), which is the foreign added value used in the export products of a nation. The FVA is expressed in terms of gross export. However, a robust indicator was proposed by Koopman et al. (2011, 2014). The authors break down the GVC indicators into foreign value added (FVA) and domestic value added (DVA). The FVA indicates the share of a nation’s exports as inputs in the production of other nations. Thus, this value added in trade is not considered in the country’s GDP. The FVA is the value added created abroad. DVA indicates the contribution of domestic sectors to other nation’s exports (final demands). The DVA and FVA provide a holistic approach of GVC participation.
In Africa, countries participate in GVC through backward and forward linkages. The backward linkage occurs when a country uses inputs generated from another country. This mostly occurs when the inputs are not available locally, while forward linkage occurs when an African country supplies inputs to the foreign country. This implies that goods and services are taken through many borders before reaching the final stage of production.
Figure 1
GVC Participation (as % of GDP)
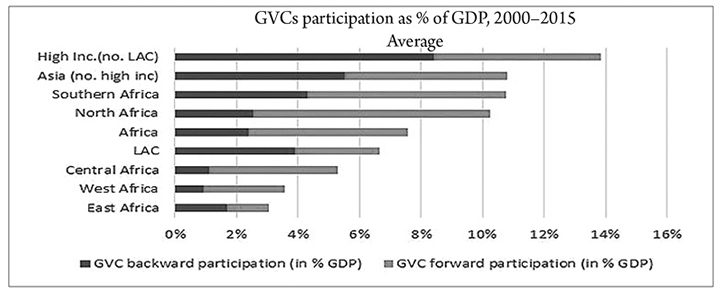
Source: Siba (2022).
Figure 1 reveals Africa nations’ participation in GVC, which is 8 percent compared to 11 percent of Asian developing regions and 14 percent for the case of higher income nations between 2000 and 2015. Furthermore, domestic value added constitutes the larger proportion of GVC participation in Africa. This implies that the majority of import of African countries acts as input to meet local production demand. The demand side of African complex GVC participation accounts for a larger portion of the whole GVC in Africa than the supply side. Southern African countries are the leading participants, while North African economies are the second in the supply side value chain. The Western and Eastern African economies have up to 11 percent engagement in domestic value added to export. In the same vein, Central African economies are the least engaged in GVC. In terms of backward participation, Mouanda-Mouanda (2019) observes that North Africa performs a leading role, followed by West and Central Africa. Southern Africa also demonstrates some level of participation, while Eastern Africa is the least in this arrangement.
Figure 2
GVC Participation (in thousand US dollars)
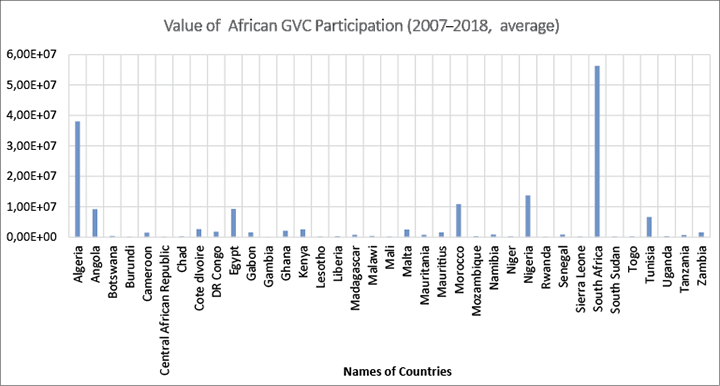
Note. Own chart (data obtained from UNCTAD‐EORA database).
Based on country level data, Figure 2 demonstrates that South Africa is the leading GVC participant, followed by Algeria, Egypt and Nigeria. Since the level of African GVC participation is still growing, scholars observe that it has major implications for the level of economic prospects and development through changes in total factor productivity (TFP) (Ajide, 2021; Mouanda-Mouanda, 2019).
In the same manner, TFP is essential for every economy that aims at a higher level of economic performance. TFP is the residual in production function that affects output performance after capital stock and human capital. It captures the efficiency utilized in the input transformation activities. It is the output per units of total factors influenced by technical efficiency through advancement in technology, good economic policies and quality of political institutions (Garzarelli & Limam, 2019; Ajide, 2021). West Africa experienced a 1.8 percent growth in TFP, which is lower than that of Central Africa with 1.9 percent TFP growth rate. The Eastern part of Africa experienced about 2.3 percent growth rate in TFP, while the average growth in Africa is 3.4 percent (Ajao, 2003; Ajide, 2021). Garzarell and Limam (2019) explain that TFP growth rate is above 1.97 percent, where major contribution comes from technical efficiency in African economies. In this case, it would be worth investigating whether global value chain enhances productivity in the African continent.
2.2 Theoretical Literature
The classical theory explains that labour and capital are the main sources of output in the economy. By implication, other factors such as total factor productivity, technology and political institutions are not given adequate attention in the analysis. The neoclassical framework suggests that factors accumulation (labor and capital) including productivity growth are the main sources of economic performance, which has been well debated in the literature (McMillan & Rodrik, 2011; Akinlo & Adejumo, 2016). However, economic theories do not provide a clear cut picture on the relative contribution of GVCs to the total factor productivity. Stiglitz (2000) and Young (1991) are of the view that GVC participation of developing countries may harm their economic performance and discourage the growth of certain industries thereby limiting knowledge spillovers and growth in factors productivity. Other authors argue that GVC may enhance overall productivity growth via various channels. In a situation of imperfect conditions, GVC may exert competitive pressure, improve resource allocative efficiency by encouraging firms to adopt lower cost-price relationship. In addition, GVC may shift the average cost downward and increase the size of firms including scale efficiency (Epifani, 2003). The literature on growth theory views that economic openness may promote GVC participation and leads to economic expansion via shift in economies of scale, improvement in allocation of resources, and technological advancement and TFP (Kruger, 1985; Helpman & Krugman, 1985; Rodrik, 1988; Barro & SalaI-Martin, 1995). This implies that integration into the global economy may accelerate efficiency in production and the pace of economic expansion. However, the view of Grossman and Helpman (1991) points to the fact that protectionism would help to develop the domestic economy and protect against foreign pressure. Protection may also encourage investment in industrial research and development, which encourages innovation in some specific sectors.
In the same manner, Antràs and Gortari (2020) propose a multi-stage general equilibrium model based on GVC specialization of each nation in the global market. Their model explains that in a costly trade, optimal production location is based on both marginal cost and the proximity of location to desired locations of production. This implies that developing economies may promote efficient productivity system by participating in GVC. This economic integration has theoretical as well as empirical substances in the literature. The potential for firms and countries to participate in global value chains emerged from the economic gains of production fragmentation processes stemming from the comparative advantages of world trade. The participation in GVC may facilitate adequate access to the global market. This makes it possible to enjoy scale economies and technology spillover resulting from implementation of efficient technologies and cost reduction strategies (Baldwin & Yan, 2014). GVC ensures that developing countries remain competitive in the global market through an improvement in the production system. This is because production systems are fragmented, and developing economies may not necessarily build their one value chain from scratch. This enables them to be more focused and more efficient through reduction in production costs (Olasehinde-Williams & Oshodi, 2021; Dutta, 2021). By this way, GVC enhances employment creation and higher level of factor productivity (Dutta, 2021). Furthermore, the impact of fragmentation in production process has been well documented through the analysis of endogenous growth model that determines the long-run per capita growth of the economy (Kordalska et al., 2016). The most important elements that drive productivity growth, according to the theory, is knowledge through technological advancement, managerial know-how and human resources. These factors can be obtained by developing countries through participation in GVC, in which technology licensing, capital and intermediate goods importation embodying technology can be annexed. Improvement in productivity may also be accrued to developing countries by hosting foreign firms and through offshoring engagement, which enhances technology spillover (Kordalska et al., 2016; Ajide, 2021).
2.3 Empirical Literature
The nexus between the TFP and institutions has been well analysed (North, 1990; Acemoglu et al., 2001; Glaeser et al., 2004; Tebaldi, 2016). Likewise, the relationship between growth and TFP has been well examined (Solow, 1957; Chen, 1997; Griliches, 2007; McMillan & Rodrik, 2011). However, the relationship between TFP and GVC is yet to be well explored in developing regions. It is usually expected that developing economies should benefit through procurement of intermediate goods and services from the developed ones, which can be used to enhance productivity. The study of Baldwin and Yan (2014) examines the influence of GVC on productivity of Canadian manufacturing firms. The authors employ propensity-score matching and the method of difference-in-difference analysis. The results show that GVC enhances productivity of the firms, which is attributed to technological improvements. In a related study conducted by Urata and Baek (2020), the authors discover that GVC participation improves the level of productivity in 47 countries between 1995 and 2011. Both backward and forward participation contribute to the development of an efficient production system in the economies under consideration. Feng et al. (2020) utilized the panel smooth transformation model (PSTR) to analyse the data and found that China’s energy sector benefits from GVC participation due to an improvement in total factor productivity. Their analysis shows that there is a U-shaped relationship between the two variables. That is, GVC promotes TFP and later suppresses it for the case of China’s energy sector. This is because in the early stage, GVC participation improves TFP due to China’s exposure to advanced technology by developed nations. However, as the Chinese GVC participation is deepened, the spillover welfare of developed nations becomes weak. This happens when the foreign firms place restrictions on domestic firms so as to gain monopoly power over the use of technologies, which leads to the suppression of TFP.
Yanikkaya and Altun (2020) employed Generalized Method of Moments (GMM) to analyse the impact of backward and forward participation in GVC on total factor productivity over two periods: 1995–2011 and 2005–2015. The study documents that higher participation improves factor productivity. Kılıçaslan et al. (2021) explored the relationship between GVC and productivity in Turkey within a period of 2003–2015. The results based on GMM show that domestic chain reduces firms’ productivity, while the global value chain has a positive impact on productivity of a firm. Prete et al. (2017) employed propensity score matching the difference-in-differences method on firm-level data and also confirmed that GVC improves productivity efficiency of firms. In addition, Ayadi et al. (2020) applied a multilevel model on firm level data to show that GVC has a positive and significant impact on productivity. Manghnani et al. (2021) explored the link between service inputs, GVC participation and firm productivity by employing the data covering 1990–2017. The study discovers that there is a productivity premium at a range of 13–22 percent for firms that participate in GVC. ICT further improves the level of firm productivity. Utilizing a survey of 25,090 Italian firms, Giovannetti and Marvasi (2016) confirm that firms participating in GVC improve their probability of exporting activities. In another study, Giovannetti and Marvasi (2017) show that firms in hierarchical value chains have the tendency to be more productive. Banh et al. (2020) used firm-level data to confirm that GVC participation promotes productivity in Estonia between 2000–2016. In a related study, Benkovskis et al. (2020) show that firms’ productivity again is associated with learning by doing in export services because it enhances knowledge and technology spillover among nations.
Apart from GVC, there are many other determinants of TFP that are considered in the literature. These include trade openness, inflation, capital income per capita and political institutions (Fosu, 2012; Akinlo & Adejumo, 2016; Osinubi, 2019; Ajide, 2021). For instance, Abizadeh and Pandey (2009) examined the impact of trade openness on total factor productivity and empirically proved that the relation is positive and significant (also see Kummritz, 2016). Haider et al. (2019) explored the link between total factor productivity and economic openness in India’s economy between 1970 and 2011. The results based on the autoregressive distributive lag model show that efficiency gains can be derived if the economy is well protected in the long run. In a related study conducted by Amirkhalkhali and Dar (2019), it was revealed that in OECD countries over a period of 2000–2015, a higher degree of openness would encourage export expansion and contribute positively to TFP. Wei (2009) showed that trade and human capital relate with TFP. Li and Tang (2019) documented that foreign direct investment improves TFP. The latest study of Abidin et al. (2021) applied pooled mean group on 10 Asian countries and documented that in Asian economies, economic openness correlates with TFP.
2.4 Global Value Chain and Productivity: A Testable Hypothesis
Understanding the impact of global value chains (GVC) on productivity can be best understood from the opportunities and benefits to be derived by a nation and domestic firms in particular. The participation in GVC has offered many countries the opportunities to have access to raw materials and modern technologies. It enables local and multinational firms to operate in the global markets. Based on this, GVC provides the benefits to participate in global markets, further strengthening the interdependence among nations (Escaith & Inomata, 2013; Reddy, 2020). Baldwin (2013) discussed the phenomenon of engaging in value chains, which makes industrialization fundamentally faster and less complex because the supply-chain industry is less uneven and domestically interconnected. A number of studies reviewed above show that a country’s integration into the GVC would improve its productivity and efficiency (Feng et al., 2020; Ayadi et al., 2020). Criscuolo and Timmis (2017) provide the channels of the relationship between GVC and productivity. First, services are important components of GVC because they provide the link that assists the coordination of cross-border production system. This includes distribution, finance and other marketing activities. Services complement the networks of production system, and this phenomenon is reflected in the measures of GVC. In the Ricardian theory, specialization and country interdependence have been entrenched to be the main sources of comparative advantages. In the same manner, they serve as the important sources of productivity gains in GVC participation (Criscuolo & Timmis, 2017). GVC has led to the increase in specialization of nations in some specific activities within the value chain system in which firms can no longer solely complete a local supply chains system. This brings innovation and a reduction in transaction costs including production efficiency.
In addition, GVC is a vehicle of production efficiency by bringing positive spillovers to domestic firms. It mediates multinational and domestic enterprises with international frontier of technology, innovation and productivity. Local firms’ exposure to modern innovations and advanced technologies would bring superior experience to managerial practices. This brings healthy competition, and quality improvement is maintained in the productive structures. Also, participation in GVC requires upscaling, growth and investment in communication and information infrastructures, and increase in learning for product innovations. In summary, these arguments lead us to hypothesize that GVC would have a positive impact on total factor productivity in Africa.
3 Materials and Methods
3.1 Empirical Model
The empirical model of the paper is derived from the literature (Urata & Baek, 2020; Yanikkaya & Altun 2020). To test the study’s hypothesis, we specify equation (1):
 (1)
(1)
In equation (1), TFPit is the total factor productivity, which is the dependent variable, GVCit is the set of Global Value Chain participation variables. Apart from this, we also consider other variants of GVC such as Domestic Value Added (DVA) and Foreign Value Added (FVA). Xit is the vector of control variables, which includes inflation rate (Inf), trade openness(LOPEN), political institutions (Polity2), income level (LINC), information and communication technology (LICT), labour force employed (Lemp), and capital stock (LCAP). These variables have been empirically considered to affect TFP in the literature. Recent studies show that political institutions influence TFP in Africa. Strong institutional quality may improve the level of factor productivity, while weak institutions may have negative consequences on total factor productivity (Ajide, 2021). Based on this, the paper introduces political institutions (polity2) into the model as a control variable. Inflation is one of the measures of macroeconomic instability. Studies show that a higher level of inflation reduces returns on capital and affects economic agents’ investment decision. It is expected that inflation will reduce productivity level (Abdullah & Chowdhury, 2020). Furthermore, the study takes capital stock as one of the control variables to capture the influence of capital accumulation on productivity in African economy (Kumar & Russell, 2002; Lafuente et al., 2019). Human capital proxied as the number of labour force employed (LCAP), output growth (LGDPP), ICT and degree of trade openness are considered as factors that lead to shifts in TFP. These factors have been well discussed in the theoretical and empirical literature (Romer, 1990; Nelson & Phelps, 1966; Akinlo & Adejumo, 2016). εit represents the residual term, ϑi is the unobserved country fixed effects, θt is time-specific effects, t and i are the time and country dimension respectively.
3.2 Data, Measurement and Description of Variables
The study relies on balanced panel data of twenty-three (23) African countries covering a period of 2007–2018. The period of study and the number of countries considered are based on data availability and the necessity to have a balanced panel data structure. The list of the African countries can be found in the Appendix. Table 1 summarizes the sources of data and measurement of variables used for the study.
Table 1
Sources of Data and Measurement of Variables
|
Variables |
Measurements |
Sources of data used |
|
Total Factor Productivity (TFP) |
TFP level at current PPPs (USA=1) |
Penn World Table (PWT) version 9.1 database |
|
Capital stock (LCAP) |
The natural log of Capital stock |
PWT version 9.1 database |
|
Labour force employed (Lemp) |
The natural log of number of labour employed |
PWT version 9.1 database |
|
Global value chain participation (GVC) |
The natural log of GVC participation. The data are generated from EORA Multi-Region Input-Output tables (MRIOs). GVC index for a country is equal to Foreign value added (Backward GVC component) plus Forward GVC component of the index. ( Casella et al., 2019). |
UNCTAD‐EORA database |
|
Domestic value added (DVA) |
It is the natural log of DVA. It is used to measure the domestic value added in an economy’s exports using intermediate products demand matrix and final demand matrix. Domestic Value Added is embodied in the country’s exports (Casella et al., 2019). |
UNCTAD‐EORA database |
|
Foreign value added (FVA) |
It is measured as natural log of FVA and it is a proxy for foreign value added. According to UNCTAD, “Foreign Value Added is embodied in the country’s exports. It corresponds to the Backward GVC participation component of the GVC participation index”(Casella et al., 2019). |
UNCTAD‐EORA database |
|
Political institutional Index (Polity2) |
This is proxied as Polity2. The score ranges between +10 (for the most democratic countries) and -10 (for the most autocratic countries). |
Polity IV database |
|
Inflation (Inf) |
Inflation rate (annual percentage growth of CPI) |
World Development Indicators |
|
Trade openness (LOPEN) |
It is the natural log of the summation of export and import value divided by GDP. |
World Development Indicators |
|
Income level (LINC) |
It is measured as the natural log of GDP per capita. |
World Development Indicators |
|
Information and communication technology (LICT) |
This is an index that captures the level of ICT in Africa. |
African Infrastructural Development Index |
Note. Author’s compilation.
Table 2 presents the descriptive statistics of the variables. The table documents the mean and standard deviation of the GVC and its variants including the control variables. The mean is used to represent the average value of data, while standard deviation is a measure of dispersion of each data.
Table 2
Descriptive Statistics
|
Variable |
Obs. |
Mean |
SD |
Min |
Max |
|
TFP |
276 |
0.466 |
0.216 |
0.153 |
1.105 |
|
Inf |
276 |
6.355 |
5.163 |
-2.248 |
30.695 |
|
Polity2 |
276 |
2.764 |
4.993 |
-6 |
10 |
|
GVC |
276 |
6.009 |
0.786 |
4.682 |
7.829 |
|
DVA |
276 |
6.200 |
0.815 |
4.790 |
7.974 |
|
FVA |
276 |
5.528 |
0.727 |
4.243 |
7.332 |
|
LINC |
276 |
1.764 |
0.765 |
1.327 |
3.773 |
|
LOPEN |
276 |
1.820 |
0.186 |
1.316 |
2.209 |
|
LICT |
276 |
1.168 |
1.032 |
-2.586 |
1.820 |
|
Lemp |
276 |
0.616 |
0.593 |
-0.455 |
1.813 |
|
LCAP |
276 |
5.083 |
0.686 |
3.916 |
6.460 |
Note. Author’s computation.
The mean and standard deviations for total factor productivity and global value chain are 0.466, 0.216, 6.009, and 0.786, respectively. The values of mean and standard deviation are relatively moderate. This implies that the data do not suffer much outliers, and the extent of volatility is moderate. The value of standard deviation when compared with the mean values of most of the control variables is very small.
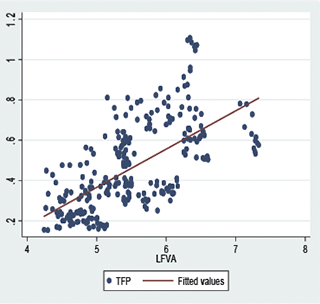
Table 3 presents the correlation coefficients between the variables. This is used to show the potential association between the study variables. The relationship between TFP and GVC is positive and significant. In addition, the association between TFP and the control variables is positive except for Lemp, which seems to be negative. There is no evidence of multicollinearity between the variables because the coefficients do not pass the threshold value of 0.80 (Field, 2009). Figures 3, 4 and 5 show the relationship between GVC and TFP, DVA and FVA, respectively. The figures illustrate that the three variants of value added display positive association with factor productivity. However, a better explanation can be obtained from the regression as presented in the subsections.
Table 3
Pairwise Correlation
|
|
TFP |
Inf |
Polity2 |
GVC |
DVA |
FVA |
LINC |
LOPEN |
LICT |
Lemp |
LCAP |
|
TFP |
1.000 |
|
|
|
|
|
|
|
|
|
|
|
Inf |
0.097 |
1.000 |
|
|
|
|
|
|
|
|
|
|
Polity2 |
0.128* |
0.037 |
1.000 |
|
|
|
|
|
|
|
|
|
GVC |
0.604* |
0.105 |
-0.054 |
1.000 |
|
|
|
|
|
|
|
|
DVA |
0.583* |
0.118* |
-0.073 |
0.393* |
1.000 |
|
|
|
|
|
|
|
FVA |
0.636* |
0.071 |
0.048 |
0.364* |
0.339* |
1.000 |
|
|
|
|
|
|
LINC |
-0.032 |
0.172* |
-0.132* |
0.011 |
0.028 |
-0.056 |
1.000 |
|
|
|
|
|
LOPEN |
0.187* |
-0.160* |
0.170* |
0.034 |
0.011 |
0.139* |
0.238* |
1.000 |
|
|
|
|
LICT |
0.241 |
-0.138* |
0.104* |
0.428* |
0.407* |
0.479* |
-0.065* |
0.152* |
1.000 |
|
|
|
Lemp |
-0.002 |
0.301* |
-0.243* |
0.487* |
0.517* |
0.399* |
-0.163 |
-0.597* |
0.071 |
1.000 |
|
|
LCAP |
0.516* |
0.134* |
-0.082 |
0.523* |
0.519* |
0.302* |
-0.117 |
-0.108 |
0.488* |
0.652* |
1.000 |
Note. *denotes significance at 5 percent. Source: Author’s computation.
Figure 3
Log of GVC (LGVC) and TFP (2007–2018)
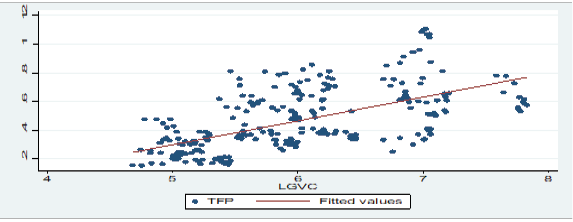
Note. Author’s computation, data from UNCTAD‐EORA database.
Figure 4
Log of FVA (LFVA) and TFP (2007–2018)
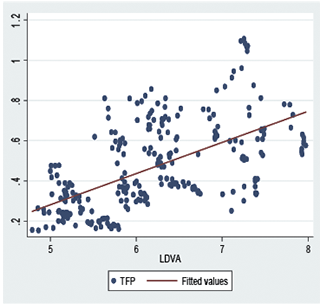
Figure 5
Log of DVA (LDVA) and TFP ((2007–2018)
Note. Author’s chart, data from UNCTAD‐EORA database
3.3 Empirical Strategies
The analysis takes the following procedures. The study subjects the variables to cross-sectional dependency (CD) test via Pesaran’s CD test. Due to the presence of CD in the variables, the study employs cross-sectional dependency’s panel unit root test popularly called Cross-Sectionally augmented Im-Pesaran-Shin (CIPS) Panel Unit Root test (Im et al., 2003; Pesaran, 2007). Panel corrected standard errors (PCSEs) is employed to initially estimate Equation 1. The technique is most appropriate for the case of short time dimension (T) with the presence of CD in the variables, and cross-sectional dimension (N) is at least greater than T (Chen et al., 2009; Ikpesu et al., 2019; Solano et al., 2019; Hazra, 2020; Ajide & Osinubi, 2020). For the purpose of addressing the potential endogeneity and reverse causality in the model, this study lags the variables by one period (Anser et al., 2021; Goel & Nelson, 2021). The robustness test of results is confirmed via instrumental variable (IV) estimation technique. The estimator is appropriate in dealing with endogeneity issues in a model. This technique also corrects for omission variables’ biasedness (Adeniyi et al., 2015). It is important to note that the above methodologies do not make provision for TFP determinants to categorize the conditional heterogeneous impacts. To address this deficiency, this study further employs the novel method of moments (MM)-Quantile Regression recently proposed by Machado and Santos (2019).
3.4 Method of Moment Panel Quantile Regression
The traditional estimation techniques within panel data framework including the PCSEs do not consider the impact of GVC on a country’s productivity at different levels of conditional quantiles. It would be of interest to know whether the results still hold under different quantile conditions (Solarin et al., 2022). Panel quantile estimation is more appropriate for addressing these issues. This technique is an advancement of the conventional methods of panel estimation that provides a complete representation of a conditional distribution.
The MM-Quantile regression is specified in equation (2).
 (2)
(2)
Other identities are as explained before except that ∅i and Ut are unobserved country and time fixed effects. QTFPit (τj/GVCit , Xit ) implies τjth conditional impact of TFP, dependent variable, while Xit represents all the explanatory variables in the model. Unlike other methods, this approach allows fixed effects to be implemented, and the technique is more appropriate in the situations where individual effects are rooted in the panel data structure. It offers quantile regression with non-crossing estimates (Anser et al., 2021). Through the location and scale variant estimates, the approach estimates the conditional quantiles. According to Machado and Santos (2019), this technique circumvents the likelihood of endogeneity including the issue of location shifters with the assumption that they have impacts on all the distributions of the dependent variable. The technique also allows time-invariant element to distinctively impact the distribution of the explained variable in the model. There are studies that have employed the use of panel quantile analysis to provide the differential impact of the explanatory variables due to differences in levels of explained variable (Bui et al., 2021; Ajide & Dada, 2022; Ajide, 2022; Solarin et al., 2022). In relation to time series analysis, the advantages of using panel data include less multicollinearity, the use of more observations and efficiency, and a robust degrees of freedom (Solarin et al., 2022).
4 Results and Discussion
4.1 Preliminary Tests
The latest development in panel econometrics literature reveals that the conventional techniques of panel data analyses may not be reliable in the presence of cross-sectional dependence (CD). Based on this, new techniques of conducting panel unit roots and CD have been proposed to overcome the challenges. For the purpose of determining the appropriate technique, this study conducts Pesaran's (2004) CD test. Due to the presence of spatial correlation, we examine the panel unit root of the variables via Cross-sectional augmented Im-Pesaran-Shin (CIPS) (Im et al., 2003; Pesaran, 2007).This panel unit root test is more powerful compared to the first generation panel unit root test, especially in the presence of CD. Table 2A in the appendix shows the results of the CD and CIPS panel unit root tests. Overall, we confirm that all the variables have the presence of CD except polity2, while the panel unit root test reveals that the variables are significant at level. This means that the issue of co-integration test is not relevant.
4.2 Empirical Results
Due to the presence of spatial correlation, this study estimates the model by employing the panel corrected standard errors (PCSEs). This technique is appropriate due to the number of cross-sectional units and a short time period of the data. The results of the estimates are documented in Table 4. The baseline model is reported in Column 1, showing that the coefficient of GVC is positive and statistically significant at 1 percent. This implies that GVC is one of the potential factors that can be used to enhance the total factor productivity in Africa. Columns 2 and 3 also document that the coefficients of FVA and DVA are positive and statistically significant at 1 percent. This is because most African economies have keyed into the GVCs by hosting the offshoring entrepreneurial firms from advanced economies. For instance, Southern African economies are actively engaged in GVC, thereby experiencing growth in FVA and DVA within the periods of study (Alhassan et al., 2021). This submission supports the results of Urata and Baek (2020). The authors document positive coefficients in respect of FVA and DVA, which is consistent with the expectation. Therefore, the results suggest that a greater participation in GVCs promotes the growth of TFP in African regions.
Table 4
Results of Panels Corrected Standard Errors (PCSEs) (Dependent Variable: TFP)
|
Variable |
(1) |
(2) |
(3) |
|
GVC |
0.126*** |
|
|
|
FVA |
|
0.148*** |
|
|
DVA |
|
|
0.112*** |
|
LOPEN |
-0.182*** |
-0.239*** |
-0.183*** |
|
LINC |
-0.023*** |
-0.012** |
-0.025*** |
|
Inf. |
0.006*** |
0.006*** |
0.006*** |
|
LICT |
-0.037*** |
-0.040*** |
-0.037*** |
|
Lemp |
-0.283*** |
-0.276*** |
-0.295*** |
|
LCAP |
0.202*** |
0.190*** |
0.219*** |
|
Polity2 |
0.001* |
0.0005 |
0.002* |
|
Constant |
-0.813*** |
-0.733*** |
-0.826*** |
|
R-squared |
0.562 |
0.566 |
0.560 |
|
Wald chi2 |
6157.74*** |
6734.52*** |
6333.79*** |
|
No. of group |
23 |
23 |
23 |
Note. *, ***, *** denote significance at 10%, 5% and 1% respectively. Figures in ( ) are P-values. Source: Author’s computation.
Turning to the control variables, the coefficient of political institutions is positive and significant. This implies that political institution is a very important factor influencing TFP growth in Africa. This is in agreement with Tebaldi (2016). He finds that the quality of institutions is the key to TFP growth, better institutions enhance productivity growth, technological progress and efficiency through the potential channels of GVC that promote knowledge and technological diffusion among economies in the world. Similar result is documented by Fadiran and Akanbi (2017) for the case of 26 sub-Saharan African countries over a period of 1990–2011. The authors find that institutional factors are very important for a long-run TFP growth. The coefficient of trade openness is negative and statistically significant. This confirms the analysis of Grossman and Helpman (1991), who argue that openness has a significant impact on productivity. Danquah et al. (2014) also documented a significant relationship between TFP and trade openness. Porter and Stern (2000), Eaton and Kortum (2001) found a negative association between trade openness, TFP and rate of innovation, which relates to the trade-off between technological efficiency and technical progress as they affect TFP growth (Valdes, 1999; Helpman & Rangel, 1999; Badunenko et al., 2008; Makiela, 2009).
In accordance to the study of Danquah et al. (2014), economies that import machinery to build up their technical capability tend to have higher technical progress compared to economies that import only final goods and services. Furthermore, the coefficient of labour force is negative and significant. This is consistent with the findings of Urata and Baek (2020). The coefficient of income level is negative and significant. This is consistent with theoretical analysis of Galor and Zeira (1993), Banerjee and Newman (1993), Galor and Moav (2004). They explain that the poor are being constrained in their choice to own and invest in a productivity investment resulting in low growth and high inequality. African economy has a lot of poor households, resulting in negative relationship between income and factor productivity (Bourguignon, 2004; Ngepah, 2016; He et al., 2020; Espoir & Ngepah, 2021). As expected, the coefficient of capital stock is positive and significant. More capital accumulation increases the level of TFP growth (Ajide, 2021). This is consistent with the analysis of Eberhardt and Teal (2013) and Lafuente et al. (2019). The coefficient of inflation is positive and significant, implying that macroeconomic stability promotes TFP. According to Barro and Sala-i-Martin (1995), an inflation rate that is more than 15 percent is considered an excess, and this may probably reduce the TFP growth in Africa. However, Akinlo and Adejumo (2016) reveal negative impact of inflation on TFP growth in Nigeria (Daude & Fernández-Arias, 2010; Abdullah & Chowdhury, 2020).
Table 5
Results from MM-Quartile Regression (Dependent Variable: TFP)
|
|
MM-Quartile regression |
||||
|
Variable |
Location |
Scale |
Q(0.25) |
Q(0.50) |
Q(0.75) |
|
GVC |
0.126*** |
0.036** |
0.095*** |
0.116*** |
0.153*** |
|
LOPEN |
-0.182** |
-0.008 |
-0.175* |
-0.180** |
-0.188** |
|
LINC |
-0.023 |
0.030*** |
-0.049*** |
-0.032* |
-0.001 |
|
Inf. |
0.006** |
0.005*** |
0.001 |
0.005 |
0.011*** |
|
LICT |
-0.037*** |
-0.004 |
-0.033*** |
-0.036*** |
-0.040*** |
|
Lemp |
-0.283*** |
0.173 |
-0.297*** |
-0.288*** |
-0.270*** |
|
LCAP |
0.202*** |
-0.003 |
0.205*** |
0.203*** |
0.199*** |
|
Polity2 |
0.001 |
-0.001 |
0.002 |
0.002 |
0.001 |
|
Constant |
-0.813*** |
-0.181* |
-0.662*** |
-0.764*** |
-0.948*** |
|
Fixed effect |
Yes |
Yes |
Yes |
Yes |
Yes |
|
No of group |
23 |
23 |
23 |
23 |
23 |
Note. *, ***, *** denote significance at 10%, 5% and 1% respectively. Figures in ( ) are P-values. Source: Author’s computation.
Table 6
Results from MM-Quartile Regression (Dependent Variable: TFP)
|
|
MM-Quartile regression |
||||
|
Variable |
Location |
Scale |
Q(0.25) |
Q(0.50) |
Q(0.75) |
|
FVA |
0.148*** |
0.022 |
0.128*** |
0.142*** |
0.165*** |
|
LOPEN |
-0.239*** |
0.021 |
-0.259*** |
-0.243*** |
-0.223** |
|
LINC |
-0.012 |
0.027** |
-0.038** |
-0.020 |
0.079 |
|
Inf. |
0.006* |
0.005** |
0.001 |
0.005 |
0.010** |
|
LICT |
-0.040*** |
-0.003 |
-0.036*** |
-0.039*** |
-0.043*** |
|
Lemp |
-0.276*** |
0.044* |
-0.317*** |
-0.288*** |
-0.243*** |
|
LCAP |
0.190*** |
0.002* |
0.188*** |
0.190*** |
0.193*** |
|
Polity2 |
0.001 |
0.000** |
0.001 |
0.001 |
0.001 |
|
Constant |
-0.733*** |
-0.182 |
-0.567*** |
-0.684*** |
-0.869*** |
|
Fixed effect |
Yes |
Yes |
Yes |
Yes |
Yes |
|
No of group |
23 |
23 |
23 |
23 |
23 |
Note. *, ***, *** denote significance at 10%, 5% and 1% respectively. Figures in ( ) are P-values. Source: Author’s computation.
Table 7
Results from MM-Quartile Regression (Dependent Variable: TFP)
|
|
MM-Quartile regression |
||||
|
Variable |
Location |
Scale |
Q(0.25) |
Q(0.50) |
Q(0.75) |
|
DVA |
0.112*** |
0.054*** |
0.065** |
0.102*** |
0.157*** |
|
LOPEN |
-0.183** |
-0.019 |
-0.167** |
-0.180** |
-0.199** |
|
LINC |
-0.025 |
0.025** |
-0.047*** |
-0.030* |
-0.003 |
|
Inf. |
0.006** |
0.005*** |
0.001 |
0.005* |
0.011*** |
|
LICT |
-0.037*** |
-0.003 |
-0.034*** |
-0.036*** |
-0.040*** |
|
Lemp |
-0.295*** |
0.013 |
-0.307*** |
-0.297*** |
-0.283*** |
|
LCAP |
0.219*** |
-0.025 |
0.241*** |
0.224*** |
0.198*** |
|
Polity2 |
0.002 |
-0.001 |
0.003 |
0.002 |
0.001 |
|
Constant |
-0.826*** |
-0.154* |
-0.693*** |
-0.797*** |
-0.955*** |
|
Fixed effect |
Yes |
Yes |
Yes |
Yes |
Yes |
|
No of group |
23 |
23 |
23 |
23 |
23 |
Note. *, ***, *** denote significance at 10%, 5% and 1% respectively. Figures in ( ) are P-values. Source: Author’s computation.
In addition, this study employs the MM-quantile regression technique to re-estimate the model. This allows us to examine the parameters of the relationship between GVC and TFP at median and other quantiles in which the heterogeneous features of each country are taken into consideration in accordance to the data generated process (Distante et al., 2018; Machado & Santos, 2019). This approach enables us to study the impact of GVC at different levels of TFP’s quantile distributional function in the presence of fixed effects. Table 5 shows the results based on global value chain (GVC), the results in Table 6 are based on foreign value added (FVA), and the results of Table 7 are based on domestic value added (DVA). All the results are obtained from MM-quantile regression with parameters in location and scale functions. One of the benefits of the MM-quantile estimate is that it can be applied to read non-linearity or polynomial functions in the model (Chernozhukov & Hansen, 2008; Canay, 2011; Polemis, 2019). It also allows us to estimate the model for the case of fixed effects. From the results, it is discovered that both scale and location suggest that an increase in the level of GVC improves the total factor productivity in Africa (location shift) and it does not reduce the dispersion of observed factor productivity (scale shift).
In specific, the location parameters reveal that GVC and its components will increase the average productivity in African countries. The scale parameter suggests that an increase in GVC would improve the dispersion of the productivity. The following results also emerged from MM-quartile estimates: inflation and capital stock are positive and significant. The coefficients of trade openness, income per capita, ICT and human capital are negative and significant. These results are not different from the PCSE results except that the coefficients are increasing as we move from lower quartiles to the higher quartiles. This suggests that the impacts of GVC on TFP are heterogeneous. The coefficients of GVC, FVA and DVA are positive and significant at 1 percent level. This also confirms the results under the PCSE estimations. The MM-quartile regression reveals that GVC has a positive impact on TFP in African economies at both lower (0.25), middle (0.50) and higher quartiles (0.75), and the magnitude impacts are heterogeneous. This suggests that suitable policy needs to be formulated based on the peculiarity of each economy to enhance total factor productivity.
For robustness checks, the study re-estimates the model via instrumental variable (IV) estimation technique. The estimator is appropriate in dealing with the endogeneity problem, specification errors and variable omission issue in a model. Following the literature, this study uses lag 1 to 2 as instruments (Adeniyi et al., 2015; Ferede, 2019; Moore et al., 2020). Unlike generalized method of moments, the technique is more appropriate for the case of a small sample size. The validity of the instruments is assessed via Hansen’s J-statistic (El Hamma, 2018). Table 7 presents the results of the estimation.
Table 8
Results of IV Regression (Dependent Variable: TFP)
|
Variable |
(1) |
(2) |
(3) |
|
GVC |
0.164*** |
|
|
|
FVA |
|
|
0.138*** |
|
DVA |
|
0.218*** |
|
|
LOPEN |
-0.116 |
-0.062 |
-0.219 |
|
LINC |
-0.081* |
-0.168** |
0.011 |
|
Inf. |
0.007** |
0.011*** |
0.003 |
|
LICT |
-0.036*** |
-0.027** |
-0.046*** |
|
Lemp |
-0.264*** |
-0.288*** |
-0.263*** |
|
LCAP |
0.140** |
0.069 |
0.196*** |
|
Polity2 |
0.0009 |
-0.002 |
0.002 |
|
Constant |
-0.770*** |
-0.718*** |
-0.786*** |
|
R-squared |
0.527 |
0.367 |
0.554 |
|
Wald chi2 |
446.23*** |
321.71*** |
561.65*** |
|
Hansen‘s J(P-value) |
0.609 |
0.251 |
0.243 |
|
Root MSE |
0.148 |
0.171 |
0.144 |
|
No. of group |
23 |
23 |
23 |
Note. *, ***, *** denote significance at 10%, 5% and 1% respectively. Figures in ( ) are P-values. Source: Author’s computation.
The results of IV-estimation further confirm that the coefficients of GVC, DVA and FVA are positive and significant at 1 percent level. The size of the coefficients of the IV-estimation is more than that of MM-QR and PCSEs. A one-percent increase in GVC, FVA and DVA improves the level of TFP by 16.4 percent, 13.8 percent and 21.8 percent, respectively. This shows that global value chains improve the level of factor productivity in the selected African nations.
4.3 Discussion
The results show that the impact of GVC on factor productivity is positive and significant across the quantiles. This positive outcome reveals that GVC comes with a lot of economic benefits to African nations. For instance, it gives access to a larger global market, which local firms may explore via scale economies, and possibility to learn on modern technology and innovations. It may facilitate connections to access cheaper and quality inputs for domestic production, and efficiency is further guaranteed. GVC may bring healthy competition in the local and global markets and may further pressurize the domestic firms to improve efficiency in productive structures. This outcome is in agreement with the findings of Ayadi et al. (2020), who used firm level data to show that GVC has a positive and significant impact on productivity, and Manghnani et al. (2021, who documented that service inputs and GVC participation for a period of 1990–2017 significantly improved productivity (also see Banh et al., 2020). These results have significant theoretical and policy implications.
First, in terms of theoretical implications, this study suggests that when modeling production function or production efficiency in Africa, there is a need to incorporate GVC as one of the explanatory variables. The study calls for the re-investigation of the established African economic model (Akinlo & Adejumo, 2016; Fadiran & Akanbi, 2017). In specific, the international production of goods and services should be re-investigated to know the role of GVC. There is a need to rethink on firms’ approach in outsourcing activities to further enhance efficiency in the production structures. With regard to policy implications, modalities should be put in place to reduce the costs of transportation and communication; given this policy and the level of digital technological development including mobile phone applications and internet usage, there should be an increase in the level of participation in GVC activities. African countries may also leverage on the new intercontinental free trade agreement to strengthen African value chains. This would provide market opportunities for local and foreign firms and further upgrade the GVC participation. Investments in key sectors like manufacturing would go a long way in addressing the challenges of low value-added exports that dominate the continent. Investment in digital infrastructure, energy and power would also assist in enhancing the GVC upgrading in most African countries. COVID-19 has reshaped the trends of industrialization in all regions. Therefore, it is worthwhile for African nations to seize the opportunities to integrate into the international value chains and improve the value-added outputs of African industries.
5. Conclusion
The recent trends show that the level of participation of African countries in GVC is improving, though dominated by exports of raw materials and other unprocessed commodities. The main purpose of this paper is to ascertain whether African countries’ participation in global value chain can improve the level of total factor productivity in the continent. This is achieved through the use of panel data of 23 African countries over a period of 2007–2018. The results, which are based on PCSE, IV-estimation technique and MM-panel quartile regression, reveal that there is a positive and significant relationship between global value chain participation and factor productivity in African economies, and the magnitude of impacts is heterogeneous. In specific, we discover that the impact of global value chain is positive and significant on TFP. Second, the impact of foreign value-added and domestic value-added on TFP is positive and significant. The coefficients of global value chains improve as we approach a higher quantile. This implies that African economies have the chance to benefit more as they increase the rate of participation. This study adds texture to the ongoing debate in respect of developing economies, and the findings have important implications to the practitioners and academicians. There is a need to put in place a conducive environment that can encourage firms to participate in global value chain. GVC allows firms and countries to benefit from technology diffusion. Firms learn more by having GVC’s arrangement with foreign countries, especially the ones with superior technologies and managerial sophistication. Minimal restrictions for international trade participation and adequate infrastructural facilities are recommended to improve the level of total factor productivity in Africa.
African governments need to, as a matter of urgency, actively formulate and promote policies that would increase the breadth and depth of the global value chain participation by Africans and ensure they make full use of value chains positively to strengthen the African productivity. While promoting firms or industries to expand the level of participation in global value chain, African governments should also pay attention to the heterogeneous impact of the global value chain on factor productivity. Government should support the small and business firms financially to make up their capital stock to enhance their level of participation in global value chain. Technical assistance to firms, especially African small businesses, on how to benefit from global value chain may go a long way in improving their participation and African productivity. It is also important to add that maintaining open economy and attracting foreign investors are paramount for Africans to participate in global value chain. Multilateral free trade agreements may facilitate an effective participation in global value chain in African business environment. Africa needs to formulate appropriate policies to attain sustainable macroeconomic stability, efficiency and maintenance of good political institutional framework to encourage mass participation in global value chain in the African continent.
Just like other studies, this study has limitations which open opportunities for future researchers. In our investigation, we pool a number of countries together in examining the impact of global value chain on productivity in Africa. There is a need to investigate what is obtainable from an individual country in Africa. This implies that country level study may provide a solution to this limitation. In addition, it may be worth conducting sectoral level analysis in Africa. Future studies can conduct firm-level and industry-level analysis to see if the results of this study still hold. Nevertheless, our study is one of the few that adds texture to the scanty literature on the relationship between productivity and value chain in Africa.
Disclosure and Declaration
Funding: The author receives no funding for this research.
Compliance with ethical standards
Conflict of interest: The author has no conflict of interest to declare.
Availability of data: Data used for this study would be made available upon a reasonable request.
References
Abdullah, M., & Chowdhury, M. (2020). Foreign Direct Investment and Total FactorProductivity: Any Nexus? Margin: The Journal of Applied Economic Research, 14(2), 164–190.
Abidin, N. Z., Basri, N. M., Rashid, I. M., & Sulaiman, N. F.(2021). The Effect of Economic Openness on Multifactor Productivity: Empirical Evidence from Selected AsianCountries. Journal of Asian Finance, Economics and Business, 8(12), 0075–0083.
Abizadeh, S., & Pandey, M. (2009). Trade Openness, Structural Change and Total Factor Productivity. International Economic Journal, 23(4), 545–559. DOI:10.1080/10168730903372273
Acemoglu, D., Johnson, S., & Robinson, J. A. (2001).The Colonial Origins of Comparative Development: An Empirical Investigation. The American Economic Review, 91(5),1–20.
Adeniyi, O., Ajide, B., & Salisu, A. (2015). Foreign Capital Flows, Financial Development and Growth in Sub-Saharan Africa. Journal of Economics and Development, 40(3), 85–103.
Ajao, O. A. (2003). Empirical Analysis of Agricultural Productivity Growth in Sub-Saharan Africa. Ogbomosho, Nigeria: Agricultural Economics and Extension Department, Ladoke Akintola University of Technology.
Ajide, F. M. (2021). Entrepreneurship and Productivity in Africa: The Role of Institutions. Journal of Sustainable Finance & Investment, 12(1), 147–168. DOI: 10.1080/20430795.2021.1939645
Ajide, F. M. (2022). Economic Complexity and Entrepreneurship: Insights from Africa. International Journal of Development Issues, 21(3), 367–388. DOI 10.1108/IJDI-03-2022-0047
Ajide, F. M., & Dada, T. J. (2022). The impact of ICT on shadow economy in West Africa. International Social Science Journal, 72(245), 749–767. DOI: 10.1111/issj.12337
Akinlo, A. E., & Adejumo, O. O. (2016). Determinants of Total Factor Productivity Growth in Nigeria, 1970–2009. Global Business Review, 17(2), 257–270.
Alhassan, A., Zoaka, J. D., & Ringim, S. H. (2021). Africa as headwaiter at the dining table of global value chains: Do institutions matter for her participation? African Development Review, 33(3), 560–576. https://doi.org/10.1111/1467-8268.12592
Amirkhalkhali, S., & Dar, A. (2019). Trade Openness, Factor Productivity, and Economic Growth: Recent Evidence from OECD Countries (2000–2015). Applied Econometrics and International Development, 19(1), 5–14.
Anser, M. K., Adeleye, B. K., Tabash, M. I., & Tiwari, A. K. (2021). Services trade–ICT–tourism nexus in selected Asian countries: New evidence from panel data techniques. Current Issues in Tourism, 25(2), 1–16. https://doi.org/10.1080/13683500.2021.1965554
Antràs, P. & De Gortari, A. (2020). On the Geography of Global Value Chains. Econometrica, 88(4), 1553–1598.
Ayadi, R., Giovannetti, G., Marvasi, E., & Zaki, C. (2020). Global Value Chains and the Productivity of Firms in MENA countries: Does Connectivity Matter?. (EMNES Working Paper No 28). EMNES website (www.emnes.org).
Badunenko, O., Henderson, D.,& Zelenyuk, V. (2008). Technological Change and Transition: Relative Contributions to Worldwide Growth During the 1990s. Oxford Bulletin of Economics and Statistics, 70(4), 461–492.
Baldwin, J. R., & Gu, W. (2004). Export market participation and productivity in Canadian manufacturing. Canadian Journal of Economics, 36(3), 634–657.
Baldwin, J., & Yan, B. (2014). Global Value Chains and the Productivity of Canadian Manufacturing Firms. Economic Analysis (EA) Research Paper Series, Catalogue no. 11F0027M — No. 090. Available at www.statcan.gc.ca
Banerjee, A., & Newman, A. (1993). Occupational Choice and the Process of Development. Journal of Political Economy,101(2), 274–298.
Banh, T. H., Wingender, P., & Gueye, A. C. (2020). Global Value Chains and Productivity: Micro Evidence from Estonia. (IMF working paper WP/20/117).
Barro, R. J., & Salai-Martin, X. (1995). Economic Growth. Mc Craw Hill.
Benkovskis, K., Masso, J., Tkacevs, O., Vahter, P., & Yashiro, N. (2020). Export and productivity in global value chains: Comparative evidence from Latvia and Estonia. Review of World Economics, 156(3), 557–577.
Bourguignon, F. (2004). The Poverty-Growth-Inequality Triangle. [Working Paper 125]. Indian Council for Research on International Economic Relations. New Delhi.
Bui, Q., Wang, Z., Zhang, B., Le, H. P., & Vu, K. D. (2021). Revisiting the biomass energy economic growth linkage of BRICS countries: A panel quantile regression with fixed effects approach. Journal of Cleaner Production, 316, 128382.
Canay, I. A., (2011). A simple approach to quantile regression for panel data. Econometrics Journal, 14(3), 368–386.
Casella, B., Bolwijn, R., Moran, D., & Kanemoto, K. (2019). Improving the analysis of global value chains: The UNCTAD-Eora Database. Transnational Corporations, 26(3), 115–142.
Chen, E. K. (1997). The Total Factor Productivity Debate: Determinants of Economic Growth in East Asia. Asian-Pacific Economic Literature, 11(1), 18–38.
Chen, X., Lin., S., & Reed, R. W. (2009). A Monte Carlo evaluation of the efficiency of the PCSE estimator. Applied Economics Letters, 17(1), 7–10. https ://doi.org/10.1080/13504 85070 17197 02
Chernozhukov, V., & Hansen, C., (2008). Instrumental Variable Quantile Regression: A Robust Inference Approach. Journal of Econometrics, 142(1), 379–398.
Criscuolo, C., & Timmis, J. (2017). The Relationship Between Global Value Chains and Productivity. International Production Monitor, 32, 61–83.
Danquah, M., Moral-Benito, E., & Ouattara, B. (2014). TFP Growth and its Determinants: Nonparametrics andA Model Averaging. (Banco de Espana Working paper No1104). DOI 10.1007/s00181-013-0737-y
Daude, C., & Fernández-Arias, E. (2010). On the Role of Productivity and Factor Accumulation in Economic Development in Latin America and the Caribbean. (IDB Working Paper No. 155). doi:10.2139/ssrn.1817273
Distante, R., Petrella, I., & Santoro E. (2018). Gibrat’s law and quantile regressions: An application to firm growth. Economics Letters, 164, 5–9.
Dutta, S. (February 2021). A Review of Literature of Global Value Chains. Available at SSRN http://dx.doi.org/10.2139/ssrn.3784163
Eaton J., & Kortum, S. (2001). Technology, Trade, and Growth: A Unified Framework. European Economic Review, 45(4-6), 742–755.
Eberhardt, M., & Teal, F. (2013). Structural Change and Cross-Country Growth Empirics. The World Bank Economic Review, 27(2), 229–271.
Efogo, F. O. (2020). Does trade in services improve African participation in global value chains? African Development Review, 32(4), 1–15. https://doi.org/10.1111/1467-8268.12476
El Hamma, I. (2018). Migrant Remittances and Economic Growth: The Role of Financial Development and Institutional Quality. Economics and Statistics, 503-504,123–142. https://doi.org/10.24187/ecostat.2018.503d.1961
Epifani, P. (2003). Trade liberalization, firm performance and labor market outcomes in the developing world: What can we learn from micro-level data? [Policy Research Working Paper No. 3063]. Washington, DC: World Bank.
Escaith, H., & Inomata, S. (2013). Geometry of global value chains in East Asia: The role of industrial networks and trade policies. In D. K. Elms & P. Low Eds.), Global Value Chains in a Changing World.
Espoir, D. K., & Ngepah, N. (2021). The effects of inequality on total factor productivity across districts in South Africa: A spatial econometric analysis. GeoJournal, 86, 2607–2638.
Fadiran, D., & Akanbi, O. A. (2017). Institutions and Other Determinants of Total Factor Productivity in Sub-Saharan Africa. [ERSA working paper 714]. Economic Research Southern Africa (ERSA), National Treasury of South Africa.
Feng, X., Xin, M., & Cui, X. (2020). Impact of Global Value Chain Embedding on Total-Factor Energy Productivity of Chinese Industrial Sectors. Journal of Renewable Energy, Article ID 6239640. https://doi.org/10.1155/2020/6239640
Ferede, E. (2019). Entrepreneurship and personal income tax: Evidence from Canadian provinces. Small Business Economics, 56(1), 1765–1781. https://doi.org/10.1007/s11187-019-00226-w
Fessehaie, J., & Morris, M. (2018). Global Value Chains and Sustainable Development Goals: What Role for Trade and Industrial Policies? International Centre for Trade and Sustainable Development (ICTSD).
Foster-McGregor, N., & Verspagen, B. (2016). The role of structural change in the economic development of Asian economies. Asian Development Review, 33(2), 74–93.
Fosu, A. K. (2012). Growth of African Economies: Productivity, Policy Syndromes and the Importance of Institutions. Journal of African Economies, 22(4), 523–551.
Fotopoulos, G. (2012). Nonlinearities in regional economic growth and convergence: The role of entrepreneurship in the European union regions. The Annals of Regional Science, 48, 719–741.
Galor, O., & Zeira, J. (1993). Income Distribution and Macroeconomics. The Review of Economic Studies, 60, 35–52.
Garzarelli, G., & Limam, Y. R. (2019). Physical capital, total factor productivity, and economic growth in sub-Saharan Africa. South African Journal of Economic and Management Sciences, 22(1), 1–10.
Giovannetti, G., & Marvasi, E. (2016). Food exporters in global value chains: Evidence from Italy. Food Policy, 59(C), 110–125.
Giovannetti, G., & Marvasi, E. (2017). Governance, value chain positioning and firms’ heterogeneous performance: The case of Tuscany. International Economics, 154(7), doi: 10.1016/j.inteco.2017.11.001.
Glaeser, E. L., La Porta, R, Lopez-de-Silanes, F., & Shleifer, A. (2004). Do institutions cause growth? Journal of Economic Growth, 9(3), 271–303.
Globerman, S., (2011). Global Value Chains: Economic and Policy Issues. In A. Sydor (Ed.), Global Value Chains: Impacts and Implications (pp. 17–42). Ottawa: Department of Foreign Affairs and International Trade.
Goel, R. K., & Nelson, M. A. (2023). Which political regimes foster entrepreneurship? An international examination. The Journal of Technology Transfer, 48, 128–148. https://doi.org/10.1007/s10961-021-09907-9
Griliches, Z. (1979). Issues in Assessing the contribution of Research and Development to Productivity Growth. The Bell Journal of Economics, 10(1), 92–116.
Grossman, G. M., & Helpman, E. (1991). Quality Ladders in the Theory of Growth. The Review of Economic Studies, 58(1), 43–61.
Haider, S., Ganaie, A., & Kamaiah, B. (2019). Total Factor Productivity and Openness in Indian Economy: 1970–2011. Foreign Trade Review, 54(1), 46–57.
Hazra, D. (2020). What Does (and Does Not) Affect Crime in India? International Journal of Social Economics, 47 (4), 503-521. http://dx.doi.org/10.2139/ssrn.3348197
He, W., Zhang, Y., Zhong, Y., & Chen, J. (2020). The impact of income gap on the inverted U-shaped total factor productivity and its mechanisms: Evidence from transnational-level analysis. PLoS One, 15(1), e0228023. https://doi.org/10.1371/journal.pone.0228023
Helpman, E., & Rangel, A. (1999). Adjusting to a New Technology: Experience and Training. Journal of Economic Growth, 4, 359–383.
Helpman, E., & Krugman, P. (1985). Market Structure and Foreign Trade. Cambridge, MA: MIT Press.
Hummels, D., Ishii, J., & Yi, K. M. (2001). The nature and growth of vertical specialization in world trade. Journal of International Economics, 54(1), 75–96.
Ikpesu, F., Vincent, O., & Dakare, O. (2019). Growth effect of trade and investment in Sub-Saharan Africa countries: Empirical insight from panel corrected standard error (PCSE) technique. Cogent Economics and Finance, 7, 1. https://doi.org/10.1080/23322 039.2019.1607127
Im, K. S., Pesaran, M. H., & Shin, Y. (2003). Testing for unit roots in heterogeneous panels. Journal of Econometrics, 115(1), 53–74.
Kelly, W. (2004). International Technology Diffusion. Journal of Economic Literature, 42(3), 752–782.
Kılıçaslan, Y., Aytun, U., & Meçik, O. (2021). Global Value Chain Integration and Productivity: The Case of Turkish Manufacturing Firms. Middle East Development Journal, 13. DOI: 10.1080/17938120.2021.1898189
Koopman, R., Wang, Z., & Wei, S-J. (2011). Give Credit Where Credit is Due: Tracing Value Addedin Global Production Chains. [NBER Working Paper no. 16426]. National Bureau of Economic Research.
Koopman, R., Wang, Z., & Wei, S-J. (2014). Tracing Value-Added and Double Counting in Gross Exports. American Economic Review, 104(2), 459–494.
Kordalska, A., Wolszczak-Derlacz, J., & Parteka, A. (2016). Global value chains and productivity gains: A cross-country analysis. Collegium of Economic Analysis Annals, (41), 11–28.
Kruger, S. M. (1985). Productivity and nest-site selection of Eastern Bluebirds in Wisconsin (Doctoral dissertation, University of Wisconsin-Stevens Point, College of Natural Resources).
Kumar, S., & Russell, R. R. (2002). Technological change, technological catch-up, and capital deepening: relative contributions to growth and convergence. American Economic Review, 92(3), 527–548.
Kummritz, V. (2016). Do Global Value Chains Cause Industrial Development?. [Centre for Trade and Economics Integration Working Paper No. 2016-01]. Geneva: Centre for Trade and Economics Integration.
Lafuente, E., Acs, Z. J., Sanders, M. & Szerb, L. (2019). The Global Technology Frontier: Productivity Growth and the Relevance of Kirznerian and Schumpeterian Entrepreneurship. Small Business Economics, 55, 153–178. doi:10.1007/s11187-019-00140-1
Li, J. & Tang, Y. (2019). Trade Openness, FDI and Total Factor Productivity. Macroeconomics, 9, 67–79.
Liu, C., & Saam, M. (2021). ICT and Productivity Growth Within Value Chains. The Review of Income and Wealth, 68(3), 711–737. DOI: 10.1111/roiw.12533
Liu, J., & Bi, C. (2019). Effects of Higher Education Levels on Total Factor Productivity Growth. Sustainability,11(6), 1790.
Machado, J. A. F., & Santos, S. (2019). Quantiles via moments. Journal of Econometrics, 213(1), 145–173.
Makiela, K. (2009). Economic Growth Decomposition. An Empirical Analysis Using Bayesian Frontier Approach. Central European Journal of Economic Modelling and Econometrics, 1(4),333–369.
Manghnani, R., Meyer, B., Saez, S., & Marel, D. E. (2021). Firm Performance, Participation in Global Value Chains and Service Inputs: Evidence from India. [Policy Research Working Paper 9814]. World Bank Group.
McMillan, M. S., & Rodrik, D. (2011). Globalization, structural change and productivity growth. In M. Bacchetta & M. Jansen (Eds.), Making Globalisation Socially Sustainable (pp. 49–84).
Moore, E. M., Dau, L. A., & Doh, J. (2020). Does Monetary Aid Catalyse New Business Creation? Analysing the Impact of Global Aid Flows on Formal and Informal Entrepreneurship. Journal of Management Studies, 57(3), 438–469. https ://doi.org/10.1111/joms.12552
Mouanda-Mouanda, G. (2019). Global Value Chains Participation for African Countries: An Overview from UIBE GVC Index System. Open Journal of Business and Management, 7, 941–962. doi:10.4236/ojbm.2019.72064
Nelson, R. R., & Nelson, K. (2002). Technology, institutions, and innovation systems. Research Policy, 31(2), 265–272.
Ngepah, N. (2016). In search of bad inequalities for growth and appropriate policy choices for their reduction in Africa. United Nations: Overseas Development Institute.
Nomaler, Ö., & Verspagen, B. (2014). Analysing global value chains using input-output economics: Proceed with care (MERIT Working Papers No. 2014-070).
North, D. (1990). Institutions, Institutional Change and Economic Performance. New York: Cambridge University Press.
Olasehinde-Williams, G., & Oshodi, A. F. (2021). Global value chains and export growth in South Africa: Evidence from dynamic ARDL simulations. Transnational Corporations Review. DOI: 10.1080/19186444.2021.1959833
Osinubi, T. T. (2020). Causality between total factor productivity and economic growth in Mexico, Indonesia, Nigeria and Turkey: A comparative analysis. International Journal of Business and Emerging Markets, 12(1), 1–10.
Pesaran, M. H. (2004). General Diagnostic Tests for Cross Section Dependence in Panels. (IZA Discussion Paper No. 1240).
Polemis, M. L. (2019). A note on the estimation of competition-productivity nexus: A panel quantile approach. (MPRA Paper No. 96808). https://mpra.ub.uni-muenchen.de/96808/
Porter, M., & Stern, S. (2000). Measuring the ‘Ideas’ Production Function: Evidence from International Patent Output. [NBER Working Papers 7891]. National Bureau of Economic Research, Inc.
Prete, D. D., Giovannetti, G., & Marvasi, E. (2017). Global value chains participation and productivity gains for North African firms. Review of World Economics, 153(4), 675–701. DOI: 10.1007/s10290-017-0292-2
Reddy, K. (2020). Financial Constraints and Global Value Chains Participation of Indian MSMEs. The Indian Economic Journal, 68(1), 118–121. DOI: 10.1177/0019466220946325
Rodrik, D. (1988). Imperfect Competition, Scale Economies, and Trade Policy in Developing Vountries. In Trade Policy Issues and Empirical Analysis (pp. 109-144). University of Chicago Press.
Romer, P. M. (1990). Endogenous technological change. Journal of Political Economy, 98(5), 71–102.
Seric, A., & Tong, Y. S. (2019). What are global value chains and why do they matter? Available at https://iap.unido.org/articles/what-are-global-value-chains-and-why-do-they-matter
Siba, E. (2022).Africa’s Development Dynamics: Regional Value Chains for a Sustainable, Recovery. OECD Publication. Retrieved from August 5, 2022 at https://www.oecd.org/dev/africa-s-development-dynamics-3290877b-en.htm
Solano, J., Camino-Mogro, S., & Armijos-Bravo, G. (2019). Intra-banking competition in Ecuador: New evidence using panel data approach. Journal of Economics, Finance and Administrative Science, 25(50), 295–319. https://doi.org/10.1108/JEFAS-05-2019-0081
Solarin, S. A., Bello, M. O., & Tiwari, A. K. (2022). The impact of technological innovation on renewable energy production: Accounting for the roles of economic and environmental factors using a method of moments quantile regression. Heliyon, 8(7), e09913.https://doi.org/10.1016/j.heliyon.2022.e09913
Solow, R. (1957).Technical Change and the Aggregate Production Function. The Review of Economics and Statistics, 39(3), 312–320.
Stiglitz, J. (2002). Globalization and Its Discontents. New York, NY: W. W. Norton.
Sydor, A. (2011). Editor’s Overview–Global Value Chains: Impacts and Implications. In A. Sydor (Ed.), Global Value Chains: Impacts and Implications (pp. 1–16).
Tachie, A. K., Xingle, L., Dauda, L., Mensah, C. N., Appiah-Twum, F., & Mensah, I. A. (2020). The influence of trade openness on environmental pollution in EU-18 countries. Environmental Science and Pollution Research, 27(28), 35535-35555. https://doi.org/10.1007/s11356-020-09718-9
Tebaldi, E. (2016). The Dynamics of Total Factor Productivity and Institutions. Journal of Economic Development, 41(4), 1–25.
UNCTAD (2013). World Investment Report: Global Value Chains: Investment and Trade for Development. UN Publication: Geneva, Switzerland.
Urata, S., & Baek, Y. (2020). Does Participation in Global Value Chains Increase Productivity? An Analysis of Trade in Value Added Data. Thailand and the World Economy, 38(1),1–28.
Valdes, B. (1999). Economic Growth: Theory, Empirics and Policy. Edward Elgar Publishing.
Wei, X. (2009). The Dynamic Relationship Among Openness, Human Capital, and Total Factor Productivity in China. World Economy Studies, (3), 9–15.
Yanikkaya, H., & Altun, A. (2018). The impact of participation in export value chains on TFP growth. Ege Academic Review,19, 119–129.
Yanikkaya, H., & Altun, A. (2020).The Impact of Global Value Chain Participation on Sectoral Growth and Productivity. Sustainability, 12(12), 4848; doi:10.3390/su12124848
Young, A. (1991). Learning by Doing and the Dynamic Effects of International Trade. The Quarterly Journal of Economics, 106(2), 369–405.
Appendix
Table 1A
List of African Countries Used in the Study
|
Angola Botswana Burundi Cameroon Central African Republic Egypt Gabon Kenya Lesotho Mauritania Mauritius Morocco |
Mozambique Namibia Niger Nigeria Rwanda Senegal Sierra Leone South Africa Togo Tunisia Tanzania
|
Source: compiled by the author.
Table 2A
Cross-sectional Dependent (CD) Test and Panel Unit Root Tests
|
Variable |
Pesaran ’s CD Tests |
CIPS-panel unit root at level |
|
TFP |
17.947*** |
-2.259** |
|
LGVC |
46.607*** |
-2.218** |
|
Inf |
14.400*** |
-2.246** |
|
LINC |
40.117*** |
-3.421*** |
|
LFVA |
42.371*** |
-2.819*** |
|
LDVA |
40.325*** |
-2.497*** |
|
LOPEN |
9.999*** |
-2.540*** |
|
LICT |
54.682*** |
-3.090*** |
|
Lemp |
52.036*** |
-2.156* |
|
LCAP |
52.631*** |
-2.955*** |
|
Polity2 |
1.696 |
-3.754*** |
Note. *, ***, *** denote significance at 10%, 5% and 1% respectively. Source: Author’s computation.