Organizations and Markets in Emerging Economies ISSN 2029-4581 eISSN 2345-0037
2023, vol. 14, no. 3(29), pp. 600–620 DOI: https://doi.org/10.15388/omee.2023.14.7
A Roadmap to a Successful Exchange Rate Regime Transition: Takeaways from 6 African Transitions
Hamza Bouhali (corresponding author)
Mohammadia School of Engineering (EMI), Mohammed V University, Morocco
hamzaelbouhali@gmail.com
https://orcid.org/0000-0003-4846-2979
Ahmed Dahbani
Business Intelligence, Governance of Organizations, Finance and Financial Crime Laboratory
(BIGOFCF), Hassan II University, Morocco
dahbani24@gmail.com
https://orcid.org/0000-0003-3257-0609
Brahim Dinar
Business Intelligence, Governance of Organizations, Finance and Financial Crime Laboratory
(BIGOFCF), Hassan II University, Morocco
dinarbrahim59@gmail.com
Abstract. This article investigates the role of monetary policies in the success of exchange rate regime transition and the mitigation of related risks. We adopted a comparative methodology for three types of regime switches using 3 GARCH family models and data from 6 African countries over two decades. Our main findings are that a gradual and well-prepared transition improves its outcome and allows the market more flexibility in absorbing domestic and external volatilities, even during a crisis. The results of this study will provide policymakers with a road map to succeed in the exchange rate regime transition and mitigate the inherent risks.
Keywords: exchange rate regime, monetary policy, GARCH, COVID-19
Received: 6/12/202. Accepted: 30/10/2023
Copyright © 2023 Hamza Bouhali, Ahmed Dahbani, Brahim Dinar. Published by Vilnius University Press. This is an Open Access article distributed under the terms of the Creative Commons Attribution Licence, which permits unrestricted use, distribution, and reproduction in any medium, provided the original author and source are credited.
1. Introduction
In the early 1970s, countries worldwide were urged to adopt a new foreign exchange (FX) regime to absorb market movements and support their economies following the collapse of the Bretton Wood agreements. Most countries chose to peg their currencies to one or more major currencies to maintain market stability and promote foreign direct investments. This rigidity turned out to be a deadly liability to many emerging economies since the early 1990s, with successive crises hitting the world economy during this period. During the following decades, many countries switched to flexible or floating rates in abrupt ways, which significantly impacted their economies.
As of 2021, only 33.2% of world economies effectively adopted a floating regime, 47.7% are in a soft peg or intermediate regime, and 13% are still with hard pegged regimes (International Monetary Fund, 2021). According to the same report, only 13% of African economies adopted floating, while 79% are still in soft pegged arrangements. These ratios are much lower than the worldwide regional average of 31%. This gap in exchange rate regime development is caused by various economic and institutional phenomena such as the fear of float (as described by Calvo and Reinhart (2002)), the lack of independent monetary policy (the case of CFA franc countries) and the high rates of financial corruption. This situation severely challenges African economic growth and sustainability, considering the increasing importance of trade and global integration.
The COVID-19 pandemic brought serious disturbance to African financial markets, especially the FX ones, as the successive lockdowns and the unorthodox monetary policies adopted by governments put enormous pressure on the exchange rate regimes in many countries and forced the central bank to intervene. This episode exposed the fragility of pegged exchange rate regimes and how tough it is to defend the domestic currency against external shocks during a global economic crisis.
In this article, we conduct a comparative analysis of the foreign exchange regime transition in 6 major African economies using three models from the GARCH family and a data set for over 20 years. Our goal is to provide policymakers, especially in Africa and developing markets, with an analysis of various monetary policies and reforms often implemented during a foreign exchange regime transition. The study results will help them build a roadmap to succeed in the regime transition by choosing the most efficient policies and preparing the appropriate mitigating plans for the risks linked to this process. We organized our paper as follows: we start with an introduction in Section 1, then a literature review in the 2nd section. We then present the data and the models in Section 3 before presenting and discussing the empirical results in Section 4. Finally, we end our article with a conclusion in Section 5, summarizing the results and providing suggestions for future studies.
2. Literature Review
To fix or float has been a commonly discussed problem in the economic literature since the early 2000s. With emerging Asian and South American economies switching to flexible or floating regimes, many researchers such as as Husain et al. (2004), Hagen and Zhou (2005), Markievicz (2006), Fouda et al. (2021) and more recently Chen and Ward (2022), discussed the optimal exchange rate regime and presented a detailed diagnosis regarding the behavior of macroeconomic aggregates in each one of them. However, only a few focused on the regime transition process and the factors contributing to its success or failure.
One of the first studies to tackle this problem was Masson and Ruge-Murcia (2005), who studied the transition triggers in the exchange rate regime. The main results of the authors are that poor economic conditions such as high inflation, low growth and weak trade openness amplify the risk of a forced switch. Moreover, foreign exchange reserves are a significant factor in the transition for emerging markets due to the lower capital mobility compared to developed economies. Hossain (2008, 2011) provided comparative studies for six East Asian emerging countries to assess the impact of each transition on the macroeconomic aggregates. The researcher concluded that while fixed regimes may offer better economic development and lower inflation in the short term, flexible regimes are better fitted for a higher degree of trade openness, more sustainable development and more efficient fiscal performance. Also, floating regimes are more prone to crisis due to their macroeconomic vulnerability. These results were corroborated by a recent study by Yu (2022), who analyzed transitions in 93 countries between 1970 and 2010.
Yoshino et al. (2016) adopted another methodology to find the optimal exchange rate regime transition policy in China and Thailand. The findings showed that the US Dollar peg is only desirable in the short run, indicating that the economies would benefit more from transitioning to a flexible or floating regime. Another significant finding is the importance of a gradual and sufficiently long transition needed to ensure the economic adaptation of the domestic market. Finally, the study stressed the danger of a sudden switch, especially regarding the loss of monetary policy autonomy needed to stabilize the market during turbulent times. This research was extended by Yoshino and Asonuma (2017) to include Malaysia and Singapore and yielded similar results. The authors also detected a spillover effect in regime transition as satellite economies tend to follow the regime choice of their primary economic partner.
Another stream is presented by Kemme and Lyakir (2011) through a detailed analysis of the Czech exchange rate regime transition, considered by many economists as a successful case study. The research exhibited the role of central bank credibility in preparing the prerequisites to a successful transition through constant and transparent communication. Moreover, this methodology allowed the Czech Central National Bank (CNB) to improve the market resilience to external shocks and avoid the “fear of floating” phenomenon. Other case studies are presented by Khan and Tajnin (2019) for Bangladesh and Tenoy (2021) for South Sudan. Although both researchers adopted a restrictive approach to small economies, these two studies yielded exciting results regarding the importance of regime transition as a step toward global integration and its impact on domestic market performance. They also pointed out the risks linked to the transition and the importance of good preparation in mitigating them successfully.
To sum up, we observe a rich body of literature regarding the choice of exchange rate regime and the impact of each option on economic data. However, we can’t help but notice a void regarding the keys to the successful conduct of the regime transition. As more than 66% of the world’s countries are still adopting fixed or pegged regimes, policymakers desperately need econometric and empirical literature to assist them in navigating the transition. In this article, we will conduct a thorough comparative analysis of 3 types of regime transition in Africa to point out the role of appropriate monetary policies in the success of the transition process and exhibit the eventual risk that policymakers could face during and after the regime switch.
3. Data and Mathematical Framework
3.1 DATA
We used daily closing exchange rates against the US Dollar from six African countries, Morocco, Tunisia, South Africa, Nigeria, Egypt and Kenya, extracted from central banks’ official websites. We chose the EUR/USD pair as a proxy to evaluate the interdependence with the global market. This choice is motivated by the predominance of this currency pair in the daily exchanges (87.6% of worldwide trading, according to the Bank of International Settlement (BIS)). These time series are obtained from the Website of the European Central Bank.
To conduct a practical comparative study, we split our dataset into three periods listed in Table 1: the fixed or administrated period, which will be used as a comparison base; the flexible or floating period; and the COVID-19 pandemic period. Finally, we organize these countries by transition types to avoid bias.
Table 1
The List of Subperiods for the Studied Countries
|
Type of transition |
Country |
Period |
Currency |
Sample period |
|
Frontier economies with a transition from a fixed to a flexible intermediary regime |
Morocco |
P1 |
USD/MAD |
From 01-01-2003 to 12-01-2018 |
|
P2 |
From 13-01-2018 to 31-12-2019 |
|||
|
P3 |
From 01-01-2020 to 31-12-2021 |
|||
|
Tunisia |
P1 |
USD/TND |
From 01-01-2000 to 31-12-2014 |
|
|
P2 |
From 01-01-2015 to 31-12-2019 |
|||
|
P3 |
From 01-01-2020 to 31-12-2021 |
|||
|
Emerging economies with a transition from an administrated regime to a floating exchange rate |
South Africa |
P1 |
USD/ZAR |
From 01-01-1990 to 31-12-1995 |
|
P2 |
From 01-01-1996 to 31-12-2019 |
|||
|
P3 |
From 01-01-2020 to 31-12-2021 |
|||
|
Nigeria |
P1 |
USD/NGN |
From 01-01-1996 to 17-06-2016 |
|
|
P2 |
From 20-06-2016 to 31-12-2019 |
|||
|
P3 |
From 01-01-2020 to 31-12-2021 |
|||
|
Rapidly growing economies with a direct transition from a fixed to a floating regime |
Kenya |
P1 |
USD/KES |
From 03-01-1991 to 31-12-1994 |
|
P2 |
From 01-01-1995 to 31-12-2019 |
|||
|
P3 |
From 01-01-2020 to 31-12-2021 |
|||
|
Egypt |
P1 |
USD/EGP |
From 01-01-2006 to 02-11-2016 |
|
|
P2 |
From 03-11-2016 to 31-12-2019 |
|||
|
P3 |
From 01-01-2020 to 31-12-2021 |
Figure 1
Plot of the Studied Currency Pairs Against the US Dollar
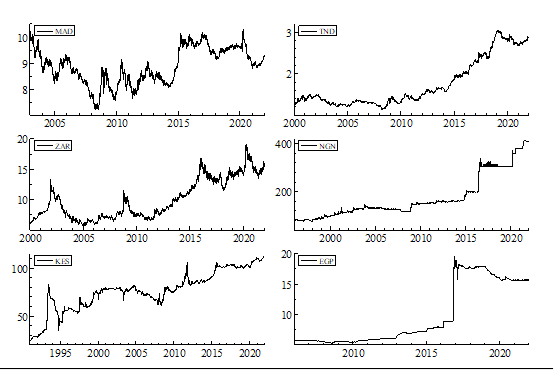
The series plot presented in Figure 1 shows interesting information about the exchange rate regimes’ evolution in the studied countries. We notably observe a constant depreciation of all the studied currencies against the US dollar starting from 2015. This observation is caused by a greenback rally resulting from the performance gap between the US and the world economy, especially in Europe, where the EU was trying to mitigate the effects of successive debt crises. We also notice multiple spikes during the early 2000s in Morocco Dirham due to poor monetary policy by the central bank when faced with a significant FDI inflow following extensive privatizations. The Tunisia Dinar graph shows a striking uptrend following the 2011 Arab Spring Revolution events. This rise is amplified by the difficult economic situation that forced the switch to a flexible regime. For the South African Rand, the graph shows clear spikes during international crises, notably the 2008 financial crisis and the early stages of the COVID-19 pandemic. The Nigerian Naira and Egyptian Pound exhibit a floor-like movement with significant spikes following the forced transition to floating regimes. Finally, the Kenyan Shilling graph manifests visible perturbation during the transition to floating but stabilizes over the following years. Also, we notice spikes during major crises such as the Asian crisis, the 2008 financial crisis and the 2011 euro zone crisis.
Table 2
Descriptive Statistics for Morocco and Tunisia Closing Rates over the Studied Periods
|
|
USD/MAD |
USD/TND |
||||
|
P1 |
P2 |
P3 |
P1 |
P2 |
P3 |
|
|
Mean |
8.751977 |
9.502810 |
9.247552 |
1.394626 |
2.409683 |
2.788870 |
|
Median |
8.636450 |
9.539100 |
9.135200 |
1.368750 |
2.396200 |
2.783800 |
|
Maximum |
10.24050 |
9.746800 |
10.31000 |
1.866800 |
3.065700 |
2.942500 |
|
Minimum |
7.201750 |
9.125200 |
8.790800 |
1.143400 |
1.864700 |
2.674500 |
|
Dev Std. |
0.701566 |
0.158143 |
0.361333 |
0.141915 |
0.362105 |
0.062876 |
|
Skewness |
0.203577 |
-0.91638 |
0.929214 |
0.852617 |
0.272866 |
0.248247 |
|
Kurtosis |
2.236414 |
2.859548 |
2.902123 |
3.395814 |
1.791643 |
1.996558 |
|
Jarque Bera |
119.8452 |
67.85742 |
72.00850 |
492.6169 |
90.82741 |
26.06031 |
|
JB P-Value |
0.000000 |
0.000000 |
0.000000 |
0.000000 |
0.000000 |
0.000002 |
The descriptive statistics in Table 2 show a platykurtic distribution for the Moroccan closing rates over all the periods, with a positive asymmetry except following the regime in 2018. This change in sign may be attributed to the successive shocks observed in the Moroccan market during this period after the widening fluctuation bands. We notice a leptokurtic distribution in Tunisia during the first period, characterized by a tight crawling peg regime. Following the forced transition to a flexible regime, the distribution became platykurtic due to the increased flexibility in the market. The distribution remained positively asymmetric during the period.
Table 3 exhibits a platykurtic distribution for the South African closing rate over all periods with a relatively small negative asymmetry during the managed period. The positive asymmetry slightly increased after the switch to the floating regime. Another observation is the platykurtic distribution of the Nigerian Naira in the fixed regime period with a slight positive asymmetry. However, after the rough switch to floating, the distribution became leptokurtic with a high negative asymmetry due to economic shocks and the continuous development of a parallel market.
Table 3
Descriptive Statistics for South Africa and Nigeria Closing Rates over the Studied Periods
|
|
USD/ZAR |
USD/NGN |
||||
|
P1 |
P2 |
P3 |
P1 |
P2 |
P3 |
|
|
Mean |
3.125033 |
8.653489 |
15.61337 |
130.6961 |
306.3538 |
378.2304 |
|
Median |
3.134750 |
7.677900 |
15.15510 |
129.0000 |
305.7500 |
380.7000 |
|
Maximum |
3.700000 |
16.86640 |
19.09460 |
205.9000 |
340.0000 |
411.7000 |
|
Minimum |
2.503000 |
3.621500 |
13.43460 |
73.10000 |
198.6000 |
305.8800 |
|
Dev Std. |
0.410647 |
3.035879 |
1.306666 |
31.47887 |
6.692185 |
31.44205 |
|
Skewness |
-0.03580 |
0.705122 |
0.761180 |
0.237017 |
-4.80723 |
-1.10319 |
|
Kurtosis |
1.423020 |
2.455934 |
2.672219 |
2.613496 |
3.30188 |
3.622023 |
|
Jarque Bera |
150.3503 |
583.5743 |
50.42021 |
81.97348 |
237650.2 |
109.2609 |
|
JB P-Value |
0.000000 |
0.000000 |
0.000000 |
0.000000 |
0.000000 |
0.000000 |
Table 4
Descriptive Statistics for Kenya and Egypt Closing Rates over the Studied Periods
|
|
USD/KES |
USD/EGP |
||||
|
P1 |
P2 |
P3 |
P1 |
P2 |
P3 |
|
|
Mean |
45.17039 |
78.89847 |
107.9579 |
6.343709 |
17.45639 |
15.71124 |
|
Median |
36.51500 |
78.15000 |
108.3500 |
5.945500 |
17.65000 |
15.67000 |
|
Maximum |
82.95000 |
106.2500 |
113.0500 |
14.75000 |
19.62000 |
16.22500 |
|
Minimum |
23.83650 |
43.10000 |
100.2500 |
5.282500 |
14.75000 |
15.51000 |
|
Dev Std. |
17.71455 |
14.56223 |
2.952061 |
0.990785 |
0.697768 |
0.129342 |
|
Skewness |
0.508084 |
0.041540 |
-0.95622 |
1.336640 |
-0.89044 |
1.941200 |
|
Kurtosis |
1.780534 |
2.428297 |
3.819410 |
5.060528 |
3.494619 |
6.402120 |
|
Jarque Bera |
98.37304 |
88.85999 |
90.00508 |
1314.850 |
110.8847 |
554.0448 |
|
JB P-Value |
0.000000 |
0.000000 |
0.000000 |
0.000000 |
0.000000 |
0.000000 |
The descriptive statistics of the Kenyan Shilling listed in Table 4 show a platykurtic distribution with a slight positive asymmetry during both the fixed and the floating periods. During the COVID-19 pandemic, the distribution became leptokurtic and negatively asymmetric due to the shocks of Kenyan economy. As international demand collapsed, the horticultural industry struggled, significantly impacting the country’s exports. For the Egyptian pound, we notice a solid leptokurtic distribution over all the periods, with a slight drop in intensity after the forced transition to floating. We also observe a positive asymmetry during the fixed regime and COVID-19 periods compared to the one following the forced transition.
Table 5
Results of Augmented Dickey-Fuller for our DATA in Level and First Difference over all the Periods of Study
|
Country |
Period Number |
|
Level data |
1st difference |
Stationarity |
|
USD/MAD |
P1 |
Value |
-2.3401 |
-61.5073 |
I(1) |
|
P-Value |
0.1594 |
0.0001 |
|||
|
P2 |
Value |
-1.8213 |
-20.6995 |
I(1) |
|
|
P-Value |
0.3700 |
0.0000 |
|||
|
P3 |
Value |
-1.1368 |
-20.2466 |
I(1) |
|
|
P-Value |
0.7025 |
0.0000 |
|||
|
USD/TND |
P1 |
Value |
0.3995 |
-71.6908 |
I(1) |
|
P-Value |
0.9830 |
0.0000 |
|||
|
P2 |
Value |
-1.0806 |
-35.6960 |
I(1) |
|
|
P-Value |
0.7253 |
0.0000 |
|||
|
P3 |
Value |
-1.5538 |
-29.366 |
I(1) |
|
|
P-Value |
0.5055 |
0.0000 |
|||
|
USD/ZAR |
P1 |
Value |
-0.7098 |
-36.6068 |
I(1) |
|
P-Value |
0.8423 |
0.0000 |
|||
|
P2 |
Value |
-0.1768 |
-54.849 |
I(1) |
|
|
P-Value |
0.9390 |
0.0001 |
|||
|
P3 |
Value |
-1.6522 |
-13.994 |
I(1) |
|
|
P-Value |
0.4551 |
0.0000 |
|||
|
USD/NGN |
P1 |
Value |
0.0724 |
-22.1141 |
I(1) |
|
P-Value |
0.9637 |
0.0000 |
|||
|
P2 |
Value |
-1.7139 |
-40.7817 |
I(1) |
|
|
P-Value |
0.4862 |
0.0000 |
|||
|
P3 |
Value |
-2.0440 |
-25.6406 |
I(1) |
|
|
P-Value |
0.2680 |
0.0000 |
|||
|
USD/KES |
P1 |
Value |
-1.1965 |
-27.9072 |
I(1) |
|
P-Value |
0.6779 |
0.0000 |
|||
|
P2 |
Value |
-1.7906 |
-57.4462 |
I(1) |
|
|
P-Value |
0.3856 |
0.0000 |
|||
|
P3 |
Value |
-1.6495 |
-14.8514 |
I(1) |
|
|
P-Value |
0.4564 |
0.0000 |
|||
|
USD/EGP |
P1 |
Value |
1.8764 |
-52.5293 |
I(1) |
|
P-Value |
0.9998 |
0.0000 |
|||
|
P2 |
Value |
-1.1686 |
-14.0501 |
I(1) |
|
|
P-Value |
0.6528 |
0.0000 |
|||
|
P3 |
Value |
-2.6561 |
-25.6493 |
I(1) |
|
|
P-Value |
0.3826 |
0.0000 |
The stationarity condition is an essential requirement for the GARCH models. Therefore, we use the increased Dickey-Fuller check (ADF) to test the stationarity. The ADF check results in Table 5 show the stationarity for the first difference in all the studied series. Therefore, we used the first difference data in GARCH models.
3.2 Mathematical Framework
3.1.1 GARCH. The Generalized Autoregressive Conditional Heteroskedasticity (GARCH) was introduced by (Bollerslev, 1986) as an extension of the ARCH model. The general form of the model is written as follows:
 (1)
(1)
where p and q are positive integers, and  This model is characterized by the various variables modeling the conditional volatility equation; α0 is considered to have minimal volatility, αi exhibits the impact of past shocks on the current volatilities and βi represents the contribution of past volatility to the current one. The sum αi + βi is often used to assess the persistence of volatility over the period.
The GARCH (1,1) model version is widely used in the economic literature to capture the volatility of high-frequency data. Studies such as Hunsen and Lunde (2005), Miah and Rahman (2016) and Nugroho et al. (2019) conducted comparative studies on hundreds of GARCH family models and found GARCH(1,1) to be highly efficient in approaching conditional volatility of various financial assets including the stocks, foreign exchange and bonds.
The main element of the model is the conditional volatility, which we express for GARCH(1,1) as follows:
 (2)
(2)
3.1.2 FIGARCH. Baillie et al. (1996) introduced the FIGARCH (Fractionally integrated generalized autoregressive conditional heteroskedasticity) model to overcome the limitations of the IGARCH model (integrated GARCH). The major drawback of IGARCH was the infinite volatility that the model might yield, which contradicts the dynamic of financial markets. This model was first used to capture the long memory processes in the Deutschmark–US Dollar exchange rates between 1979 and 1992.
The general form of the FIGARCH(1,d,1) model is presented as follows:
 (3)
(3)
where:
μ: The logarithmic yield average
yt: The mean’s equation error terms
ψt: The available information at the instant t
d: The fractional integration parameter
L: The lag operator
D(.,.): The conditional distribution
The model is characterized by the fractional integration parameter d that represents the lasting effect of the volatility. This metric, whose value is between 0 and 1, is used to evaluate the long memory process of the model.
3.1.3 DCC-GARCH. Engle (2002) introduced the dynamic conditional correlations model, commonly named the DCC model, to estimate dynamic correlations between conditional volatilities of time series. The model is estimated by first computing conditional volatilities using the GARCH methodology and then calculating the dynamic correlations between the standardized residues.
The general form for the model is generally expressed as follows:
Ht = Dt Γt Dt (4)
where
 (5)
(5)
 (6)
(6)
 (7)
(7)
The variance-covariance matrix must be positive and definite, which implies by transitivity that Dt and Γt matrices should have the same properties because Ht = Dt Γt Dt . A  is always positive, and the condition is verified. To ensure the positivity of Γt matrix, we must make sure that
  therefore, we decompose the dynamic correlation matrix into the following form:
 (8)
(8)
with Qt = (1 – αDCC – βDCC )Q´ + αDCCεt–1 ε't–1 + βDCCQt–1, diag{Qt} and Qt are diagonal matrices that can be written in the following forms:
 (9)
(9)
 (10)
(10)
The condition of positivity and definiteness for the Qt matrix implies that Γt is also positive and definite.
In the DCC GARCH(1,1) used in this article, ρdcc is the constant and doesn’t impact either shocks or volatility of the model. αdcc parameter can be used to assess the evolution of the shocks transmission and βdcc for evaluating volatility transmission.
4. Empirical Results
4.1 Frontier Economies with a Transition from a Fixed to a Flexible Intermediary Regime
Table 6
GARCH (1,1) Results for Morocco and Tunisia Cases
|
|
USD/MAD |
USD/TND |
|||||
|
P1 |
P2 |
P3 |
P1 |
P2 |
P3 |
||
|
α0 106 |
Coeff |
0.00376 |
0.09557 |
0.13102 |
0.10509 |
0.09278 |
0.02678 |
|
p-value |
0.06834 |
0.03229 |
0.02040 |
0.04400 |
0.01470 |
0.00150 |
|
|
α1 Impact of past shocks |
Coeff |
0.01145 |
0.03284 |
0.07038 |
0.03004 |
0.10102 |
0.15749 |
|
p-value |
0.06840 |
0.02890 |
0.0004 |
0.00000 |
0.00070 |
0.00020 |
|
|
β1 Impact of past volatilities |
Coeff |
0.98581 |
0.95162 |
0.91646 |
0.96563 |
0.87749 |
0.70133 |
|
p-value |
0.00000 |
0.00000 |
0.00000 |
0.00000 |
0.00000 |
0.00000 |
|
|
α1+β1 |
0.99727 |
0.98447 |
0.98685 |
0.99567 |
0.97852 |
0.85883 |
|
|
Log-likelihood |
3020.23 |
2228.22 |
2231.75 |
10338.30 |
4855.69 |
1988.47 |
|
Table 7
FIGARCH (1,d,1) Results for Morocco and Tunisia
|
|
USD/MAD |
USD/TND |
|||||
|
P1 |
P2 |
P3 |
P1 |
P2 |
P3 |
||
|
α0 106 |
Coeff |
0.04260 |
0.08424 |
0.11344 |
0.25334 |
0.66391 |
0.81731 |
|
p-value |
0.01201 |
0.06160 |
0.0362 |
0.01759 |
0.02805 |
0.02276 |
|
|
α1 |
Coeff |
0.04022 |
0.36405 |
0.17188 |
0.46852 |
0.48523 |
0.17276 |
|
p-value |
0.01789 |
0.00740 |
0.01548 |
0.00090 |
0.00120 |
0.05105 |
|
|
β1 |
Coeff |
0.95227 |
0.78146 |
0.66885 |
0.85492 |
0.71052 |
0.22562 |
|
p-value |
0.00000 |
0.00000 |
0.00987 |
0.00000 |
0.00090 |
0.04534 |
|
|
d Long memory process |
Coeff |
0.90765 |
0.45730 |
0.495559 |
0.51687 |
0.43447 |
0.57799 |
|
p-value |
0.00000 |
0.03990 |
0.02757 |
0.01880 |
0.01560 |
0.04140 |
|
|
Log-likelihood |
15748.80 |
2228.73 |
2232.91 |
15204.00 |
4868.33 |
1985.1 |
|
Table 8
DCC GARCH (1,1) Results for the Interdependence with the International Market Pair for Morocco and Tunisia
|
|
USD/MAD |
USD/TND |
|||||
|
P1 |
P2 |
P3 |
P1 |
P2 |
P3 |
||
|
|
Coeff |
0.02438 |
0.42448 |
0.40619 |
0.85418 |
0.64516 |
0.56792 |
|
p-value |
0.05663 |
0.00000 |
0.0000 |
0.00000 |
0.00020 |
0.00000 |
|
|
αdcc Transmission of shocks |
Coeff |
0.08781 |
0.07146 |
0.40619 |
0.07301 |
0.03210 |
0.10014 |
|
p-value |
0.00000 |
0.02070 |
0.04820 |
0.00000 |
0.00260 |
0.02087 |
|
|
βdcc Transmission of volatility |
Coeff |
0.91188 |
0.68472 |
0.45763 |
0.89243 |
0.96512 |
0.89887 |
|
p-value |
0.00000 |
0.00000 |
0.00000 |
0.00000 |
0.00000 |
0.00000 |
|
|
Log-likelihood |
38088.2 |
4295.24 |
3520.34 |
21965.60 |
10380.30 |
3357.07 |
|

4.1.1 The Transition to a flexible regime. The results of the GARCH Model for Morocco and Tunisia listed in Table 6 exhibit a sharp rise in the impact of shocks combined with a decreasing past volatility impact for both countries following the transition to a flexible regime. These results show that the domestic market in both countries acquired more independence as central banks stopped their direct interventions. That said, the domestic market became more sensitive to shocks linked to liquidity and local political instabilities, as is the case in Tunisia. Another observation is the higher intensity of these variations in the Tunisian case, which may be caused by the turbulent economic situation in the country following the Arab Spring revolutions and the abrupt transition to the flexible regime. Conversely, Moroccan monetary authorities had a smoother transition in 2018 after more than 18 months of preparations, which included various workshops and extensive communications with domestic market actors.
The FIGARCH results in Table 7 show a significant drop in the fragmental integration parameter that assesses the long memory process in a given market. The magnitude of the variation is higher in Morocco, with a 50% decrease after the transition to the flexible regime. This observation results from the increasing independence given by Moroccan monetary authorities to the market, making banks drive the domestic FX market based on offer and demand dynamics. On the other hand, the Tunisian central bank reduced its intervention following the transition but closely monitored the anchoring to the real effective exchange rate. This behavior declined slightly during the long memory process as market actors remained sensitive to central bank communication and actions.
Moreover, the non-declared peg composition of the Tunisian Dinar adds more ambiguity to the local banks’ pricing. It remains dependent on the daily pivot rate published by the central bank. In contrast, the fully disclosed peg of the Moroccan Dirham gave market makers banks the ability to navigate the transition challenges by adjusting the prices based on market data such as liquidity, foreign currency reserves and EUR/USD anticipations.
Regarding the interdependence with the international market, the DCC Garch results listed in Table 8 exhibit mixed results for both countries. We observe a decrease in the αdcc parameter after the transition to the flexible regime in both countries. This drop is significantly higher in Tunisia, where the substantial capital control and the central bank’s policies shielded the domestic market from international shock transmission but made it more prone to international volatility spillover. The βdcc shows a rise in Tunisia compared to a significant drop in Morocco. This discrepancy results from the different flexibility transitions introduced and the economic conjuncture in which they were adopted. Moroccan authorities widened the fluctuation bands to offer more flexibility and leeway to the domestic market in regulating its liquidity and price within the set bands. In opposition, the Tunisian central bank was forced to introduce flexibility reforms during a turbulent economic situation to access the IMF bailout. The hard real exchange rate targeting imposed by these reforms contributed to the freefall of the Tunisian dinar as inflation and current account deficit soared. Furthermore, the undisclosed peg of the Tunisian currency is more sensitive to foreign currency volatility than Moroccan Dirham, which is linked to a fully disclosed peg. We found similar results in the studies of Bonser-Neal (1996) and Fanelli and Straub (2020) regarding the impact of central banks’ policies and anticipated interventions on the domestic foreign exchange market during turmoil and economic crises.
4.1.2 The COVID-19 period. During the COVID-19 pandemic, the successive lockdowns and the unorthodox economic policies profoundly destabilized financial markets worldwide. This instability was also observed in developing markets such as Morocco and Tunisia, where monetary authorities adopted loose policies, and governments conducted restrictive measures to curb the contamination curve during the successive waves. The results of the GARCH model in Table 6 show a rise in the impacts of domestic shocks, especially in Morocco, where the α1 parameter doubled during the COVID-19 period. This sharp variation may be caused by Moroccan authorities’ strict and swift lockdown since March 2020 and the restrictive measures that followed. In the meantime, as the central bank widened the fluctuation bands, we observed a further decrease in the impact of past volatilities and international interdependence, which confirmed the growing flexibility in the domestic market. This successful management of Moroccan monetary policies helped stabilize the market and remain independent, as we observe only a slight increase in the long memory process in Table 7.
In comparison, Tunisian authorities struggled to contain the virus due to the country’s complex political and social conditions. The central bank of Tunisia implemented various monetary policies to stabilize the market, which helped attenuate the effects of domestic and external shocks. Also, the interventions on domestic markets helped reduce international volatility spillover and helped domestic banks manage liquidity squeeze during the crisis. However, as shown in Table 7, this interventionism significantly increased the long memory process as market actors heavily depended on the central bank’s policies and interventions.
4.2 Emerging Economies with a Transition from Administrated to Floating Regimes
Table 9
GARCH (1,1) Results forSouth Africa and Nigeria
|
|
USD/ZAR |
USD/NGN |
|||||
|
P1 |
P2 |
P3 |
P1 |
P2 |
P3 |
||
|
α0 106 |
Coeff |
0.30289 |
0.00244 |
0.08565 |
0.31804 |
0.00015 |
0.44094 |
|
p-value |
0.00935 |
0.03980 |
0.02372 |
0.01800 |
0.00000 |
0.02854 |
|
|
α1 Impact of past shocks |
Coeff |
0.04936 |
0.08105 |
0.15405 |
0.15735 |
0.07814 |
0.29033 |
|
p-value |
0.00000 |
0.00000 |
0.00933 |
0.00000 |
0.00000 |
0.00000 |
|
|
β1 Impact of past volatilities |
Coeff |
0.84062 |
0.90276 |
0.76365 |
0.81460 |
0.70475 |
0.52314 |
|
p-value |
0.00000 |
0.00000 |
0.00000 |
0.00000 |
0.00000 |
0.00000 |
|
|
α1+β1 |
0.889990 |
0.98382 |
0.91766 |
0.97197 |
0.78289 |
0.81348 |
|
|
Log-likelihood |
6722.24 |
20569.20 |
1864.08 |
20262.2 |
3150.87 |
1822.63 |
|
Table 10
FIGARCH (1,d,1) Results for South Africa and Nigeria
|
|
USD/ZAR |
USD/NGN |
|||||
|
P1 |
P2 |
P3 |
P1 |
P2 |
P3 |
||
|
α0 106 |
Coeff |
0.24435 |
0.00571 |
0.04169 |
0.50498 |
0.83703 |
0.70949 |
|
p-value |
0.01551 |
0.02336 |
0.0466 |
0.04420 |
0.02721 |
0.07730 |
|
|
α1 |
Coeff |
0.28508 |
0.21226 |
0.34445 |
0.16409 |
0.61484 |
0.07325 |
|
p-value |
0.00740 |
0.00000 |
0.03909 |
0.01710 |
0.00310 |
0.00000 |
|
|
β1 |
Coeff |
0.71502 |
0.64627 |
0.22582 |
0.65363 |
0.13658 |
0.03265 |
|
p-value |
0.00000 |
0.00000 |
0.01541 |
0.00000 |
0.02442 |
0.07457 |
|
|
d Long memory process |
Coeff |
0.65300 |
0.53720 |
0.16047 |
0.74566 |
0.81609 |
0.65900 |
|
p-value |
0.00060 |
0.00000 |
0.0127 |
0.00000 |
0.00000 |
0.00000 |
|
|
Log-likelihood |
6727.54 |
20581.30 |
1864.98 |
17358 |
3429.46 |
1835.81 |
|
Table 11
DCC GARCH (1,1) Results for the Interdependence with the International Market for South Africa and Nigeria
|
|
USD/ZAR |
USD/NGN |
|||||
|
P1 |
P2 |
P3 |
P1 |
P2 |
P3 |
||
|
|
Coeff |
0.55093 |
0.30104 |
0.33099 |
0.01010 |
0.03608 |
0.04090 |
|
p-value |
0.00000 |
0.00410 |
0.00150 |
0.05234 |
0.04143 |
0.0000 |
|
|
αdcc Correlations of shocks |
Coeff |
0.03895 |
0.02386 |
0.03383 |
0.01218 |
0.03856 |
0.05634 |
|
p-value |
0.00000 |
0.00010 |
0.01820 |
0.04521 |
0.02755 |
0.0000 |
|
|
βdcc Correlations of volatilities |
Coeff |
0.91743 |
0.97045 |
0.94086 |
0.86043 |
0.80160 |
0.96806 |
|
p-value |
0.00000 |
0.00000 |
0.00000 |
0.00000 |
0.00000 |
0.0000 |
|
|
Log-likelihood |
12619.00 |
44706.50 |
3002.99 |
30897.9 |
4936.11 |
2060.48 |
|

Nigeria and South Africa are, respectively, the first and third economies in Africa1and have a coupled estimated GDP of 1 trillion US dollars. However, their foreign exchange rate regime’s evolution is very different and closely linked to their economic and social development.
4.2.1 The transition from administered to a floating regime. After the transition to floating, the GARCH Model results in Table 9 show a distinctive disparity between the two countries. For the South African Rand, we notice a significant rise in both impacts of past shocks and volatilities as the domestic market became more open to foreign capital. Limited central bank interventions also characterized this transition, contributing to the decreasing long memory process visible in Table 10. This drop illustrates the growing maturity of domestic market actors in managing currency volatility. This is confirmed by the results of the DCC GARCH model in Table 11, which exhibit a clear drop in the impact of international shocks. That said, with an open economy and significant contribution of commodities export to the GDP, the South African Rand became increasingly impacted by volatility spillover from international markets as we observe a rise in the βdcc parameter in Table 11. South Africa was one of the first African countries to switch to floating to promote its economy and attract FDI. The transition was smooth and organized, contributing to market stability and economic growth after a shaky and challenging apartheid era.
Nigeria is a significant energy powerhouse and the first economy in Africa. However, the racial and tribal tensions, high corruption, and succession of authoritarian regimes weakened the country’s economy and crushed the state finances. Major fallouts of this situation are high inflation, low growth and the constant misalignment of the real exchange rate. Since 2014, with the falling oil prices, the country started having significant economic difficulties, dwindling foreign exchange reserves and rising social instability. The culmination point arrived in 2016 and pushed the monetary authorities to drop their administered exchange rate regime for a floating one to absorb the external shocks and lower the pressure on national foreign reserves. After the switch to floating, we notice in Table 9 a surprising drop in the impact of domestic shocks and past volatilities. We believe this observed behavior results from the significant gap between the official rate we used in our study and those effectively used on the highly developed local black market. We also observe a rise in the long memory process in Table 10 and a moderate drop in international volatilities spillover in Table 11 as a result of the capital control present in the country to avoid a massive exodus of foreign currency. Finally, Table 11 exhibits a high impact of international shocks due to the high dependency of Nigerian exports on financial markets, especially commodities. These results corroborate the findings of Okoye et al. (2019) and Ayinde (2020), who used other models to analyze the impact of this transition in Nigeria.
4.2.2 The COVID-19 crisis. As the COVID-19 pandemic hit the worldwide economy, we observed a sharp rise in domestic and international shocks in both countries due to the economic shutdown caused by the worldwide lockdowns. Furthermore, the delayed contamination waves observed in African countries may have also contributed to the amplification of shocks in domestic markets.
Due to the immense contribution of commodities and services to South African and Nigerian exports, the abrupt drop in global demand directly impacted their economies. It pushed monetary authorities to take significant measures to avoid an economic shutdown. That is why we notice in Table 10 a substantial drop in the long memory process in both countries due to the frequent interventions of central banks to stabilize the market. We also note a contrasted behavior of international volatility spillover between the two countries, as shown by the βdcc parameter in Table 11. While the South African market gained more stability due to massive monetary injections and support, the Nigerian FX market suffered more volatility spillover due to the crash of oil prices after the weakening global demand.
4.3 Rapidly Growing Economies with a Direct Transition from a Fixed to a Floating Regime
Table 12
GARCH (1,1) Results for Kenya and Egypt
|
|
USD/KES |
USD/EGP |
|||||
|
P1 |
P2 |
P3 |
P1 |
P2 |
P3 |
||
|
α0 106 |
Coeff |
0.09742 |
0.67230 |
0.27512 |
0.37593 |
0.38612 |
0.52286 |
|
p-value |
0.01608 |
0.0101 |
0.02237 |
0.01444 |
0.00438 |
0.03734 |
|
|
α1 Impact of past shocks |
Coeff |
0.05226 |
0.10643 |
0.43356 |
0.04023 |
0.20612 |
0.15889 |
|
p-value |
0.01049 |
0.0000 |
0.01491 |
0.03655 |
0.00000 |
0.07690 |
|
|
β1 Impact of past volatilities |
Coeff |
0.92713 |
0.75882 |
0.54995 |
0.61557 |
0.77991 |
0.67576 |
|
p-value |
0.00000 |
0.0000 |
0.02100 |
0.00000 |
0.02080 |
0.00970 |
|
|
α1+β1 |
0.97940 |
0.86527 |
0.98352 |
0.655820 |
0.98603 |
0.83466 |
|
|
Log-likelihood |
2330.71 |
22193.1 |
1781.19s |
8792.04 |
2750.13 |
1799.62 |
|
Table 13
FIGARCH (1,d,1) Results for Kenya and Egypt
|
|
USD/KES |
USD/EGP |
|||||
|
P1 |
P2 |
P3 |
P1 |
P2 |
P3 |
||
|
α0 106 |
Coeff |
0.14744 |
0.11328 |
0.06495 |
0.35972 |
0.01056 |
0.48596 |
|
p-value |
0.00000 |
0.00000 |
0.0000 |
0.01673 |
0.01549 |
0.01330 |
|
|
α1 |
Coeff |
0.17549 |
0.46672 |
0.08025 |
0.09373 |
0.10549 |
0.83013 |
|
p-value |
0.00000 |
0.00020 |
0.07010 |
0.03470 |
0.03896 |
0.00000 |
|
|
β1 |
Coeff |
0.78183 |
0.34927 |
0.05079 |
0.83552 |
0.77002 |
0.64504 |
|
p-value |
0.00000 |
0.01130 |
0.07304 |
0.00000 |
0.04353 |
0.00000 |
|
|
d Long memory process |
Coeff |
0.60461 |
0.44692 |
0.55159 |
0.88184 |
0.94294 |
0.32504 |
|
p-value |
0.00000 |
0.0000 |
0.0000 |
0.02990 |
0.00000 |
0.00280 |
|
|
Log-likelihood |
2798.13 |
22263.7 |
1791.29s |
5646.03 |
2533.16 |
1808.28s |
|
Table 14
DCC GARCH (1,1) Results for the Interdependence with the International Market for Kenya and Egypt
|
|
USD/KES |
USD/EGP |
|||||
|
P1 |
P2 |
P3 |
P1 |
P2 |
P3 |
||
|
|
Coeff |
0.00892 |
0.04309 |
0.00527 |
0.00554 |
0.07741 |
0.04921 |
|
p-value |
0.07615 |
0.00180 |
0.09274 |
0.06202 |
0.03080 |
0.05805 |
|
|
αdcc Correlations of shocks |
Coeff |
0.05119 |
0.01455 |
0.20172 |
0.04849 |
0.03667 |
0.74657 |
|
p-value |
0.03641 |
0.05236 |
0.01740 |
0.02445 |
0.02087 |
0.03623 |
|
|
βdcc Correlations of volatilities |
Coeff |
0.78568 |
0.84244 |
0.63565 |
0.89369 |
0.80561 |
0.74657 |
|
p-value |
0.00000 |
0.00010 |
0.08837 |
0.00000 |
0.00000 |
0.01702 |
|
|
Log-likelihood |
5125.89 |
41686.2 |
3218.71 |
18997.90 |
4827.72 |
3237.6 |
|

Egypt and Kenya are two of the fastest-growing economies in Africa, with significant participation of the service sector in the GDP (more than 52% in both countries). On the foreign exchange level, both countries switched to floating without going through a flexible or managed period.
4.3.1 Direct transition to floating. After the transition to floating, we notice a contrasting evolution of the GARCH family model’s parameters listed in Tables 12, 13 and 14, similar to the previous case study. For the Kenyan Shilling, we observe a rise in the impact of domestic shocks and a noticeable drop in past volatility effects and the long memory process. These results are similar to those of Morocco, showing that the well-prepared transition gave the domestic actors in the Kenyan market greater flexibility in absorbing volatility and global shocks through offer and demand mechanisms. However, the free capital control and the limited restrictions on the foreign exchange market made the country prone to liquidity-related shocks and volatility spillover, as exhibited by the results in Table 14.
In the case of Egypt, the political uncertainty following the Arab Spring revolution created a difficult economic situation for the country as GDP crumbled and inflation spiked, draining foreign exchange reserves. These shocks contributed to the currency crisis that forced monetary authorities to switch to floating as a part of a bailout deal with the IMF. The Egyptian pound lost more than 50% of its value in the following weeks, leading to the implementation of strict capital control by the Central Bank of Egypt to stop the capital drainage. The results of this crisis and the central bank measures are visible in Table 12 as we observe a high impact of domestic shocks and past volatilities coupled with a higher long memory process. Furthermore, we notice a surprisingly slight decrease in the transmission of international shocks and volatility spillover due to the heavy restrictions imposed on currency exchange. The implemented limitations, such as the 100,000 US Dollar cap on individual transfers and the mandatory deposits for non-priority imports, contributed significantly to the parallel market development in Egypt. The black-market rates are always much higher than the official ones provided by the Central Bank of Egypt, which may explain further the dropping impact of the international shocks during this period.
4.3.2 The COVID-19 period. During the COVID-19 pandemic, we noticed a sharp rise in the impact of past shocks in Kenya, with a slight decrease in the Egyptian pound. The higher effect of domestic shocks in the Egyptian FX market following the forced transition to floating may bias this disparity. This hypothesis is confirmed by the critical rise of αdcc parameter listed in Table 14, which means a higher transmission of international shocks, especially in Egypt. Another observation is the drop in impact of past volatilities and international volatility spillover due to the extensive interventions by the central bank and its unorthodox monetary policies.
The last observation is the rise of the long memory process for the Kenyan Shilling during the pandemic compared to the drop observed in floating regimes such as Egypt, South Africa and Nigeria. This contrast may result from Kenya’s economy being more focused on the regional markets in West Africa, contrary to the international exposition of the other studied countries.
5. Conclusion
This article aimed to provide policy makers with a thorough analysis of the efficiency of monetary policies and reforms often implemented during a foreign exchange regime transition. We studied the volatility behavior during regime transition in 6 major African economies using 3 GARCH family models.
Our main findings can be resumed in the following highlights:
1. A stable economic situation, central bank transparency and proper preparation are essential for a successful transition and efficient mitigation of the inherent risks.
2. The transition to flexible or floating regimes amplifies the sensitivity to shocks but generally improves the market’s ability to absorb external shocks, manage domestic volatilities, and decrease dependence on central bank interventions. In the meantime, we observe a rise in the impact of domestic shocks and volatility spillover from international markets after the transition.
3. In the case of a global crisis, as during the pandemic, we observe a higher impact of both international and domestic shocks and a growing reliance on central bank interventions and monetary policies, especially in countries with relatively small economies. That said, we noted a significant growth in market actors’ capacity to regulate domestic volatility and absorb international volatility spillover in the aftermath of a crisis.
Güngöra et al. (2019) have shown in their study that the succession of financial crises pushes countries to consider the transition to more flexible regimes to maintain domestic market stability and preserve their FX reserves. That means that countries with heavy dependence on oil and grain imports, such as African countries, will be facing increasing shocks due to the aftermath of COVID-19, the war in Ukraine and the turmoil in the Middle East. The analysis conducted in this study as well as its results will help policymakers in these economies build up a roadmap for an inevitable regime change by adopting the most efficient policies and preparing adequate mitigation plans for the risk exhibited in our study.
This article will also enrich the economic literature related to the transition of FX regimes by providing a volatility-based study with a large daily data set instead of using long-term projections from Vector Error Correction or cointegration models. A further study path would be to analyze the high-frequency data during the crisis period to investigate the behavior of the different components of foreign exchange regimes (volatility, impact of shocks, market behavior, liquidity) during these periods.
References
Ayinde, T. O. (2020). Policy lags and exchange rate dynamics in Nigeria: Any evidence? Jurnal Ekonomi Pembangunan, 18(1), 1–12.
Baillie, R. T., Bollerslev, T., & Mikkelsen, H. O. (1996). Fractionally Integrated Generalized Autoregressive Conditional Heteroskedasticity. Journal of Econometrics, 74, 3–30.
Bollerslev, T. (1986). Generalized autoregressive conditional heteroskedasticity. Journal of Econometrics, 31(3), 307–327.
Bonser-Neal, C. (1996). Does Central Bank Intervention Stabilize Foreign Exchange Rates? Economic Review (Federal Reserves Bank of Kansas), 81(Q1), 43–57.
Calvo, G. A., & Reinhart, C. M. (2002). Fear of Floating. The Quarterly Journal of Economics, 117(2), 379–408.
Chen, Y., & Ward, F. (2022, 04). Output Divergence in Fixed Exchange Rate Regimes: Is the Euro Area Growing Apart? Retrieved from SSRN: https://ssrn.com/abstract=4098103
Engle, R. (2002). Dynamic Conditional Correlation: A Simple Class of Multivariate Generalized Autoregressive Conditional Heteroskedasticity Models. Journal of Business & Economic Statistics, 20(3), 339–350.
Fanelli, S., & Straub, L. (2020, 09). A Theory of Foreign Exchange Interventions (NBER Working Papers 27872). National Bureau of Economic Research, Inc.
Fouda, F. O., Avom, D., & Kueté, F. Y. (2021, 02). Toward the African Continental Free Trade Area: The Effects of Economic Integration and Democracy on Real Misalignments across Exchange Rate Regimes (Policy Research Working Paper Series 9548), The World Bank.
Güngöra, H., Balcılar, M., & Olasehinde-Williams, G. (2019). The empirical relationship between financial development and foreign exchange regimes: Did global financial crisis of 2007–2009 change regime preferences? European Journal of Sustainable Development, 8(1), 324–338.
Hagen, J. v., & Zhou, J. (2005). De facto and official exchange rate regimes in transition economies. Economic Systems, 29(2), 256–275.
Hansen, P. R., & Lunde, A. (2005). A Forecast Comparison of Volatility Models: Does Anything Beat a GARCH(1,1)? Journal of Applied Econometrics, 20(7), 873–889.
Hossain, M. (2008). Exchange Rate Regime Transition Dynamics In East Asia. (AIUB Bus Econ Working Paper Series No 2008-03).
Hossain, M. (2011). Exchange Rate Regime Transition Dynamics in Southeast Asia. Journal of Developing Areas, 41(5), 359–373.
Husain, A., Mody, A., & Rogoff, K. S. (2005). Exchange Rate Regime Durability and Performance in Developing Versus Advanced Economies. Journal of Monetary Economics, 52(1), 35–64.
International Monetary Fund. (2021). Annual Report on Exchange Arrangements and Exchange Restrictions 2021.
Kemme, D. M., & Lyakir, G. (2011). From Peg to Float: Exchange Market Pressure as a Guide for Monetary Policy in the Czech Republic. Review of International Economics, 19(1), 93–108.
Khan, M. S., & Tajnin, A. (2019). The Transition of Exchange Rate Regime and its Effect on Economic Indicators: Bangladesh Perspective. The Cost and Management, 47(3), 49–54.
Markiewicz, A. (2006). Choice of exchange rate regime in transition economies: An empirical analysis. Journal of Comparative Economics, 34(3), 484–498.
Masson, P., & Ruge-Murcia, F. J. (2005). Explaining the Transition between Exchange Rate Regimes. The Scandinavian Journal of Economics, 107(2), 261–278.
Miah, M., & Rahman, A. (2016). Modelling Volatility of Daily Stock Returns: Is GARCH(1,1) Enough? American Scientific Research Journal for Engineering, Technology, and Sciences (ASRJETS), 18(1), 29–39.
Nugroho, D. B., Susanto, B., Prasetia, K. N., & Rorimpandey, R. (2019). Modeling of Returns Volatility using GARCH(1,1) Model under Tukey Transformations. Jurnal Akuntansi dan Keuangan, 21(1), 12–20.
Okoye, L. U., Okorie, U. E., Okoh, J. I., Olokoyo, F. O., & Ezeji, F. N. (2019). Exchange Rate Dynamics and Economic Performance: Evidence from Nigeria. In Proceedings of SOCIOINT 2019- 6th International Conference on Education, Social Sciences and Humanities, Istanbul, Turkey (pp. 1173–1183).
Tenoy, S. K. (2021). The effect of fixed versus floating exchange rate on financial performance of commercial banks in South Sudan.[Thesis, Strathmore University]. http://hdl.handle.net/11071/12689
Yoshino, N., & Asonuma, T. (2017, 07). Optimal Dynamic Path During the Transition of Exchange Rate Regime: Analysis of the People’s Republic of China (PRC), Malaysia, and Singapore (ADBI Working Paper No. 765).
Yoshino, N., Kaji, S., & Asonuma, T. (2016). Dynamic Effects of Changes in the Exchange Rate System. Asian Development Review, 33(1), 111–161.
Yu, M. (2022). The Impact of Openness of Trade and Terms of Trade Volatility on the Exchange Rate Regime Transition. International Core Journal of Engineering, 346–352.
1 According to the 2022 Report for Selected Countries and Subjects by the IMF.