Organizations and Markets in Emerging Economies ISSN 2029-4581 eISSN 2345-0037
2022, vol. 13, no. 1(25), pp. 163–182 DOI: https://doi.org/10.15388/omee.2022.13.75
Non-Linear Effect of Government Debt on Public Expenditure in Nigeria: Insight from Bootstrap ARDL Procedure
Nurudeen Abu (corresponding author)
Mewar International University, Nigeria
abu.nurudeen@yahoo.com
https://orcid.org/0000-0002-9843-977X
Joseph David
Ibrahim Badamasi Babangida University, Nigeria
josephdavid970@gmail.com
https://orcid.org/0000-0002-1357-5618
Awadh Ahmed Mohammed Gamal
Universiti Pendidikan Sultan Idris, Malaysia,
awadh.gamal@fpe.upsi.edu.my
https://orcid.org/0000-0002-8529-951X
Ben Obi
University of Abuja, Nigeria
benonyi@yahoo.com
https://orcid.org/0000-0002-6093-7378
Abstract. This study employs the bootstrap autoregressive distributed lag (ARDL) approach alongside the dynamic ARDL simulations technique to investigate the non-linear effect of public debt on public expenditure in Nigeria during the 1981–2020 period. The result of the bootstrap bounds test illustrates the presence of a long-term relationship between public expenditure and public debt (along with oil rents, output growth and urbanisation). Further, the estimation results indicate that the effect of public debt on public expenditure is non-linear. In particular, public expenditure increases at early stages of rising public debt but declines at latter phases when public debt grows beyond specific threshold. This empirical outcome is further validated by the dynamic ARDL simulations approach which shows a significant decline in predicted public expenditure after short-term expansion due to counterfactual shock in public debt. Thus, policies which diversify public revenue from oil production and a reversal of the rising trend in public debt are recommended to avert the adverse welfare implications of declining public expenditure.
Keywords: public expenditure, public debt, bootstrap ARDL, dynamic ARDL simulations, Nigeria
Received: 15/1/2022. Accepted: 24/4/2022
Copyright © 2022 Nurudeen Abu, Joseph David, Awadh Ahmed Mohammed Gamal, Ben Obi. Published by Vilnius University Press. This is an Open Access article distributed under the terms of the Creative Commons Attribution Licence, which permits unrestricted use, distribution, and reproduction in any medium, provided the original author and source are credited.
1. Introduction
The role of public debt in bridging financial resource gap in developed and developing economies cannot be over-stressed (Ncanywa & Masoga, 2018). However, there seems to be disagreement amongst scholars on the precise effect of public debt on public expenditure. For instance, Buchanan and Wagner (1977) claimed that debt-financed deficit tends to produce higher levels of public expenditure. The authors’ argument rests on the premise that rising debt (and/or deficit) creates a counterfactual perception amongst citizens that the cost of public goods and services have become cheaper, thus, they will increase their demand for such goods and services (including transfers), leading to an expansion in public expenditure (Buchanan & Wagner, 1977; Iiyambo & Kaulihowa, 2020). A number of empirical studies appear to support this view (Abu et al., 2022; Del Monte & Pennacchio, 2020; Fagge & Ibrahim, 2018; Iiyambo & Kaulihowa, 2020; Ncanywa & Masoga, 2018; Ouattara, 2006; Ukwueze, 2015).
On the contrary, recent debates on the implication of growing public debt underline the deleterious effect of government debt on public spending. For instance, certain researchers have argued that huge debt burden tends to generate large diminution in public expenditure and/or adjustments in components of public expenditure such as spending on education and health, among others (Cashel-Cordo & Craig, 1990; Fosu, 2007, 2010; Mahdavi, 2004; Ncanywa & Masoga, 2018; Ndour, 2017; Picarelli et al., 2019; Shabbir & Yasin, 2015; Quattri & Fosu, 2012). To them, the fall in public expenditure is attributable, in part, to debt-induced liquidity constraints, the need to ensure continual servicing of accumulated debts, and/or because expenditure cuts are more quickly applicable rather than revenue generation when implementing fiscal austerity as a deficit reducing strategy (Fosu, 2007; Mahdavi, 2004; Picarelli et al., 2019; Shabbir & Yasin, 2015; Shonchoy, 2010; Taylor, 1993). Moreover, Lora and Olivera (2006) ascribed the decline in public expenditure to the disincentive which higher debt stock creates for further indebtedness.
Besides the conflicting views on the impact of debt on public expenditure, certain authors including Shonchoy (2010) and Ndour (2017) emphasised the potential effect of public debt on public expenditure to be non-linear. Whereas they seem to agree on the increasing effect of public debt on public expenditure, the authors believed that after a specific limit or threshold the continuous increase in the stock of public debt would lead to diminution in both productive and non-productive expenditure. This argument aligns with the “debt overhang” hypothesis of Krugman (1988) which asserts that public (investment) expenditure tends to decline following an increase in debt burden beyond certain threshold. Mahdavi (2004) attributed the decline in public expenditure, following a continuous increase in debt stock over and above a specific threshold, to shift in budgetary allocations away from some (or all) components of public expenditure in favour of the relative share of interest payments.
Like in most countries, public debt stock has been on the increase in Nigeria since she gained independence from the British due in part to the growing size of the country’s population, increased participation of the government in the economy and, most importantly, the dwindling oil revenue which accounts for over 70 percent of the government’s income (Central Bank of Nigeria [CBN], 2020). Available statistics demonstrates that Nigeria’s public debt stock maintained an expansionary stance between 1981 and 2020, except in 2006, when the country’s debt stock declined significantly by about 47.77 percent, following the implementation of the Paris Club debt relief (CBN, 2020). However, the sustained increase in public debt saw Nigeria emerging as the most indebted country in West Africa, and second in Sub-Saharan Africa, only behind South Africa (World Bank, 2021). In the same vein, Nigeria’s public expenditure has remained relatively high (Aladejare, 2019; CBN, 2020).
Figure 1
Plots of Nigeria’s Aggregate (unadjusted) Public Expenditure and Public Debt Stock of the Central Government
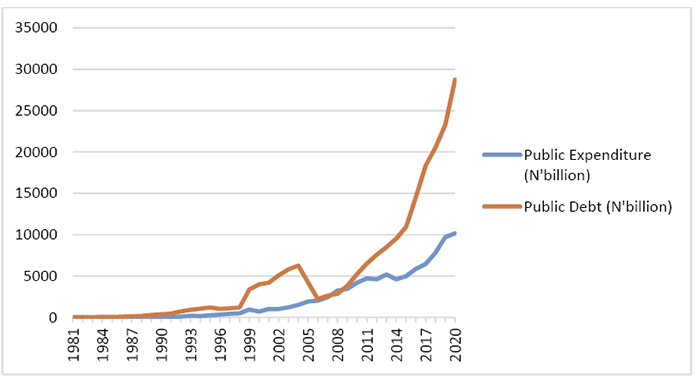
Source: Authors’ calculation based on data collected from CBN (2020)
Nonetheless, a cursory look at statistics from the CBN (2020) illustrates that the pattern of movement of the (unadjusted) public expenditure and public debt stock of the central government is not very clear, as they moved in the same direction in some years and opposite in other periods (Figure 1). For example, whereas public debt stock rose from N23.83 billion in 1982 to N32.80 billion in 1983, overall public expenditure declined from N11.9 billion to N9.60 billion during the same period. Similarly, public expenditure declined following increases in public debt stock in 1994, 2000, 2012 and 2014. Whereas rising public debt in the 1984–1993, 1995, 1997–1999, 2001–2004, 2007–2011, 2013, and 2015–2020 periods coincided with an expansion in public expenditure, the reduction in government debt in 1996, 2005 and 2006 saw public expenditure increase in the same period.
Given the unclear pattern in the movements of public debt and expenditure in Nigeria, it is possible that the public expenditure–debt relationship is non-linear. Therefore, the main objective of this study is to evaluate whether the public expenditure–debt relationship in Nigeria is non-linear. The present study is relevant and contributes to the literature in a number of ways. This study is the first attempt (to our knowledge) to investigate the non-linear effect of public debt on public expenditure in Nigeria. Second, the study is also the first to identify the threshold point in the public expenditure and public debt relationship in Nigeria. Third, the current study adopts the bootstrap ARDL-bounds testing method advanced by McNown et al. (2018) alongside the dynamic ARDL simulations procedure of Jordan and Philips (2018) to estimate the public expenditure–debt relation in Nigeria. These techniques are robust given that they address major shortcomings in the conventional ARDL approach of Pesaran et al. (2001). The various advantages of these techniques are discussed in subsequent section. Lastly, by exploring the effect of debt on public expenditure and identifying the threshold, this study is expected to advance practical insight into fiscal policy-making in Nigeria.
The remainder of the study is structured as follows. The second section discusses relevant empirical studies, while section three consists of theoretical framework, model formulation and econometric techniques. Section four contains presentation and discussion of results, and section five is for conclusion and recommendations.
2. Review of Literature on Public Expenditure and Debt Relationship
Several studies have assessed the effect of public debt on public expenditure in both developing and developed countries. However, the empirical literature is typically polarised along two dimensions, with studies illustrating the positive effect of debt on expenditure on the one hand, and those that found a deleterious effect of debt on public expenditure on the other hand. For instance, using a sample of 34 Organization of Economic Cooperation and Development (OECD) countries, Del Monte and Pennacchio (2020) indicated that the impact of public debt burden on public expenditure is positive. In the same vein, Ouattara (2006) reported a positive effect of public debt (servicing) on non-developmental expenditure (i.e., wages, salaries and subsidies) in developing countries.
In contrast, Picarelli et al. (2019) confirmed that debt burden is detrimental to public investment in selected European Union (EU) countries. Similarly, a number of studies illustrate that public debt (servicing and burden) has an adverse impact on aggregate and/or components of public expenditure in developing countries in Sub-Saharan Africa, East Asia and Pacific, Europe and Central Asia, Latin America and Caribbean, Middle East and North Africa, and South Asia, including highly indebted poor countries (Cashel-Cordo & Craig, 1990; Fosu, 2007, 2008, 2010; Lora & Olivera, 2006; Mahdavi, 2004; Quattri & Fosu, 2012; Shabbir & Yasin, 2015; Shonchoy, 2010; Stephens, 2001).
At country-specific level, researchers have also assessed the impact of public debt on public expenditure, particularly in developing countries such as Bangladesh, Kenya, Namibia, Nigeria, South Africa, including Uganda, and found that public debt (stock, servicing) is positively related to aggregate and/or components of public expenditure (Abu et al., 2022; Ahaisibwe, 2018; Fagge & Ibrahim, 2018; Firoj et al., 2018; Iiyambo & Kaulihowa, 2020; Kiminyei, 2014, 2019; Ncanywa & Masoga, 2018; Omodero, 2019; Ukwueze, 2015). On the contrary, some authors discovered that public debt (stock and servicing) decelerates public expenditure (Adamu, 2016; Aregbeyen & Akpan, 2013). Moreover, other studies confirmed an adverse impact of external debt on public expenditure and a positive influence of domestic debt on public expenditure (Aladejana et al., 2021; Kanano, 2006; Omodero, 2019; Orhewere & Ogbeide-Osaretin, 2020).
Besides these conflicting empirical outcomes, it is apparent that researchers did not deem it important to investigate the non-linear effect of public debt on public expenditure. In addition, despite the marked increase in public expenditure and debt, and the unclear pattern in their movements in Nigeria, there is obvious dearth of empirical studies which explore whether the public expenditure–debt relationship in the country is non-linear. Therefore, the present study contributes to the literature by assessing the non-linear impact of public debt on public expenditure in Nigeria during the 1981–2020 period. The study also considers the threshold of the public expenditure–debt relationship. Further, robust estimation techniques such as the bootstrap ARDL-bounds testing approach and the dynamic ARDL simulations method are adopted to estimate the relationship between the variables.
3. Theoretical Framework, Model Formulation, Data and Estimation Technique
3.1 Theoretical Framework and Model Specification
The literature on the effect of public debt on public expenditure is characterised by conflicting opinions. On the one hand, scholars including Buchanan and Wagner (1977) argued that public debt generates higher levels of public expenditure. On the contrary, a number of studies illustrate that the impact of public debt on public expenditure is deleterious (Fosu, 2007; Lora & Olivera, 2006; Mahdavi, 2004; Picarelli et al., 2019; Shonchoy, 2010; Taylor, 1993).
Furthermore, certain authors suggested that the effect of public debt on public expenditure can be non-linear (Ndour, 2017; Shonchoy, 2010). In line with this view, it is argued that rather than a direct/linear effect, the influence of public debt on public expenditure is positive at the initial stage of public debt growth and then negative after public debt grows beyond a specific threshold. Interestingly, Ndour (2017) included the interaction term of public debt in the public expenditure model to ascertain the non-linearity and threshold of the relationship. In other words, public expenditure can be modelled to incorporate both public debt and public debt squared.
In addition, evidence has shown that public expenditure can be influenced by a number of macroeconomic factors. For instance, since proceeds from the sales of oil accounts for over 70 percent of income of the government, the role of oil rents (OIL) in impacting public expenditure level in Nigeria cannot be over-stressed. Besides, authors have advocated the inclusion of oil rents when modelling economic variables because the Nigerian economy depends on events in the oil and gas industry (Abu, 2017; Abu & Gamal, 2020; Abu & Karim, 2021; Abu & Staniewski, 2019). Equally, it is well documented in the literature that output growth (Y) is a potential determinant of public expenditure. Interestingly, recent studies on public expenditure dynamics in Nigeria illustrated that real output growth rate is a relevant determinant of public expenditure in the country (Aladejare, 2013, 2019, 2020; Ukwueze, 2015). Additionally, the role of urbanisation (URBAN) in public expenditure has been advanced in the literature (Akanbi, 2014; Akanbi & Schoeman, 2010; Aregbeyen & Akpan, 2013; Firoj et al., 2018; Shonchoy, 2010). Typically, the greater the concentration of a country’s population in urban centres, the higher the demand for public goods and services (such as education, roads and transportation), leading to rising public spending on infrastructure and public utilities (Shonchoy, 2010).
Therefore, a simple model in which public expenditure (PEX) is dependent on public debt (DEBT), its quadratic term (DEBT2), alongside oil rents (OIL), real output growth rate (Y), and the rate of urbanisation (URBAN) is specified as follows:


where c, αi, and μ represent the intercept, coefficient of the regressors, and the stochastic disturbance term with zero mean and constant variance, respectively.
3.2 Econometric Procedure
To explore the co-integrating relationship between the variables, the bootstrap ARDL-bounds testing to co-integration proposed by McNown et al. (2018) is employed. This approach is adopted due to the number of advantages which it has over the traditional ARDL framework of Pesaran et al. (2001). For example, the approach addresses the issue of weak size and power properties that characterise the traditional ARDL bounds-testing. Based on Monte Carlo simulations, McNown et al. (2018) demonstrated that the bootstrap ARDL procedure performs better than the asymptotic test in the traditional ARDL technique with regard to size and power properties. In other words, besides allowing for endogeneity and feedback that may exist in the system, the bootstrap co-integration procedure is shown to be more robust and less biased in comparison with the asymptotic test in the traditional ARDL bounds testing. Moreover, by incorporating an additional test on the lagged level(s) of the independent variable(s) to complement the existing F- and t-tests presented in the traditional ARDL bounds-testing framework, the approach is superior to the conventional ARDL because it increases the power of the F-test, and by extension provides a better insight on the co-integration status of the system. The bootstrap ARDL method is also preferred to the traditional ARDL co-integration approach due to its ability to eliminate the issue of inconclusive inferences which may arise when using the traditional ARDL procedure (Goh et al., 2017; McNown et al., 2018).
To perform the bootstrap ARDL bounds-testing, an unrestricted error correction ARDL(p, q1, q2, q3, q4, q5) model to be estimated is specified as follows:

where ∆ represents the difference operator; c is the constant term; δ and β are the coefficients of the lagged dependent variables and the regressors; λi is the vector of coefficients of the lagged levels of dependent and independent variables; t = 1…T denotes time; ε is the stochastic error term with zero mean and constant variance.
According to McNown et al. (2018), it is required that the following three null hypotheses are rejected to establish co-integration amongst the series:

If all the three null hypotheses are rejected (i.e., if the three statistics exceed the respective critical values at specific level of significance), it is concluded that co-integration exists. Else, if all tests except the test on the lagged independent variable(s) are significant, the degenerate case #1 (degenerate lagged independent variable(s) case) occurs. Here the lag of the dependent variable is solely responsible for the joint significance of the error correction terms. However, if the t-test on the lagged level of the dependent variable is insignificant whereas the other two are significant, degenerate case #2 (degenerate lagged dependent variable case) is established. Hence, all three null hypotheses must be rejected for valid conclusion on co-integration to be reached as either of the cases indicates the case of no co-integration. The critical values for the three tests are generated through the bootstrap procedure as outlined in McNown et al. (2018). The major benefit of the bootstrap generated critical values is its elimination of the likelihood of inconclusive or indeterminate inferences from the ARDL bounds-testing, which is a likely occurrence (McNown et al., 2018).
In addition to the bootstrap ARDL cointegration method, the dynamic ARDL simulations approach proposed by Jordan and Philips (2018) is employed to examine the response of public expenditure following a counterfactual change/shock in public debt. One of the main advantages of the dynamic ARDL simulations procedure over the traditional ARDL framework is its ability to better interpret the significance of short-term and long-term effects of ARDL models, which becomes difficult as the lag structure gets more complex. The unique function of the procedure is to simulate and automatically visualise the impact of a counterfactual change in one weakly exogenous regressor at a single point in time using stochastic simulation techniques, while holding all else equal (Khan et al., 2020). The approach has been utilised in recent studies to predict future outcomes in social, economic and climate variables following a counterfactual shock (Ali et al., 2021; Khan et al., 2020; Khan et al., 2021; Olasehinde-Williams & Oshodi, 2021; Sarkodie et al., 2020; Sarkodie & Owusu, 2020, 2021; Shabbir et al., 2020). For the purpose of the present study, the simulation graph would be generated using the error correction algorithm of the dynamic ARDL procedure through 5,000 simulations of the public debt parameter from the unrestricted ARDL equation specified in equation (2).
3.3 Data
The present study uses Nigeria’s annual time-series dataset covering 1981 to 2020. The choice of the period is guided by data availability. The data are measured as follows. PEX is measured as a ratio of central government aggregate (recurrent and capital) expenditure to the GDP. Whereas researchers are often faced with a dilemma of either using the absolute value of public expenditure or its ratio to the GDP, the measure of public expenditure as a ratio of the GDP has come to enjoy widespread acceptance because it reflects the participation of the government in the economy (García & Martos, 2004). Besides, this measure of public expenditure was employed in a number of empirical studies (Akanbi & Schoeman, 2010; Cockx & Francken, 2015; Jibir & Aluthge, 2019; Mehmood & Sadiq, 2010; Picarelli et al., 2019; Shonchoy, 2010; Ukwueze, 2015). In the same vein, DEBT is measured as the share of total public debt of the federal government to the GDP (as used in Del Monte & Pennacchio, 2020; Picarelli et al., 2019; Shabbir & Yasin, 2015). We used this broader measure of public debt, rather than total debt of the central government, because it reflects both the extent of indebtedness of the government and the capacity of a country to pay back its outstanding debts.
Moreover, OIL is captured by the ratio of oil rents to the GDP. Oil rents (the difference between the value of crude oil production at regional prices and total costs of production) indicate the actual amount that the central government realises annually from the sales of crude oil after making provision for the cost of production (World Bank, 2021). Y is the annual percentage growth rate of real GDP, and it reflects the degree of expansion and/or contraction of economic activities in a country. Lastly, URBAN is measured as the percentage growth rate of urban population. The data on the variables were collected from various sources. Specifically, the data on aggregate public expenditure and public debt of the central government, and GDP were sourced from the Central Bank of Nigeria (CBN) annual statistical bulletin, while oil rents, real GDP growth rate and urban population growth rate were collected from the World Bank’s World Development Indicators (WDI).
4. Results and Discussion
The computed summary statistics of the variables are presented in Table 1. The results demonstrate that average public expenditure (as share of the GDP) between 1981 and 2020 is 8.44 percent, while the ratio of public debt to the GDP is 31.85 percent during the same period. Additionally, the results indicate that average oil rents (as share of GDP), real output growth rate and urban population growth rate are 11.83 percent, 3.03 percent and 4.73 percent, respectively.
Table 1
Descriptive Statistics
|
Series |
Mean |
Std. dev. |
Max |
Min |
Obs. |
|
PEX |
8.44 |
2.56 |
17.29 |
5.09 |
40 |
|
DEBT |
31.85 |
23.28 |
79.71 |
7.12 |
40 |
|
OIL |
11.83 |
5.92 |
26.43 |
1.45 |
39 |
|
Y |
3.03 |
5.45 |
15.33 |
-13.13 |
40 |
|
URBAN |
4.73 |
0.58 |
5.85 |
4.05 |
40 |
Note. PEX, DEBT, OIL, Y and URBAN denote public expenditure, public debt, oil rents, real output growth, and urbanisation, respectively.
Source: Authors’ computation using Eviews 12.
Prior to modelling the relationship between the variables, unit root test was conducted to ascertain the stationarity property of the variables. The traditional Augmented Dickey-Fuller (ADF), Philips-Perron (PP), and Kwiatkowski-Phillips-Schmidt-Shin (KPSS) unit root tests, alongside the Zivot-Andrews (ZA) test of Zivot and Andrews (1992) are employed for this purpose. Since ZA test explicitly accounts for the possibility of structural break in series, the test is adopted as a complement to the conventional tests which are weak in the presence of structural breaks.
The results of the tests summarised in Table 2 present mixed outcomes. However, the test statistics generally confirm that OIL, Y and URBAN are stationary at level (i.e., they have no unit root), while PE X, and DEBT are only stationary after taking their first difference. Thus, the results demonstrate that the variables are a mixture of I(0) and I(1). Since the bounds-testing procedure allows for series to have different orders of integration (at least not greater than order one – I(1)), these findings provide the justification for adopting the bootstrap ARDL bounds-testing approach (Pradhan & Hiremath, 2020; Pradhan et al., 2021).
Table 2
Unit Root Test Results
|
|
PEX |
DEBT |
OIL |
Y |
URBAN |
|
|
ADF |
Level |
-1.83 |
-1.89 |
-2.15 |
-3.81*** |
-9.09*** |
|
1st Diff. |
-4.38*** |
-4.25*** |
-7.45*** |
– |
– |
|
|
PP |
Level |
-3.10** |
-1.79 |
-3.14** |
-4.08*** |
-1.86 |
|
1st Diff. |
– |
4.25*** |
– |
– |
-5.74*** |
|
|
KPSS |
Level |
0.36* |
0.36* |
0.16 |
0.33 |
0.35* |
|
1st Diff. |
0.18 |
0.16 |
– |
– |
0.14 |
|
|
ZA |
Level |
-3.32 |
-3.71 |
-4.93* |
-3.24 |
-3.93 |
|
Tb |
1989 |
2004 |
1989 |
2000 |
1991 |
|
|
1st Diff. |
-5.60*** |
-4.96** |
-8.21*** |
-10.74*** |
-6.36*** |
|
|
Tb |
1994 |
1991 |
1994 |
1989 |
1993 |
|
Note. All tests were conducted with intercept. ADF’s critical values for intercept are given as: -3.62, -2.94 and -2.61, at 1%, 5% and 10% levels, respectively. PP’s critical values are -3.61 (1%), -2.94 (5%), and -2.61 (10%). KPSS’s critical values are 0.74, 0.46, and 0.35, at 1%, 5% and 10% levels, respectively. Zivot and Andrews’ (1992) critical values for structural change in the level shift are -5.34 (1%), -4.93 (5%) and -4.58 (10%). ADF, PP and ZA test the null of a unit root against the (trend-) stationary (with a one-time break, in the case of ZA) alternative. In contrast, KPSS tests the null of stationary against unit root alternative. The optimal lag length selection in ADF and ZA is based on Akaike’s (1979) Information Criteria (AIC), while Bartlett kernel and the Newey-West methods are followed using PP and KPSS process. Asterisks (***), (**) and (*) indicate significance at 1%, 5% and 10% level, respectively.
Source: Authors’ computation using Eviews 12.
To determine the co-integrating relationship between the series, the bootstrap ARDL bounds testing proposed by McNown et al. (2018) is employed, and the result reported in Table 3. The result reveal that the values of the overall F-statistic on lagged level variables (4.65), t-test on the lagged level dependent variable (-4.42) and F-statistic on lagged level independent variables (5.34) all exceed the critical values generated through the bootstrap procedure proposed by McNown et al. (2018) at the 5 percent level. Therefore, there is sufficient evidence to reject the null hypothesis of no co-integrating relationship between public expenditure and public debt (including public debt squared, oil rents, output growth and urbanisation).
Table 3
Bootstrap Bounds Test Result
|
Model |
Lag length |
Stats |
Values |
Bootstrap-generated CVs |
||
|
1% |
5% |
10% |
||||
|
PEX=f(DEBT, DEBT2, OIL, Y, URBAN) |
2,1,1,1,1,1 |
F1 |
4.65** |
8.43 |
4.30 |
3.65 |
|
T |
-4.42** |
-4.31 |
-3.05 |
-2.45 |
||
|
F2 |
5.34** |
6.66 |
4.73 |
3.87 |
||
Note. Asterisk (**) denotes significance at the 5% level based on critical values generated from the bootstrap procedure (with 2000 replications) of McNown et al. (2018). F1 represents the F-statistic for the lagged level variables, F2 denotes the F-statistic for the lagged level of the independent variables, and t is the t-statistic for the lagged level of the dependent variable. The optimal lag-length is suggested by AIC.
Source: Authors’ computation using Eviews 12.
4.1 Results of Estimation of the ARDL Model
Following the confirmation of cointegrating relationship amongst the series, the results of the estimated short-run and long-run model of the selected ARDL model with optimal lag length (2,1,1,1,1,1) suggested by AIC, are summarised in Panel A and Panel B of Table 4, respectively.
The results demonstrate that public debt has a significant positive effect on public expenditure both in the short- and long-run at the 1 percent level. A percent increase in public debt raises public expenditure by 0.179 percent and by 0.355 percent in the short- and long-run, respectively. The positive linear effect of public debt on public expenditure is consistent with previous findings (Abu et al., 2022; Ahaisibwe, 2018; Del Monte & Pennacchio, 2020; Fagge & Ibrahim, 2018; Iiyambo & Kaulihowa, 2020; Ncanywa & Masoga, 2018; Ouattara, 2006; Ukwueze, 2015). In contrast, the coefficient of squared public debt is statistically significant and negatively related to public expenditure both in the short- and long-term, at the 5 percent level. A percent increase in public debt squared causes public expenditure to decline by 0.002 percent in the long- and short-term, respectively, at the 5 percent level.
The implication of this outcome is that the effect of public debt on public expenditure in Nigeria is non-linear. In other words, there is the tendency of public expenditure rising in tandem with increases in public debt until it reaches a specific limit. However, further increase in public debt beyond this specific threshold leads to a decline in public expenditure. Interestingly, the non-linear impact of debt on public expenditure validates the postulations of Shonchoy (2010) and Ndour (2017). Although public expenditure in Nigeria has maintained an expansionary stance, its share in productive sectors of the economy (such as investment, education, health, and roads) has continued to decline, with a larger proportion of budgetary allocation devoted to servicing accumulated debt.
Table 4
Estimation Results of ARDL Model

Note. The model is estimated by setting the maximum lag to 4, and the optimum lag-length is suggested by AIC. ∆is the first difference operator. Asterisks (***), (**) and (*) denote significance at 1%, 5%, and 10% respectively. Values in parentheses (.) in panel A and B are the t-ratio, and values in square parentheses [.] in panel C are the probability values of the LM test statistics.  denote the Breusch-Godfrey serial correlation, Breusch-Pagan-Godfrey heteroscedasticity, Jarque-Bera normality and Ramsey RESET functional form LM tests, respectively.
Source: Authors’ computation using Eviews 12.
Moreover, the findings suggest that public expenditure and public debt relationship in Nigeria has an inverted U-shaped feature. Based on the quadratic specification in Equation 1, the estimated turning points/threshold of public debt and public expenditure are 44.75 percent and 11.43 percent, respectively. A graphical representation of the quadratic function is provided in Figure 2. The plots illustrate the increase in public expenditure following an increase in public debt prior to its threshold of 11.43 percent. However, over and above this threshold, further expansion in public debt (as a percentage of the GDP) leads to diminution in public expenditure (as a share of GDP).
Regarding other variables, the results indicate that oil rents is positively related to public expenditure in the short- and long-term, and significant at 1 percent level. A percent increase in oil rents raises public expenditure (as a share of the GDP) by 0.313 percent and 0.162 percent in the long- and short-term, respectively. The positive relationship between oil rents and public expenditure is consistent with the outcome of past studies (Abu et al., 2022; Adedokun, 2018; Aladejare, 2020; Aregbeyen & Fasanya, 2017; Jibir & Aluthge, 2019). Thus, an increase in oil rents raises government’s income, enhances its capacity to embark on developmental projects and investments, leading to an expansion in the level of public expenditure.
Figure 2
Plots of the Public Expenditure–Public Debt Threshold
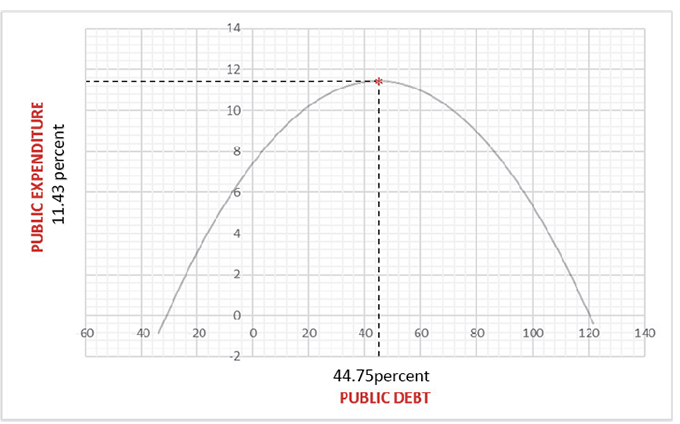
Source: Authors’ computation based on long-run estimates in Table 4
Further, the results reveal that output growth and urbanisation are positively related to public expenditure in the long term at the 10 percent and 5 percent level, respectively. A percent increase in output growth raises the level of public expenditure in the long term by 0.054 percent. The positive effect of output growth on public expenditure validates Wagner’s law of increasing state activities in Nigeria and recent empirical studies in the country (Aladejare, 2013, 2019; Ukwueze, 2015). The outcome suggests that the greater the growth of the economy, the larger would be the expansion in public expenditure in the country.
In addition, the results demonstrate that an increase in urban population growth rate by a percent leads to an increase in public expenditure by 1.33 percent. This outcome aligns with the discovery of a number of studies (Akanbi, 2014; Akanbi & Schoeman, 2010; Aregbeyen & Akpan, 2013; Firoj et al., 2018; Shonchoy, 2010). Since rising urbanisation is often accompanied by higher demand for public goods and services such as infrastructures, healthcare and education, etc., it will push up public expenditure.
Furthermore, the coefficient of error correction term lagged by one period (ECTt–1) is significant, correctly signed, and suggests that about 87 percent of the deviation in the short term is corrected within a year.
4.2 Results of Diagnostic and Model Stability Tests
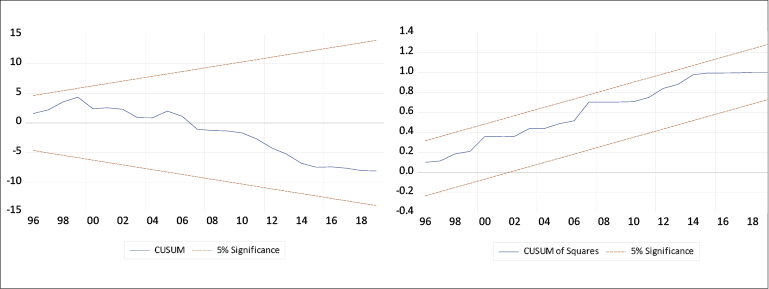
The results of the diagnostic tests presented in panel C of Table 4 demonstrate that the ARDL model is free from the issues of serial-correlation, misspecification error or bias, heteroscedasticity and normality. More so, the cumulative sum of recursive residuals (CUSUM) and cumulative sum of squares of recursive residuals (CUSUMQ) plots of Brown, Durbin and Evans (1975) presented in Figure 3 and Figure 4 indicate the stability of the parameters in the long term, and hence the suitability of the empirical outcome for policy making.
Figure 3 and Figure 4
Plots of CUSUM and CUSUMSQ
4.3 Predictions of the Effect of Public Debt on Public Expenditure based on Dynamic ARDL Simulations
Following the evidence of cointegration and the estimation results using the bootstrap ARDL method, the dynamic ARDL simulations method was employed to ascertain the response of public expenditure following a counterfactual change (or shock) in public debt over a 50-year period (i.e. from 2020 to 2070).
Considering a 5 percent counterfactual change in public debt on public expenditure over the 50-year period, the corresponding spikeplot of the dynamically simulated ARDL is presented in Figure 5. The spikeplot illustrates that the immediate impact of a counterfactual 5 percentage point increase in public debt in the tenth period is a significant increase in public expenditure by over 10 percent point in 2030 from about 8 percent point in pre-shock periods between 2020 and 2029. Over time and in subsequent periods, especially immediately – a period after the hypothetical shock in the tenth period, the predicted public expenditure declines to about 9 percent point. However, between 2032 and 2070, public expenditure stabilises within the 9 percent point region with little changes. In essence, this suggests the decline in the ratio of public expenditure to the GDP in the long term following significant increases in public debt (as a share of the GDP), and thus in consonance with the ARDL estimates.
Figure 5
Plots of Counterfactual Shock in Predicted Public Expenditure with a 5% Change in Public Debt
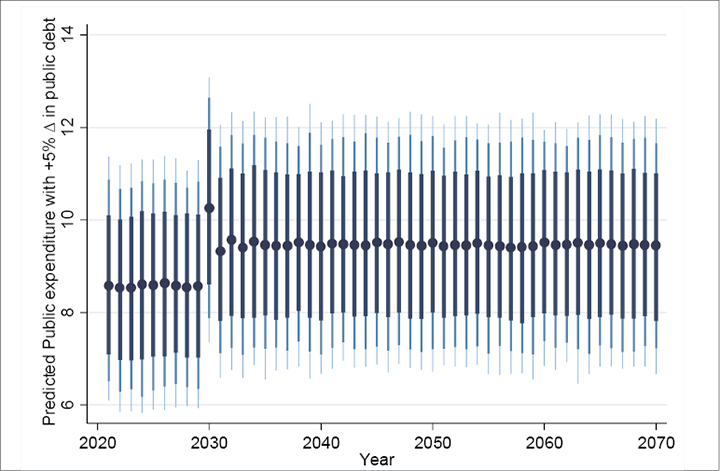
Note. The forecasting is executed using the Dynamic ARDL Simulations. The counterfactual shock in predicted public expenditure is achieved based on 5,000 simulations. Black dots show average predicted value, while shaded lines (from darkest to lightest) show the 75, 90, and 95 percentiles of the predictions from the simulations akin to a credible interval or confidence interval.
Source: Authors’ computation using ‘dynardl’ program in Stata
5. Conclusion and Policy Implications
This study assesses the non-linear effect of public debt on public expenditure in Nigeria following an expansion in both variables during the 1981–2020 period. Employing the bootstrap ARDL bounds testing approach and the dynamic ARDL simulations procedure, the cointegration test result illustrates the presence of a long-term relationship between public expenditure and public debt (along with oil rents, real output growth, and urbanisation). The estimation results confirm the non-linear effect of public debt on public expenditure. More so, the results indicate that the public expenditure and public debt relationship has an inverted U-shaped feature. Public expenditure increases at early stages of rising public debt, but it declines at the latter phases of rising public debt. Based on the quadratic specification, a threshold of 44.75 percent and 11.43 percent is attributed to public debt and public expenditure, respectively. Further, the dynamic ARDL simulations results reveal a significant increase in public expenditure in the short term following a counterfactual debt shock and a gradual decline in public expenditure in subsequent periods.
In the light of these findings, the present study recommends that the Nigerian government reduce the debt stock to avert the long-term consequence of falling public expenditure. This measure is important as recent increase in public expenditure in Nigeria is on account of servicing accumulated debt rather than raising productive components of public expenditure in the country. It is also recommended that government’s revenue source be diversified away from oil due to the volatile nature of its price and its non-sustainability for long-term development plans.
References
Abu, N. (2017). Does Okun’s law exist in Nigeria? Evidence from the ARDL bounds testing approach. Contemporary Economics, 11(2), 131–144.doi:10.5709/ce.1897- 9254.232
Abu, N., David, J., Sakanko, M. A., & Amaechi, B.-O. O. (2022). Oil price and public expenditure relationship in Nigeria: Does the level of corruption matter? Economics Studies (Ikonomicheski Izledvania), 31(3), 59-80.
Abu, N., & Karim, M. Z. A. (2021). Is the relationship between corruption and domestic investment non-linear in Nigeria? Empirical evidence from quarterly data. Estudios de Economia Aplicada, 39(3), 1–18. doi:10.25115/eea.v39i3.3953
Abu, N., & Gamal, A. A. M. (2020). An empirical investigation of the twin deficits hypothesis in Nigeria: Evidence from cointegration techniques. Contemporary Economics, 14(3), 285–305. doi:10.5709/ce.1897-9254.405
Abu, N., & Staniewski, M. W. (2019). Determinants of corruption in Nigeria: Evidence from various estimation techniques. Economic Research-Ekonomska Istraživanja, 32(1), 3058–3082. doi:10.1080/1331677X.2019.1655467
Adamu, I. M. (2016). Public Capital Investment in Nigeria: Does External Debt Matter. Academic Journal of Economic Studies, 2(4), 120-138.
Adedokun, A. (2018). The effects of oil shocks on government expenditures and government revenues nexus in Nigeria (with exogeneity restrictions). Future Business Journal, 4(2), 219–232. doi:10.1016/j.fbj.2018.06.003
Ahaisibwe, J. (2018). Determinants of public expenditure on infrastructure in Uganda (Masters Dissertation, Makerere University, Kampala, Uganda). Retrieved from https://hdl.handle.net/10570/7044
Akaike, H. (1979). A bayesian extension of the minimum AIC procedure of autoregressive model fitting. Biometrica, 66(2), 237–242.doi:10.1093/biomet/66.2.237
Akanbi, O. A. (2014). Government Expenditure in Nigeria: Determinants and Trends. Mediterranean Journal of Social Sciences, 5(27), 98–107. doi:10.5901/mjss.2014.v5n27p98
Akanbi, O. A., & Schoeman, N. J. (2010). The determinants of public expenditure and expenditure on education in particular in a selection of African countries. South African Journal of Economic and Management Sciences, 13(1), 50–61.
Aladejana, S. A., Okeowo, I. A., Oluwalana, F. A., & Alabi, J. A. (2021). Debt burden and infrastructural development in Nigeria. International Journal Academic Research in Business and Social Sciences, 11(1), 419–432. doi:10.6007/IJARBSS/v11-i1/8518
Aladejare, S. A. (2013). Government spending and economic growth: Evidence from Nigeria. MPRA Paper, 43916. Retrieved from https://mpra.ub.uni-muenchen.de/43916.
Aladejare, S. A. (2019). Testing the robustness of public spending determinants on public spending decisions in Nigeria. International Economic Journal, 33(1), 65–87. doi:10.1080/10168737.2019.1570302
Aladejare, S. A. (2020). Are public spending determinants significant in per capita budget spending decisions in Nigeria? International Journal of Finance and Economics, 1–15. doi:10.1002/ijfe.2146
Aregbeyen, O. O., & Akpan, U. F. (2013). Long-term Determinants of Government Expenditure: A Disaggregated Analysis for Nigeria. Journal of Studies in Social Sciences, 5(1), 31–87.
Aregbeyen, O., & Fasanya, I. O. (2017). Oil Price Volatility and Fiscal Behaviour of Government in Nigeria. Asian Journal of Economic Modelling, 5(2), 118–134. doi:10.18488/journal.8/2017.5.2/8.2.118.134
Ali, A., Usman, M., Usman,O., & Sarkodie, S. A. (2021). Modelling the Effects of Agricultural Innovation and Biocapacity on Carbon Dioxide Emissions in an Agrarian-Based Economy: Evidence from the Dynamic ARDL Simulations. Frontiers in Energy Research, 8, 592061. doi:10.3389/fenrg.2020.592061
Brown, R. L., Durbin, J., & Evans, J. M. (1975). Techniques for Testing the Constancy of Regression Relationships Over Time. Journal of the Royal Statistical Society: Series B (Methodological), 37(2), 149–192.doi:10.1111/j.2517-6161.1975.tb01532.x
Buchanan, J., & Wagner, R. E. (1977). Democracy in Deficit: The Political Legacy of Lord Keynes. New York: Academic Press.
Cashel-Cordo, P., & Craig, S. G. (1990). The public sector impact on international resource transfers. Journal of Development Economics, 32(1), 17–42. doi:10.1016/0304-3878(90)90050-L
Central Bank of Nigeria (2020). Central Bank of Nigeria Annual Statistical Bulletin. Abuja: Central Bank of Nigeria. Retrieved from https://statistics.cbn.gov.ng/cbn-onlinestats/DataBrowser.aspx
Cockx, L., & Francken, N. (2015). Natural resource wealth and public social spending in the Middle East and North Africa. Working Paper, 2015/03. Antwerpen: Institute of Development Policy and Management.
Del Monte, A., & Pennacchio, L. (2020). Corruption, Government Expenditure and Public Debt in OECD Countries. Comparative Economic Studies, 62(4), 739–771.doi:10.1057/s41294-020-00118-z
Fagge, M., & Ibrahim, T. (2018). Public Debt Management in Nigeria: The Impacts of Institutional Changes after Exiting from the Paris Club in 2006. MPRA Paper, 100364. Retrieved from https://mpra.ub.uni-muenchen.de/100364/
Firoj, M., Sultana, N., & Sultana, F. (2018). Determinants of the Size of the Government Expenditure: An Empirical Study on Bangladesh. International Journal of Economics and Finance, 10(11), 149–157.doi:10.5539/ijef.v10n11p149
Fosu, A. K. (2007). Fiscal Allocation for Education in Sub-Saharan Africa: Implications of the External Debt Service Constraint. World Development, 35(4), 702–713. doi:10.1016/j.worlddev.2006.06.008
Fosu, A. K. (2008). Implications of the External Debt-Servicing Constraint for Public Health Expenditure in Sub-Saharan Africa. Oxford Development Studies, 36(4), 363–377.doi:10.1080/13600810802455112
Fosu, A. K. (2010). The External Debt-Servicing Constraint and Public-Expenditure Composition in Sub-Saharan Africa. African Development Review, 22(3), 378–393. doi:10.1111/j.1467-8268.2010.00252.x
García, M. J., & Martos, L. P. (2004). Public Expenditure Dynamics in Spain: A Simplified Model of its Determinants. Instituto de Estudios Fiscales, (9/04).
Goh, S. K., Sam, C. Y., & McNown, R. (2017). Re-examining foreign direct investment, exports, and economic growth in Asian economies using a bootstrap ARDL test for cointegration. Journal of Asian Economics, 51(C), 12–22. doi:10.1016/j.asieco.2017.06.001
Iiyambo, H., & Kaulihowa, T. (2020). An assessment of the relationship between public debt, government expenditure and revenue in Namibia. Public Sector Economics, 44(3), 331–353.doi:10.3326/pse.44.3.3
Jibir, A., & Aluthge, C. (2019). Modelling the determinants of government expenditure in Nigeria. Cogent Economics and Finance 7(1), 1–23. doi:10.1080/23322039.2019.1620154
Jordan, S., & Philips, A. Q. (2018). Cointegration Testing and Dynamic Simulations of Autoregressive Distributed Lag Models. Stata Journal, 18(4), 902–923. doi:10.1177/1536867X1801800409
Kanano, A. G. (2006). Determinants of Public Expenditure Growth in Kenya (Masters Dissertation, University of Nairobi, Kenya). Retrieved from https://erepository.uonbi.ac.ke/handle/11295/6272
Khan, M. A., Ahmed, M., Popp, J., & Oláh, J. (2020). US Policy Uncertainty and Stock Market Nexus Revisited through Dynamic ARDL Simulation and Threshold Modelling. Mathematics, 8(11), 2073. doi:10.3390/math8112073.
Khan, M. K., Teng, J-Z., Khan, M. I. & Khan, M. F. (2021). Stock market reaction to macroeconomic variables: An assessment with dynamic autoregressive distributed lag simulations. Resource Policy, 73(C), 101899. doi:10.1002/ijfe.2543.
Kiminyei, F. K. (2014). Public Debt, Tax Revenue and Government Expenditure in Kenya: 1960-2012 (Masters Dissertation, University of Nairobi, Kenya). Retrieved from https://erepository.uonbi.ac.ke/handle/11295/76540
Kiminyei, F. K. (2019). Empirical Investigation on the Relationship among Kenyan Public Debt, Tax Revenue and Government Expenditure. Academic Journal of Economic Studies, 5(1), 142–159.
Krugman, P. (1988). Financing versus forgiving a debt overhang. Journal of Development Economics, 29(1), 253–268. doi:10.1016/0304-3878(88)90044-2
Lora, E., & Olivera, M. (2006). Public Debt and Social Expenditure: Friends or Foes? IADB Working Paper, 563.
Mahdavi, S. (2004). Shifts in the Composition of Government Spending in Response to External Debt Burden. World Development, 32(7), 1139–1157. doi:10.1016/j.worlddev.2004.01.011
Mehmood, R., & Sadiq, S. (2010). The Relationship between Government Expenditure and Poverty: A Cointegration Analysis. Romanian Journal of Fiscal Policy, 1(1), 29–37.
McNown, R., Sam, C. Y., & Goh, S. K. (2017). Bootstrapping the autoregressive distributed lag test for cointegration. Applied Economics, 50(13), 1509–1521. doi:10.1080/00036846.2017.1366643
Ncanywa, T., & Masoga, M. M. (2018). Can public debt stimulate public investment and economic growth in South Africa? Cogent Economics and Finance, 6(1), 1–13. doi:10.1080/23322039.2018.1516483
Ndour, C. T. (2017). Non-linear effects of the deficit on public investment: Case of WAEMU countries. SSRN Paper, 2963615.
Olasehinde-Williams, G., & Oshodi, A. F. (2021). Global value chains and export growth in South Africa: Evidence from dynamic ARDL simulations. Transnational Corporations Review, 1–13. doi:10.1080/19186444.2021.1959833.
Omodero, C. O. (2019). External Debt Financing and Public Capital Investment in Nigeria: A Critical Evaluation. Economics and Business, 33(1), 111–126. doi:10.2478/eb-2019-0008
Orhewere, B., & Ogbeide-Osaretin, E. N. (2020). Oil Price Shocks and their Impact on Capital Expenditure in Nigeria. Acta Universitatis Danubius Œconomica, 16(2), 227–238.
Ouattara, B. (2006). Foreign aid and government fiscal behaviour in developing countries: Panel data evidence. Economic Modelling, 23(3), 506–514. doi:10.1016/j.econmod.2006.02.001
Pradhan, A. K., & Hiremath, S. S. (2020). The Capital Flight from India: A Case of Missing Woods from Trees? Singapore Economic Review, 65(02), 365–383. doi:10.1142/S0217590816500429
Pradhan, A. K., Roth, S., & Khan, I. A. (2021). Does market concentration affect wholesale electricity prices? An analysis of the Indian electricity sector in the COVID-19 pandemic context. Utilities Policy, 73(C), 101305. doi:10.1016/j.jup.2021.101305
Pesaran, M. H., Shin, Y., & Smith, R. J. (2001). Bounds testing approaches to the analysis of level relationships. Journal of Applied Econometrics, 16(3), 289–326. doi:10.1002/jae.616
Picarelli, M. O., Vanlaer, W., & Marneffe, W. (2019). Does public debt crowd out public investment in the EU? ESM Working Paper Series, 36. doi:10.2852/795853
Quattri, M. A., & Fosu, A. K. (2012). On the Impact of External Debt and Aid on Public Expenditure Allocation in Sub-Saharan Africa after the Launch of the HIPC Initiative. Proceedings of the International Association of Agricultural Economists (IAAE) Triennial Conference. Foz do Iguaçu, Brazil. doi:10.22004/ag.econ.126879
Sarkodie, S. A., & Owusu, P. A. (2020). How to apply the novel dynamic ARDL simulations (dynardl) and Kernel-based regularized least squares (KRLS). MethodsX, 7(C), 101160. doi:10.1016/j.mex.2020.101160
Sarkodie, S. A., & Owusu, P. A. (2021). Escalation effect of fossil-based CO2 emissions improves green energy innovation. Science of the Total Environment, 785(C), 147257. doi:10.1016/j.scitotenv.2021.147257
Sarkodie, S. A., Ackom, E., Bekun, F. V., & Owusu, P. A. (2020). Energy-Climate-Economy-Population Nexus: An Empirical Analysis in Kenya, Senegal, and Eswatini. Sustainability, 12(15), 6202.
Shabbir, S., & Yasin, H. M. (2015). Implications of Public External Debt for Social Spending: A Case Study of Selected Asian Developing Countries. Lahore Journal of Economics, 20(1), 71–103.
Shabbir, A. H., Zhang, J., Johnston, J. D., Sarkodie, S. A., Lutz, J. A., & Lie, X. (2020). Predicting the influence of climate on grassland area burned in Xilingol, China with dynamic simulations of autoregressive distributed lag models. PLoSOne, 15(4), e0229894.
Shonchoy, A. S. (2010). Determinants of government consumption expenditure in developing countries: A panel data analysis. IDE Discussion Paper, 266. Retrieved from http://hdl.handle.net/2344/926.
Stephens, M. (2001). External Debt, Government Spending and Growth in Heavily Indebted Poor Countries (Unpublished doctoral thesis), New York University, USA.
Taylor, L. (1993). The Rocky Road to Reform: Adjustment, Income Distribution and Growth in the Developing World. London: MIT Press.
Ukwueze, E. R. (2015). Determinants of the size of public expenditure in Nigeria. SAGE Open, 5(4), 1–8. doi:10.1177/2158244015621346
World Bank (2021). World Development Indicators (WDI). Washington, DC: World Bank. Retrieved from https://datacatalog.worldbank.org/world-development-indicators
Zivot, E., & Andrews, D. W. (1992). Further Evidence on the Great Crash, the Oil-Price Shock, and the Unit-Root Hypothesis. Journal of Business & Economic Statistics, 10(1), 251–270. doi: 10.2307/1391541