Organizations and Markets in Emerging Economies ISSN 2029-4581 eISSN 2345-0037
2022, vol. 13, no. 1(25), pp. 139–162 DOI: https://doi.org/10.15388/omee.2022.13.74
COVID-19 Pandemic and Export: Evidence from Lithuania
Vaiva Petrylė
Vilnius university
vaiva.petryle@evaf.vu.lt
https://orcid.org/0000-0002-1726-1843
Abstract. In this paper I apply the gravity model to analyse structural changes of Lithuania’s export during the first pandemic year. Lithuania was selected as a case of a small open economy with relatively high numbers of Covid-19 cases, on one hand, and a rather small decrease of its GDP growth in 2020, on the other. The research aims to fill the gap in the current literature by investigating heterogeneity in the goods export in terms of both product groups and export destinations*. I also analyse whether the importance of distance and other export determining factors changed during the pandemic year. Results suggest that Lithuania’s export is resilient to economic shocks. Although the effects of Covid-19 were heterogeneous, the pandemic year had only a negligible impact on Lithuania’s export structure. The influence of distance or other export determinants on Lithuania’s export structure did not change during 2020.
Keywords: COVID-19, international trade, export, gravity model, Lithuania
-----------------
* The preliminary findings of this study were published in the proceedings of the 12th International Scientific Conference “Business and Management 2022”.
-----------------
Received: 25/2/2022. Accepted: 4/5/2022
Copyright © 2022 Vaiva Petrylė. Published by Vilnius University Press. This is an Open Access article distributed under the terms of the Creative Commons Attribution Licence, which permits unrestricted use, distribution, and reproduction in any medium, provided the original author and source are credited.
1. Introduction
The year 2020 was exceptional in many countries. Covid-19 pandemic broke up in China at the end of 2019 and reached Europe and Lithuania at the beginning of 2020 (Worldometer, 2021). In response, mainland European countries started to impose travel restrictions at the end of January, and before the middle of March most of the countries (Lithuania was among them) had imposed travelling bans, closures of stores, entertainment places, “stay-home” requirements, etc. (European Centre for Disease Prevention and Control, 2021). These restrictions affected not only a significant part of the population, but also countries’ economies and their export structures (Arriola et al., 2021; Hayakawa & Mukunoki, 2021; Espitia et al., 2022; Vidya & Prabheesh, 2020; etc.).
The most likely impact of such restrictions could be the drop in demand and supply and higher transport costs, leading to the reduction of manufacturing as well as the drop of both domestic and international trade (Hayakawa & Mukunoki, 2021; Brinca et al., 2020). Still, such shocks tend not only to reduce, but also to divert consumption (Hayakawa & Mukunoki, 2021). People had much lower possibilities to travel, therefore, they might go camping, sailing or buy a holiday home. People could no longer spend their free time in a cinema or at a restaurant, hence, they might decide to buy a larger TV and a more comfortable sofa. People had to work from home, and schools were closed, therefore, consumers might reduce their spendings on perfume, clothing and footwear, and invest in computers and fast Internet instead.
Such changes in consumption could result in heterogeneous changes in export structure (Zainuddin et al., 2021; Zainuddin et al., 2022). Countries’ export could be diverted in terms of products, e. g., less clothes and more TVs could be demanded and exported. But export structure could also diversify in terms of export destinations, e. g., closer-by markets could become preferred to further away markets because of the increased transport cost.
This paper aims to examine Lithuania’s goods export and how it shifted between products and between export markets during the first pandemic year. I also examine the change of the importance of distance on export in 2020. In the paper, I focus on the short-term impact of the Covid-19 pandemic on the export structure of Lithuania. I refer to trade in goods only. The impact of the pandemic on trade of services could be even larger but the available data are not as comprehensive as for trade in goods.
I analyse Lithuania because of three reasons. First, as a small and open economy and a member of the European Union, Lithuania is strongly related both to the European and to the world markets, and therefore vulnerable to external shocks. Second, compared to other EU countries, Lithuania had above average numbers of total Covid-19 cases per million of population in 2020 (Ritchie et al., 2020). It makes Lithuania at the same time affected by the pandemic and not an outlier. Third, according to the World Bank (2021), Lithuania’s GDP growth amounted to -0.1 % in 2020, and it was the lowest decline in the whole European Union (e. g., the economy of Latvia decreased by 3.6 %, that of Belgium by 5.66 % and the GDP of Spain declined by even 10.8 %). As Lithuania’s GDP stayed more or less immune to the pandemic, I question how Covid-19 influenced Lithuania’s export structure.
The research aims to check two main hypotheses:
(1) In 2020, Lithuania’s export structure changed heterogeneously in terms of product groups and destination countries.
(2) When the pandemic started, distance between Lithuania and its export markets became more important than it was before.
The paper contributes to the literature on empirical gravity modelling and economic effects of the pandemic. Compared to the existing research, this paper differs in 3 main aspects:
1) The paper uses a larger and more detailed 3-dimensional (i. e., time, product and country) dataset. Having both a wide range of goods (almost 100) and a wide range of export partners (more than 150) in the dataset allows us to examine heterogeneous effects of the pandemic on both different product groups and different export destinations.
2) The effects of Covid-19 are researched by constructing and estimating different specifications of Lithuania’s gravity model which include many important variables (GDP, distance, languages, contiguity, the EU and the WTO membership, etc.). This approach ensures robustness of the results and allows us to make a comprehensive analysis.
3) As far as I am aware, it is the first paper to analyse the changes of the importance of different determinants of export during the pandemic year.
The results show that the pandemic year had small and heterogeneous impact on Lithuania’s export. In terms of product groups, it resulted in the increase in export of albuminoidal substances, chemical products, ships, musical instruments, tobacco and cereals. Negative effects include decreased export of meat, clothing, footwear, vehicles, mineral fuels, cutlery, furniture and various articles of stone, plastic, cement, copper, nickel and lead. In terms of export partners, Covid-19 resulted in the decreased Lithuania’s goods export to Estonia, Ukraine, Russia, Slovenia, Kyrgyzstan and Tajikistan, and the increased export to Israel.
Surprisingly, in spite of a number of travel restrictions, distance did not become more important for international trade than it was before the pandemic. The importance of other factors also remained unchanged.
The setup of the paper is as follows: in Section 2, I review the literature. Section 3 presents methodology and gives insight to the data. All empirical findings are reported in Section 4: descriptive statistics of the variables is given in Section 4.1, the results of Lithuania’s gravity model – in Section 4.2, in Section 4.3, I compare actual and predicted export for 2020, Section 4.4 decomposes the effects of Covid-19 on different products and countries, and in Section 4.5, I examine whether the importance of distance for export increased during 2020. Finally, Section 5 concludes.
2. Literature Review
Current studies of the economic effects of the pandemic could be divided into two main groups: investigation of the effects of Covid-19 on the whole economic or trade structure of the countries, and examination of the effects of the pandemic on different economic sectors.
The first group of papers mainly find negative trade effects of the pandemic. Arriola et al. (2021) investigated the changes in the world trade structure during 2020. They concluded that trade in services declined twice as much as trade in goods and claimed that there is no relationship between the amount of the decline and product complexity. Davidescu et al. (2021) constructed a gravity model for Romania’s export and claimed that better institutions (e. g. lower corruption, etc.) positively affect country’s export and noticed a clustering with the other institutionally similar countries. Hayakawa and Mukunoki (2021) applied gravity model to assess the impact of Covid-19 on the international trade. They concluded that although the impact of the pandemic was negative both for the importers and for the exporters, this effect became insignificant in July, 2020. The findings of other authors (e. g., Espitia et al., 2022; Vidya & Prabheesh, 2020) were even more pessimistic. Vidya and Prabheesh (2020) showed that the pandemic could result in a drastic decline of trade and broken trade networks. Espitia et al. (2022) found that the pandemic had mostly negative effects on trade, and the least negative impact was for the sectors which rely more on remote work.
However, the impact of Covid-19 was not homogeneous. Zainuddin et al. (2022) examined the effects of the pandemic on Malaysia’s export of three types of goods: capital goods, intermediate goods and consumption goods. They found out that more Covid-19 cases in trading partners resulted in increased Malaysia’s export of capital and consumption goods. On the other hand, Malaysia’s export of capital goods decreased together with the increase of stringency in its trading partners. These results were supported by Zhao et al. (2021), who examined the effects of the pandemic on China’s export. Zhao et al. (2021) claimed that Covid-19 situations inside China had significant negative effects on its trade, while Covid-19 situations in other countries had significant positive effects on China’s trade.
The heterogeneity of the influence of Covid-19 on trade was supported by the literature examining the impact of the pandemic on different economic sectors. Zainuddin et al. (2021) noticed that Malaysia’s export of products that protect from the illness (e. g. rubber gloves) increased; while the export of non-basic products (e. g. tobacco, furs and leather) experienced the sharpest decrease during the pandemic. These findings were supported by Shahriar et al. (2021). They employed a number of specifications of the gravity model to research Bangladesh’s leather export and claimed that this sector was negatively affected by Covid-19. Barichello (2021) analysed the impact of Covid-19 on Canada’s agricultural export and found out that it even increased during 2020, however, not because of the pandemic. Still, the impact was not the same in other countries. Although Chinese agricultural export of some products (e. g., grain and oil) increased, the average effect of the pandemic on Chinese agriculture was negative, especially for smaller producers (Lin & Zhang, 2020).
A large number of services sectors were affected negatively by the pandemic (e. g., tourism (Sigala, 2020), microfinance (Sangwan et al., 2021, etc.). Still, there are sectors for which Covid-19 created not only challenges, but also new opportunities. The sector of education had to become much more innovative (Zhao & Watterston, 2021). Healthcare sector became more flexible and better prepared for possible future shocks (Kaye et al., 2021). Diminished economic activity could also result in improved air and water quality in the cities (Cheval et al., 2020; Pradhan et al., 2021).
Most of the current studies focus on the impact of the pandemic either on trade in general or on the trade of different product groups. We still lack analyses on how Covid-19 affected trade in terms of the trade partners, and on the possible changes in the importance of various export determining factors during the pandemic. This paper fills the gap in the current literature providing extensive analysis of Lithuania’s export structure in terms of all these aspects. It empirically analyses possible heterogeneity of export in terms of both products and destination markets. It also examines if the importance of any export determining factors changed during the pandemic.
3. Methodology and Data
3.1 Model Specification
To assess the changes of Lithuania’s export structure during the first pandemic year, I apply a two-step estimation procedure. First, I estimate a gravity model for Lithuania. The gravity model was chosen because it allows us to research heterogeneity in different economic sectors and export markets. Second, having estimated the values of the coefficients of the gravity model, I forecast Lithuania’s export of different products to different markets for 2020. Analysis of the differences between the actual and forecasted export in 2020 gives a rough view of the impact of Covid-19 on Lithuania’s export.
The gravity model was constructed following its theoretical foundations presented by Tinbergen (1962), Anderson (1979), Anderson and van Wincoop (2003), and Anderson (2011). However, based on the availability of data (international statistic offices still do not provide export data for the full year 2020), and following Davidescu et al. (2021), Shahriar et al. (2021) and Zainuddin et al. (2022), I chose the gravity model of only one exporting country.
I estimate two types of Lithuania’s gravity models: a static model and a dynamic one. The static gravity model includes regressors that are common in most of the gravity models: GDP of the origin and the destination, distance, language, contiguity, and the EU and the WTO memberships. The dynamic gravity model follows De Grauwe and Skudelny (2000), Campbell (2010), Olivero and Yotov (2012), Chaney (2014), and includes all these regressors and one additional factor: last years’ export. Last year’s export shows continuation of export and is highly significant. Its inclusion helps to reduce autocorrelation and endogeneity problems by catching up some of the omitted variables and has no effect on the efficiency of the estimates as export is correlated with its previous value. To minimize the risk of other potential discrepancies, I also apply individual effects, clustering, robust standard errors, etc.
Dynamic gravity equation is represented as follows:
 (1)
(1)
Here Exporti,c,t stands for the export of product i from Lithuania to country c in year t. GDPLT,t-1 is Lithuania’s GDP in time t-1. GDPc,t-1 is the country’s c GDP in year t-1. Distancec is the distance between Lithuania and country c. Languagec stands for an index that an average citizen of Lithuania and country c could understand each other. EUc and WTOc shows if Lithuania and country c both belong to the European Union and to the World Trade Organisation, respectively. Borderc shows if Lithuania and country c has a common border. Finally, Ɛc,t is an error term, and ui,t is the individual effect on product and year.
I estimate Lithuania’s gravity model for the period of 2015–2019. The model takes one source country (Lithuania), 157 Lithuania’s export partners and 96 product groups.
3.2 Model Estimation Techniques
Researchers use a number of different estimation techniques for gravity models: simple OLS, Poisson maximum likelihood (PPML) model (Santos Silva & Tenreyro, 2006), Eaton-Kortum maximum likelihood approach (Eaton & Kortum, 2001), various 2 stage procedures (Bussière & Schnatz, 2006; Helpman, Melitz & Rubinstein, 2008; Greene, 2013; Mnasri & Nechi, 2021), different functional forms (Kristjánsdóttir, 2005), etc. Still, the most popular tools among the researchers are either OLS, or PPML models. To ensure robustness of the results, I estimate Lithuania’s gravity model under both OLS and PPML specifications.
Egger (2002) and Carrère (2006) proposed to estimate gravity models including random effects, because ordinary fixed effect models do not allow estimatation of the effects of time-invariant variables. In my case with only one source country such variables would be distance, common spoken language and the dummies for the EU, the WTO membership and contiguity. As all these variables are time-invariant, ordinary fixed effects model would leave me with only 3 exogenous variables: Lithuania’s GDP, export partner’s GDP and previous export. Hence, I estimate random effects OLS model as a baseline model, taking combined individual effects of destination country and product.
According to Shepherd (2012) and based on the theoretical gravity model developed by Anderson and van Wincoop (2003), symmetric gravity models should be estimated including country fixed effects. Since the estimated model has only one source country and a number of product groups, to be in line with the theory and to avoid losing regressors, I follow Gaure (2011) and Guimarães and Portugal (2010) and estimate the OLS model, taking individual fixed effects either of product or of product and year. In this way I allow for the differences in different product groups and different years, and estimate coefficients of country-specific explanatory variables, i. e., destination, language, contiguity, and the EU and the WTO membership.
According to Santos Silva and Tenreyro (2006), under heteroscedasticity OLS estimator of log-linearized models would be both biased and inconsistent. They suggested that the problem for gravity models would be solved by using the PPML estimator. Moreover, this approach solves the problem of zeros, which are abundant in trade data, however, they drop out of the sample after taking logarithms of export. Martin (2020) compared various estimation techniques of gravity models and suggested that both OLS and PPML estimators are biased, though the PPML estimator is to the lesser extent, and, hence, is a better choice for gravity modelling. Based on these findings and following Correia et al. (2020), I also estimate the gravity model using a PPML approach with high dimensional fixed effects. To have estimates of all the exogeneous variables, I use individual fixed effects either for the product or for the product and the year.
Lithuania’s gravity model is estimated based on 3 different specifications: OLS with random affects, OLS with fixed effects and PPML with fixed effects. Following De Grauwe and Skudelny (2000), Campbell (2010), Olivero and Yotov (2012), to ensure comparability of the models, I use the same model specifications for the estimation of dynamic gravity models.
Reduced form gravity equation for OLS specification is as follows:
 (2)
(2)
Reduced form gravity equation for PPML specification, where dependent variable is the mean of export, is presented below:
 (3)
(3)
3.3 Data Sources
I use the data on Lithuania’s goods export, GDP of Lithuania and its export partners, distance between Lithuania and its export partners, common spoken language, contiguity, and the EU and the WTO membership.
Export data is measured in euros and retrieved from the Lithuanian Department of Statistics database. It provides annual data of export from Lithuania to different countries by each of 96 products classified according to HS 2-digit classification. There is no lower bound for the amount of export accounted. That helps to avoid significant number of zeros in the data which would become meaningless in the OLS model after taking logs.
Annual nominal GDP data of Lithuania and its export partners is taken from the World Bank database. As GDP is measured in constant USD 2010, it was recalculated in euros using the yearly averages of EUR/USD exchange rate, retrieved from the ECB database.
Distance, language, the EU and the WTO membership and common border data were retrieved from the CEPII database designed for gravity modelling. For distance I use population weighted distance between the biggest cities in thousand kilometres (“distw”) which is “based on bilateral distances between the biggest cities of the two countries, those inter-city distances being weighted by the share of the city in the overall country’s population” (Mayer & Zignago, 2011). The measure of common spoken language (“cls”) shows countries’ ability to communicate with each other. It can be between 0 (nobody in the two countries can understand each other) and 1 (every two people taken from the two countries will be able to communicate with each other) (Mélitz & Toubal, 2012). EUc,t is equal to 1 if both Lithuania and country c were members of the EU in year t and 0 otherwise. WTOc,t is equal to 1 if both Lithuania and country c were members of the WTO in year t and 0 otherwise. Finally, common border measure is 1 for Lithuania’s direct neighbours (Poland, Latvia, Russia and Belorussia), and 0 for other countries.
Following Shepherd (2012), the OLS model is estimated taking logs of export, GDP and distance variables. Following Santos Silva and Tenreyro (2006), the PPML model is estimated taking logs of GDP and distance variables.
4. Empirical Findings
4.1 Descriptive Statistics
Table 1 provides descriptive statistics for all the variables. 35.4 % of export data is either zero or missing, another 7.6 % is below 1000 euros. Out of 157 Lithuania’s export partners, 27 countries belong to the EU, 141 countries belong to the WTO, and 4 countries have a common border with Lithuania. These three variables, as well as common spoken language, are constant over the analysed time period.
The smallest distance is between Lithuania and Latvia. Both countries also have a common border. The longest distance is between Lithuania and New Zealand. An index for common spoken language is the highest (above 0.7) between Lithuania and countries where Russian is either mother tongue or widely spoken (Russia, Belorussia, Latvia, Kazakhstan, Kyrgyzstan and Estonia). Countries where English is either mother tongue or widely spoken (i. e., the majority of the EU, as well as Anglo-Saxon countries) comprise the second largest country group. The index between these countries and Lithuania for common spoken language is on average 0.2 – 0.4.
Correlations between log of export in year t and all the exogenous variables (log of the last years’ export, logs of the GDP data, log of distance, index of common spoken language, the EU and the WTO membership and contiguity) are given in Table 2. Evidently, export has the strongest (positive) relationship with its own history. It also seems negatively related to distance and positively related to common spoken language, last years’ GDP of the destination, contiguity and the EU membership. Relationship between Lithuania’s goods export and its own GDP as well as the WTO membership is very weak.
Table 1
Descriptive Statistics
|
Variable |
Obs |
Mean |
SD |
Min |
Max |
Skew. |
Kurt. |
|
Export, MEUR |
52 848 |
3.92 |
24.9 |
0 |
1 070 |
20.78 |
633.75 |
|
Zero / missing values |
35.4 % |
|
|
|
|
|
|
|
Values lower than 1000 eur |
7.55 % |
|
|
|
|
|
|
|
GDPdest,BEUR |
52 848 |
654 |
1 930 |
34.3 |
16 400 |
6.06 |
43.4 |
|
GDPLT, MEUR |
52 848 |
42 900 |
2 090 |
40 300 |
46 300 |
0.50 |
1.81 |
|
Distance (weighted) |
52 848 |
4 793 |
3 804 |
225 |
17 226 |
0.83 |
2.95 |
|
Language |
52 848 |
0.19 |
0.22 |
0 |
0.87 |
1.53 |
5.02 |
|
EU |
52 848 |
0.28 |
0.45 |
0 |
1 |
0.96 |
1.92 |
|
EU member countries |
27 (17 %) |
|
|
|
|
|
|
|
Non-EU countries |
130 (83 %) |
|
|
|
|
|
|
|
WTO |
52 848 |
0.92 |
|
|
|
-2.96 |
9.98 |
|
WTO member countries |
141 (90 %) |
|
|
|
|
|
|
|
Non-WTO countries |
16 (10 %) |
|
|
|
|
|
|
|
Contiguity |
52 848 |
0.04 |
0.20 |
0 |
1 |
4.47 |
20.98 |
|
Contiguous countries |
4 (3 %) |
|
|
|
|
|
|
|
Non-contiguous countries |
153 (97 %) |
|
|
|
|
|
|
Table 2
Matrix of Correlations
|
Variables |
lnExporti,c,t |
lnExporti,c,t-1 |
lnGDPLT,t-1 |
lnGDPc,t-1 |
lnDistc |
lnLangc |
EUc,t |
Contigc |
WTOc,t |
|
ln Exporti,c,t |
1.000 |
|
|
|
|
|
|
|
|
|
ln Exporti,c,t-1 |
0.880 |
1.000 |
|
|
|
|
|
|
|
|
ln GDPLT,t-1 |
0.010 |
0.023 |
1.000 |
|
|
|
|
|
|
|
ln GDPc,t-1 |
0.251 |
0.241 |
0.038 |
1.000 |
|
|
|
|
|
|
ln Distancec |
-0.368 |
-0.372 |
0.024 |
0.079 |
1.000 |
|
|
|
|
|
ln Languagec |
0.338 |
0.344 |
-0.025 |
-0.079 |
-0.531 |
1.000 |
|
|
|
|
EUc,t |
0.266 |
0.258 |
-0.015 |
0.169 |
-0.625 |
0.179 |
1.000 |
|
|
|
Contiguityc |
0.279 |
0.284 |
-0.014 |
0.009 |
-0.437 |
0.576 |
0.051 |
1.000 |
|
|
WTOc,t |
0.026 |
0.022 |
0.009 |
0.176 |
0.090 |
-0.067 |
0.247 |
-0.180 |
1.000 |
4.2 Lithuania’s Gravity Model for 2015–2019
Table 3 presents estimation results for different specifications of Lithuania’s gravity model. The first 5 columns provide estimation results of a static gravity model. The last 5 columns give the results of a dynamic gravity model including last year’s export.
Table 3
Results of the Gravity Equations*
|
Variables |
OLS re |
OLS fe |
OLS fe |
PPML fe |
PPML fe |
OLS re |
OLS fe |
OLS fe |
PPML fe |
PPML fe |
|
Dependent |
Exporting |
Exporting |
Exporting |
Exporting |
Exporting |
Exporting |
Exporting |
Exporting |
Exporting |
Exporting |
|
GDP(LT), t-1 |
1.27322*** |
0.63714*** |
|
0.24771* |
|
0.03779 |
-0.10567 |
|
0.47800*** |
|
|
(0.17126) |
(0.18358) |
|
(0.13997) |
|
(0.11440) |
(0.11552) |
|
(0.09659) |
|
|
|
GDP(dest), t-1 |
0.49046*** |
0.67090*** |
0.67102*** |
0.61623*** |
0.61693*** |
0.18377*** |
0.18323*** |
0.18306*** |
0.05126*** |
0.05081*** |
|
(0.03228) |
(0.02880) |
(0.02881) |
(0.04278) |
(0.04284) |
(0.01697) |
(0.01176) |
(0.01175) |
(0.00648) |
(0.00655) |
|
|
Distance |
-0.90572*** |
-1.24510*** |
-1.24509*** |
-0.95487*** |
-0.95584*** |
-0.27479*** |
-0.29332*** |
-0.29350*** |
-0.10298*** |
-0.10131*** |
|
(0.07631) |
(0.06012) |
(0.06013) |
(0.12161) |
(0.12167) |
(0.03720) |
(0.02351) |
(0.02347) |
(0.02069) |
(0.02118) |
|
|
Language |
3.38139*** |
4.36068*** |
4.36278*** |
3.06216*** |
3.06331*** |
1.00830*** |
1.08814*** |
1.08704*** |
0.14941** |
0.15180** |
|
(0.32659) |
(0.27085) |
(0.27121) |
(0.38578) |
(0.38582) |
(0.15168) |
(0.10866) |
(0.10856) |
(0.06899) |
(0.06981) |
|
|
EU |
0.30979*** |
0.09383 |
0.09410 |
0.02523 |
0.02490 |
0.14298*** |
0.08855*** |
0.08806*** |
-0.05850* |
-0.05600* |
|
(0.11585) |
(0.09501) |
(0.09509) |
(0.13352) |
(0.13351) |
(0.04115) |
(0.02593) |
(0.02589) |
(0.03111) |
(0.02969) |
|
|
Common border |
0.85904*** |
0.28941* |
0.29002* |
-0.00750 |
-0.00831 |
0.28751*** |
0.07325 |
0.07312 |
-0.00485 |
-0.00472 |
|
(0.18571) |
(0.15383) |
(0.15396) |
(0.12824) |
(0.12824) |
(0.07171) |
(0.04766) |
(0.04761) |
(0.02474) |
(0.02486) |
|
|
WTO |
-0.02765 |
0.28568*** |
0.28479*** |
0.51987*** |
0.51890*** |
-0.01820 |
0.01880 |
0.01974 |
0.10759** |
0.10516** |
|
(0.09866) |
(0.08846) |
(0.08846) |
(0.19270) |
(0.19275) |
(0.05221) |
(0.03434) |
(0.03434) |
(0.05101) |
(0.05126) |
|
|
Exporting, t-1 |
|
|
|
|
|
0.62314*** |
0.72562*** |
0.72570*** |
0.86836*** |
0.86898*** |
|
|
|
|
|
|
(0.01576) |
(0.01084) |
(0.01082) |
(0.01624) |
(0.01625) |
|
|
Constant |
yes |
yes |
yes |
yes |
yes |
yes |
yes |
yes |
yes |
yes |
|
Individual effects |
ctry, prod |
product |
prod, year |
product |
prod, year |
ctry, prod |
product |
prod, year |
product |
prod, year |
|
R-squared |
26.97 |
54.34 |
54.37 |
73.64 |
73.77 |
76.19 |
79.32 |
79.33 |
95.62 |
95.67 |
|
Observations |
28,077 |
28,077 |
28,077 |
28,077 |
28,077 |
24,020 |
24,020 |
24,020 |
24,838 |
24,838 |
Note. * Robust standard errors are clustered by product and given in parentheses: *** p < 0.01, ** p < 0.05, * p < 0.1
Table 3 shows similar results for all the specifications. Destinations’ GDP, distance and common spoken language have expected signs and are highly significant in all the models. Coefficients of the static gravity equation for destinations GDP and distance are in line with the results of other empirical gravity models. According to Head and Mayer (2014), mean estimates of destination’s GDP and distance in structural gravity models are 0.58 and -1.1 respectively. They are very similar to my estimates of these variables for Lithuania (between 0.5–0.67 for destination’s GDP and between 0.9–1.2 for distance). Obvious differences lie in the estimates of common spoken language and common border. Head and Mayer (2014) claims that the average values of these coefficients are 0.39 and 0.66 respectively. However, my estimate for common spoken language in Lithuania amounts to between 3 and 4, and the estimate for contiguity is very fluctuating: from strongly significant and amounting to 0.86 in the random effects OLS model to even non-significant in the PPML model.
Much higher coefficient estimates for common spoken language may be specific for Lithuania and represent not only the language, but also other cultural, historical and geographical factors, i. e., many people in Lithuania, especially older ones, speak Russian, and Lithuania indeed had developed trade relations with the former Soviet bloc countries. However, common spoken language could not be the only factor for that. The other ones could be the knowledge of Russian work culture, historical trade relations, Lithuania’s position as a gateway between the east and the west, etc. Fluctuations for contiguity could be the result of very different neighbours of Lithuania: on the one hand there are EU member states Latvia and Poland, on the other hand there are authoritarian and unpredictable states of Russia and Belarus. The effects of origins’ GDP, the EU and the WTO membership are also ambiguous.
Judging by the determination coefficients, fixed effects OLS and PPML models are more suitable to model Lithuania’s export. The dynamic gravity model specified under PPML specification explains export fluctuations the best. If year fixed effects are included, they eliminate origins’ GDP. However, it does not have any significant impact on the results.
Estimation results suggest that Lithuania’s goods export depends on its own history, destinations’ GDP, distance and common spoken language the most, while the other explanatory variables remain ambiguous and tend to change signs depending on the model or inclusion of other variables.
4.3 Results and Discussion on Actual and Fitted Export in 2020
In this section I use coefficients estimated in the gravity model to forecast export for the year 2020. For predictions I estimate the dynamic gravity model under PPML specification with product-only fixed effects for the period of 2015–2019. This model was chosen because it had much stronger explanative power in terms of determination coefficients. Next, estimated coefficients and product fixed effects are used to calculate predicted export values of each product to each destination country for 2020.
Figure 1 plots actual export against fitted export values (in millions EUR) for the whole regression period (2015–2019), and for the last three years (2018, 2019 and 2020). The graphs also contain a 45-degree line. For the sake of visuality, each annual graph lacks one outlier point: every year since 2017 Lithuania exported to Russia machinery, mechanical appliances and their parts (HS 84) for more than 1000 MEUR. The model predictions of this point were accurate: very close to 1000 MEUR for all the years.
Figure 1
Actual versus Fitted Export Plots Including a 45-degree Line
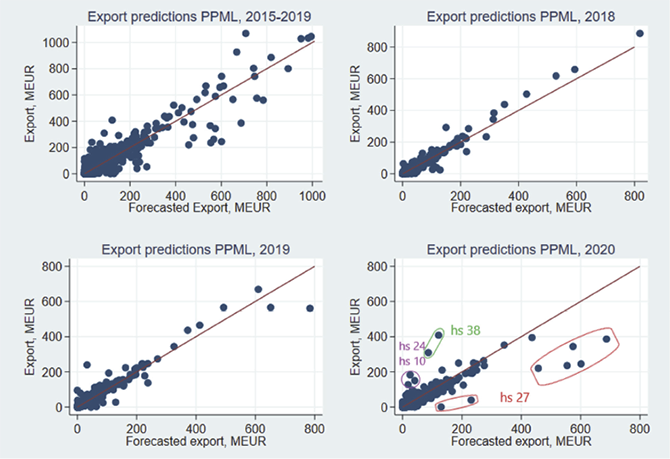
The upper left graph shows that export predictions made by the PPML model are reasonably good. The upper right graph shows that the predictions of the model fit to actual data very well for 2018. For 2019 (the lower graph on the left) there are 2-3 outliers. All of them mispredicted Lithuania’s export of mineral fuels.
The lower right graph in Figure 1 also shows that export predicted for 2020 was a good fit for the actual values of 2020. Still, there are three groups of points for which predictions were not very accurate.
All 7 points that are below the 45-degree line in the lower right graph in Figure 1 show Lithuania’s export of mineral fuels (HS 27) to Estonia, Latvia, Poland, Ukraine, Singapore, Saudi Arabia and the USA. Export of mineral fuels to these countries gradually increased since 2016, however, it dropped drastically in 2020 (see Figure A1 in the Appendix). This could be the direct effect of the Covid-19 pandemic, because in 2020, many people started to work from home and commuted less.
Two points above the 45-degree line for which predicted export was below 200 MEUR and actual export exceed 300 MEUR show Lithuania’s export of miscellaneous chemical products (HS 38) to the Netherlands and the USA. This export shows a steep and underpredicted increase in 2020 (see upper graph in Figure A2 in the Appendix). The reason for it could be either the outbreak of the pandemic, or the result of strengthening of business relations with these countries.
Finally, 3 points above the 45-degree line, where predicted export was below 50 MEUR and actual export was either close to or even exceeded 150 MEUR, are Lithuania’s export of tobacco to the Netherlands and the USA, and cereals to Nigeria (see lower graph in Figure A2 in the Appendix). In 2020, Lithuania produced almost 30 % more of cereals than in 2019 (Statistics Lithuania, 2022), however, its overall export of cereals decreased sharply. Hence, the cause of the increase of export of cereals to Nigeria could be the sign of trade diversion and strengthening of business relations with this country. The rise of tobacco products export could be influenced by the Covid-19 restrictions when after the closure of regular entertainment places (e. g., theatres, cinemas, cafes, supermarkets, etc.) people probably increased their spending on still available leisure goods: alcohol and tobacco.
Overall, the analysis shows that the pandemic year negatively affected Lithuania’s export of mineral fuels and positively affected its export of tobacco and chemical products to a number of countries. I find no significant impact of the pandemic year on Lithuania’s export of other goods to any specific countries.
4.4 Changes of Lithuania’s Export Structure during the Pandemic
To analyse the changes of Lithuania’s export structure more thoroughly, I include a dummy for 2020 and estimate separate dynamic gravity model regressions specified under simple PPML and OLS specifications for each of the 96 product groups (in subsection 4.4.1) or for each of 157 export destinations (in subsection 4.4.2). The aim of this research is to investigate if Lithuania’s export structure changed in the pandemic year.
4.4.1 Effects of the Pandemic Year by Product Group
In this section, I estimate dynamic gravity model regressions including a dummy for 2020 for each of the 96 product groups. I estimate each regression for one country of origin (Lithuania) and only one product group, hence, there are no fixed effects. Dependent variable is Lithuania’s export of product i to country c in year t (logged in OLS model). Independent variables are: last years’ export of product i to country c (logged in OLS model), log of last years’ GDP of country c, log of distance to country c, common spoken language between Lithuania and country c, the EU and the WTO membership, and contiguity.
The products for which both regressions and the dummy were significant are listed in Table A1 in the Appendix. Both OLS and PPML models indicate that 2020 significantly negatively affected Lithuania’s export of 2 product groups: the articles of apparel and clothing accessories (HS 61) and articles of stone, plaster, cement and similar (HS 68). Both models indicate significant positive effect of 2020 on only one product group: albuminoidal substances, modified starches, glues and enzymes (HS 35).
According to the OLS model, the year 2020 positively affected Lithuania’s export of albuminoidal substances, fruits, vegetables, various edible preparations, organic chemicals and wadding products. Negative effects were observed for exports of wool, vegetable textile fibres, clothing accessories, articles of stone, plastic, cement or similar and miscellaneous manufactured articles.
According to the PPML model, the year 2020 positively affected Lithuania’s export of albuminoidal substances, tobacco, chemical products, worn textiles, ships or boats and musical instruments. Significantly negative export effects were observed for meat, products of milling industry, tanning or dying extracts, oils, plastics, silk, textile, knitted or crocheted fabrics, clothing accessories, footwear, articles of stone, plastic, cement, copper, nickel, lead, cutlery, mineral fuels, vehicles and furniture.
Results indicate that the year 2020 had some effects on Lithuania’s goods export. Negative effects were recorded mainly for the export of meat, clothing, footwear, cutlery, vehicles, furniture and various articles of stone, plastic, cement, copper, nickel and lead. Positive effects were observed mainly for albuminoidal substances, food, tobacco, chemical products, ships or boats and musical instruments.
Although the effect of the pandemic year on Lithuania’s export was very moderate, the results do show some heterogeneity. As expected, the export of leisure goods, such as tobacco, ships or boats and musical instruments increased during the pandemic year. Expectedly negative effects include export of clothing, footwear, vehicles and mineral fuels. Surprisingly, export of furniture decreased significantly during the pandemic year.
4.4.2 Effects of the Pandemic Year by Country
In this section, I estimate dynamic gravity model regressions including a dummy for 2020 for each of the 157 Lithuania’s export markets. As each regression is estimated for one country of origin and only one export destination, regressors are limited to the last years’ export of product i to country c (logged in OLS model), log of the last years’ GDP of country c and the dummy variable.
The list of the countries for which both regressions and the dummy variable were significant are listed in Table A2 in the Appendix. Although there are a number of export destinations for which the year 2020 was significant, almost all these markets have negligible shares in Lithuania’s export structure. The only countries having significant dummies and shares in Lithuania’s export structure above 1% are Russia, Estonia, Belarus and Ukraine. Still, the only country which has a significant dummy of 2020 in both PPML and OLS models is Russia. For all these countries the sign of the dummy of 2020 was negative, i. e., the pandemic year negatively affected Lithuania’s export to these markets.
Figure 2
Lithuania’s Export Dynamics to Selected Countries, 2015-2020
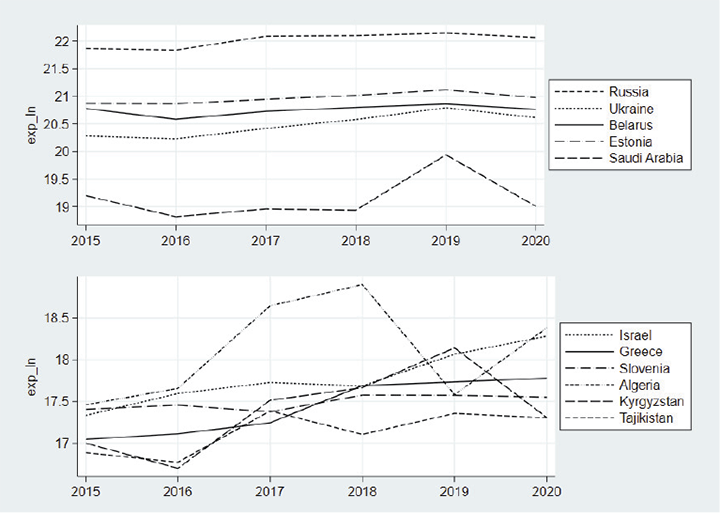
Lithuania’s export dynamics to the countries for which regressions and the dummy variables were significant, and for which Lithuania’s export share in 2020 exceeded 0.1 % is presented in Figure 2. Figure 2 shows that Lithuania’s export to Russia, Estonia, Ukraine and Belarus was gradually increasing in the period of 2016-2019, but dropped in 2020. Similar patterns could be noticed for Slovenia, Tajikistan and Kyrgyzstan. The growth of Lithuania’s export to Greece also slowed down in 2020. For Belarus this decrease could show either the effect of pandemic restrictions or political instability, because of the beginning of economic sanctions to the country. Since there were no significant changes in the political situation in other countries, the pandemic and its restrictions are probable reasons for the decline of export.
Lithuania’s export to Algeria and Saudi Arabia fluctuated dramatically in 2019, and in 2020, it mainly regained the level of 2018. Finally, Israel shows the increase of Lithuania’s export and positive effect of the dummy of 2020. Since Lithuania’s export to Israel started to increase in 2019 already, the reason of another increase in 2020 could be just strengthening of business relations, and not necessarily trade diversion due to an effective pandemic management in Israel.
Since Lithuania’s export to the majority of the other countries listed in Table A2 in the Appendix was rather negligible, and most of these countries are remote and casual Lithuania’s trade partners, significant dummy of 2020 could show not the effect of the pandemic, but random trade creation or diversion.
Overall, the analysis shows that the pandemic year had some effect on Lithuania’s goods export to a limited number of countries.
4.5 The Impact of Distance during the Pandemic
In this section I examine the changes of regression coefficients over time. Pandemic resulted in border closures, as well as a number of restrictions which changed unpredictably differed by country and made international trade much more difficult. Therefore, it could be hypothesised that distance became more important in 2020, because these trade burdens could result in exporters’ focus on the near markets.
I estimate a static gravity model for Lithuania specified under PPML specification for each year between 2015 and 2020. Reduced form gravity equation is as follows:
 (4)
(4)
Here  stands for the mean of Lithuania’s export of product i to country c in year t, and ui,t represents product fixed effect. Origin’s GDP is omitted because it varies only by year, and in this analysis I estimate separate regressions for each year.
Estimation results are given in Figure 3. Contrary to the hypothesis, the importance of distance to trade does not demonstrate any significant changes in 2020. Neither does the importance of the last years’ GDP of the destination country and the EU membership. Although the coefficient of the WTO membership slightly dropped, and the coefficient of the common spoken language slightly increased, the changes were minor. The only seemingly larger change was by the common border coefficient, however, this coefficient itself was insignificant for the whole period.
Figure 3
Dynamics of the Coefficients of the Static PPML Gravity Model
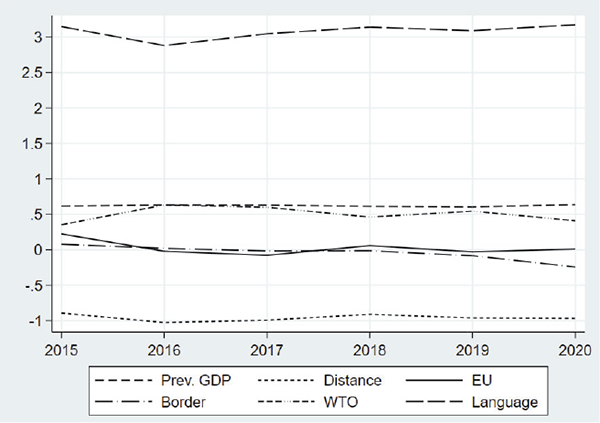
I also tested for structural breaks in both static and dynamic gravity models specified under OLS specification. In both cases the result was that regression coefficients in 2020 were not different from their values in previous years.
Therefore, I conclude that for Lithuania’s international trade the year of the pandemic was not different from previous years. There were no significant changes in the importance of any trade-effecting factors.
5. Conclusions
Motivated by the start of the Covid-19 pandemic, which resulted in massive travel restrictions, border closures and business losses, I investigate the effects of pandemic year on the export structure of Lithuania. I apply the theory of gravity modelling and seek to examine heterogeneity of the effects of the pandemic year for different product sectors and different Lithuania’s export markets. I also hypothesize that distance became more important for choosing export destinations during 2020.
Empirical findings suggest that the first pandemic year indeed had heterogeneous impact on Lithuania’s export. As expected, the export of leisure goods, such as tobacco, ships or boats and musical instruments increased. Positive effects are also seen for food, albuminoidal substances and chemical products. Expected negative effects were for Lithuania’s export of meat, clothing, footwear, vehicles and mineral fuels. However, the decrease of the export of cutlery, furniture and various articles of stone, plastic, cement, copper, nickel and lead is somewhat of a surprise.
I find that the year of Covid-19 negatively affected Lithuania’s goods export to Estonia, Ukraine, Russia, Slovenia, Kyrgyzstan and Tajikistan, and positively affected Lithuania’s export to Israel. Still, the analysis doesn’t allow us to claim that the Covid-19 pandemic was a primary reason of these changes.
The research shows that the first pandemic year had negligible, yet heterogeneous effects on Lithuania’s goods export in terms of both countries and product groups. In spite of a number of travel restrictions, distance did not become more important for international trade than it was before the pandemic, and nor did other factors.
The paper gives insight on the influence of export determinants as well as which Lithuania’s export sectors and partners are more or less vulnerable to external shocks. I hope that knowing these aspects could help public institutions to make decisions which economic sectors are to be promoted and investing in these sectors encouraged.
My findings suggest possible further extensions of the research. First, I analysed only Lithuania’s export structure. Having more data and including more countries of origin would allow researchers to estimate a full gravity model and generalise the findings for a greater number of countries. Second, the Covid-19 pandemic could have not only short-term, but also long-term effects. The impact of the pandemic could appear not at once, but with a time lag. Hence, similar analysis in a couple of years when pandemic is over would give deeper insight and more robust results for its influence on international trade. Third, this analysis is more about the structural changes of Lithuania’s export during the first pandemic year. Having monthly data and including variables showing the severity of Covid-19 would allow researchers to make more robust conclusions about the impact of the pandemic.
Acknowledgements
I am especially grateful to Linas Čekanavičius and Algirdas Miškinis from Vilnius University for reading the paper and giving valuable suggestions, as well as Algirdas Bartkus from Vilnius University and Firat Demir from University of Oklahoma for helpful discussions. All remaining errors are mine.
References
Anderson, J. E. (1979). A Theoretical Foundation for the Gravity Equation. American Economic Review, 69(1), 106–116. https://doi.org/10.2307/1802501
Anderson, J. E. (2011). The Gravity Model. Annual Review of Economics, 3, 133–160. https://doi.org/10.1146/annurev-economics-111809-125114
Anderson, J. E., & van Wincoop, E. (2003). Gravity with Gravitas: A Solution to the Border Puzzle. American Economic Review, 93(1), 170–192. https://doi.org/10.1257/000282803321455214
Arriola, C., Kowalski, P., & van Tongeren, F. (2021). The Impact of Covid-19 on directions and structure of international trade. OECD Trade Policy Working Paper No 252. https://doi.org/10.1787/0b8eaafe-en
Barichello, R. (2021). Revisiting the effects of the Covid-19 pandemic on Canada’s agricultural trade: The surprising case of an agricultural export boom. Canadian Journal of Agricultural Economics, 69(2), 251–260. https://doi.org/10.1111/cjag.12285
Brinca, P., Duarte, J. B., & Faria-e-Castro, M. (2020). Is the COVID-19 Pandemic a Supply or a Demand Shock? Economic Synopses, 31. https://doi.org/10.20955/es.2020.31
Bussière, M., & Schnatz, B. (2006). Evaluating China’s integration in world trade with a gravity model based benchmark. European Central Bank Working Paper No 693. https://www.ecb.europa.eu//pub/pdf/scpwps/ecbwp693.pdf
Campbell, D. L. (2010). History, culture, and trade: A dynamic gravity approach. Munich Personal RePEc Archive, Working Paper No 24014. http://mpra.ub.uni-muenchen.de/24014/
Carrère, C. (2006). Revisiting the effects of regional trade agreements on trade flows with proper specification of the gravity model. European Economic Review, 50(2), 223–247. https://doi.org/10.1016/j.euroecorev.2004.06.001
Chaney, B. T. (2014). The Network Structure of International Trade. The American Economic Review, 104(11), 3600-3634. http://dx.doi.org/10.1257/aer.104.11.3600
Cheval, S., Adamescu, C. M., Georgiadis, T., Herrnegger, M., Piticar, A., & Legates, D. R. (2020). Observed and Potential Impacts of the Covid-19 Pandemic on the Environment. International Journal of Environmental Research and Public Health, 17(11), 1–25. https://doi.org/10.3390/ijerph17114140
Correia, S., Guimarães, P., & Zylkin, T. Z. (2020). Fast Poisson Estimation with High-Dimensional Fixed Effects. Stata Journal, 20(1), 95–115. https://doi.org/10.1177/1536867X20909691
Davidescu, A. A. M., Popovici, O. C., & Strat, V. A. (2021). An empirical analysis using panel data gravity models and scenario forecast simulations for the Romanian exports in the context of Covid-19. Economic Research-Ekonomska Istrazivanja, 1–25. https://doi.org/10.1080/1331677X.2021.1907205
De Grauwe, P., & Skudelny, F. (2000). The impact of EMU on trade flows. Weltwirtschaftliches Archiv, 136(3), 400–402. https://doi.org/10.1007/bf02707286
Eaton, J., & Kortum, S. (2001). Trade in Capital Goods. European Economic Review, 45(7), 1195-1235. https://doi.org/10.1016/S0014-2921(00)00103-3
Egger, P. (2002). An Econometric View on the Estimation of Gravity Models and the Calculation of Trade Potentials. World Economy, 25(2), 297–312. https://doi.org/10.1111/1467-9701.00432
European Centre for Disease Prevention and Control. (2021). Data on country response measures to COVID-19. Retrieved November, 2021 from https://www.ecdc.europa.eu/en/publications-data/download-data-response-measures-covid-19
Gaure, S. (2011). OLS with Multiple High Dimensional Category Dummies. Memorandum, 14/2010.
Greene, W. (2013). Export potential for US advanced technology goods to India using a gravity model approach. US International Trade Commission, Working Paper No 2013-03B, 1(43). https://www.usitc.gov/publications/332/EC201303B.pdf
Guimarães, P., & Portugal, P. (2010). A simple feasible procedure to fit models with high-dimensional fixed effects. Stata Journal, 10(4), 628–649. https://doi.org/10.1177/1536867x1101000406
Hayakawa, K., & Mukunoki, H. (2021). The impact of Covid-19 on international trade: Evidence from the first shock. Journal of the Japanese and International Economies, 60(2021). https://doi.org/10.1016/j.jjie.2021.101135
Head, K., & Mayer, T. (2014). Gravity Equations: Workhorse, Toolkit, and Cookbook. In G. Gopinath, E. Helpman, & K. Rogoff (Eds.), Handbook of International Economics, (vol. 4, pp. 131–195). Elsevier. https://doi.org/10.1016/B978-0-444-54314-1.00003-3
Helpman, E., Melitz, M., & Rubinstein, Y. (2008). Estimating Trade Flows: Trading Partners and Trading Volumes. Quarterly Journal of Economics, 123(2), 441–487. https://doi.org/10.1162/qjec.2008.123.2.441
Kaye, A. D., Okeagu, C. N., Pham, A. D., Silva, R. A., Hurley, J. J., Arron, B. L., Sarfraz, N., Lee, H. N., Ghali, G. E., Gamble, J. W., Liu, H., Urman, R. D., & Cornett, E. M. (2021). Economic impact of Covid-19 pandemic on healthcare facilities and systems: International perspectives. Best Practice and Research: Clinical Anaesthesiology, 35(3), 293–306. https://doi.org/10.1016/j.bpa.2020.11.009
Kristjánsdóttir, H. (2005). A Gravity Model for Exports from Iceland. Centre for Applied Microeconometrics Working Paper, 1–57. http://core.kmi.open.ac.uk/download/pdf/6679353.pdf
Lin, B., & Zhang, Y. Y. (2020). Impact of the COVID-19 pandemic on agricultural exports. Journal of Integrative Agriculture, 19(12), 2937–2945. https://doi.org/10.1016/S2095-3119(20)63430-X
Martin, W. (2020). Making Gravity Great Again. World Bank Group, Policy Research Working Paper No 9391. https://doi.org/10.1596/1813-9450-9391
Mayer, T., & Zignago, S. (2011). The GeoDist database on bilateral geographical information. CEPII Working Paper No 2011-25. http://www.cepii.fr/anglaisgraph/bdd/distances.htm%0Ahttp://www.cepii.fr/CEPII/en/publications/wp/abstract.asp?NoDoc=3877%0Ahttp://www.cepii.fr/CEPII/en/bdd_modele/presentation.asp?id=6
Mélitz, J., & Toubal, F. (2012). Native Language, Spoken Languages, Translation and Trade. CEPII Working Paper No 2012-17.
Mnasri, A., & Nechi, S. (2021). New nonlinear estimators of the gravity equation. Economic Modelling, 95, 192–202. https://doi.org/10.1016/j.econmod.2020.12.011
Olivero, M. P., & Yotov, Y. V. (2012). Dynamic gravity: Endogenous country size and asset accumulation. The Canadian Journal of Economics, 45(1), 64-92. https://www.jstor.org/stable/41485640
Pradhan, A.K., Rout, S., & Khan, I.A. (2021). Does market concentration affect wholesale electricity prices? An analysis of the Indian electricity sector in the COVID-19 pandemic context. Utilities Policy, 73, 101305. https://doi.org/10.1016/j.jup.2021.101305
Ritchie, H., Mathieu, E., Rodés-Guirao, L., Appel, C., Giattino, C., Ortiz-Ospina, E., Hasell, J., Macdonald, B., Beltekian, D. & Roser, M. (2020). Coronavirus Pandemic (Covid-19). Our World in Data. Retrieved from https://ourworldindata.org/coronavirus
Salette, G., & Tinbergen, J. (1965). Shaping the world economy. Suggestions for an International economic policy. Revue économique, 16(5), 195-311. https://doi.org/10.2307/3498790
Sangwan, S., Nayak, N. C., Sangwan, V., & Pradhan, A. K. (2021). Covid-19 pandemic: Challenges and ways forward for the Indian microfinance institutions. Journal of Public Affairs, 21(4). https://doi.org/10.1002/pa.2667
Santos Silva, J. M. C., & Tenreyro, S. (2006). The Log of Gravity. Review of Economics and Statistics, 88(4), 641–658. https://doi.org/10.1162/rest.88.4.641
Shahriar, S., Kea, S., Abdullahi, N. M., Rahman, R., & Islam, R. M. (2021). Determinants of Bangladesh’s Leather Exports to Its Major Trade Partners: A Panel Gravity Model Approach. Global Business Review, 1-22. https://doi.org/10.1177/09721509211036288
Shepherd, B. (2012). The Gravity Model of International Trade: A User Guide. United Nations Publication.
Sigala, M. (2020). Tourism and Covid-19: Impacts and implications for advancing and resetting industry and research. Journal of Business Research, 117(June), 312–321. https://doi.org/10.1016/j.jbusres.2020.06.015
Statistics Lithuania. (2022). Official Statistics Portal. Retrieved January 21, 2022, from https://osp.stat.gov.lt/statistiniu-rodikliu-analize?hash=0735430b-98ae-4dab-ab66-deaa603a01c8#/
World Bank. (2021). World Bank database. Retrieved December, 2021 from https://data.worldbank.org/
Worldometer. (2021). Covid-19 coronavirus pandemic. Retrieved December 15, 2021, from https://www.worldometers.info/coronavirus/
Zainuddin, M. R. K. V., Shukor, M. S., Zulkifli, M. S., & Abdullah, A. H. (2021). Dynamics of Malaysia’s bilateral export post Covid -19: A gravity model analysis. Jurnal Ekonomi Malaysia, 55(1), 51–69. https://doi.org/10.17576/JEM-2021-5501-4
Zainuddin, M. R. K. V, Khairuddin, N. A., & Hamidi, H. N. A. (2022). Impact of Covid-19 on Malaysia’s Bilateral Export: Testing for Heterogeneous Effects in the Product Category. Asian Economics Letters, 3, 1–5. https://doi.org/10.46557/001c.25386
Zhao, Y., & Watterston, J. (2021). The changes we need: Education post Covid-19. Journal of Educational Change, 22(1), 3–12. https://doi.org/10.1007/s10833-021-09417-3
Zhao, Y., Zhang, H., Ding, Y., & Tang, S. (2021). Implications of Covid-19 Pandemic on China’s Exports. Emerging Markets Finance and Trade, 57(6), 1716–1726. https://doi.org/10.1080/1540496X.2021.1877653
Appendix
Figure A1
Lithuania’s Export of Mineral Fuels to Selected Countries
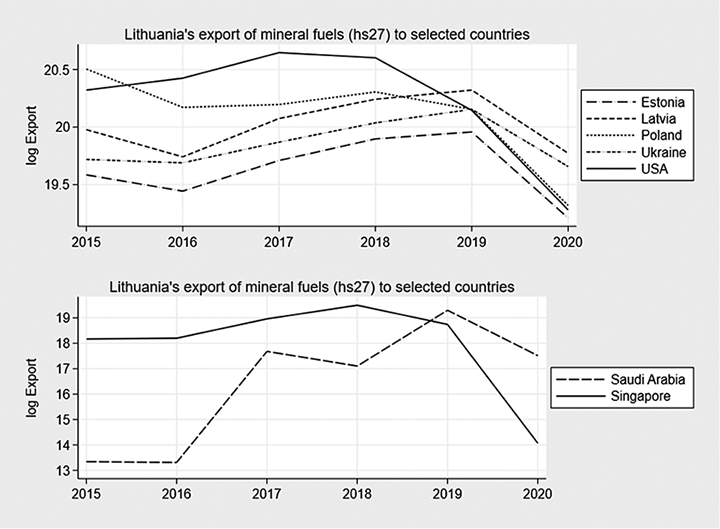
Figure A2
Lithuania’s Export of Chemical Products, Tobacco and Cereals to Selected Countries
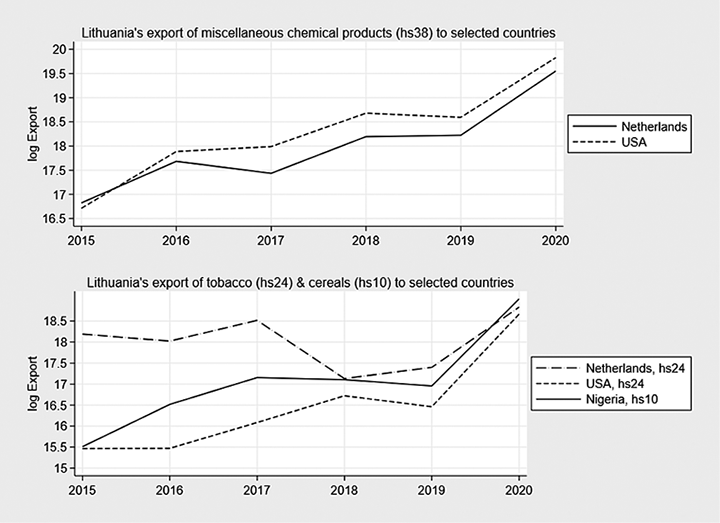
Table A1
Products for which both the Regression and the Dummy of 2020 was Significant
|
Dynamic gravity model, PPML |
Dynamic gravity model, OLS |
||||
|
hs |
Product description** |
Effect* |
hs |
Product description** |
Effect* |
|
02 |
Meat and edible meat offal |
Negative |
07 |
Edible vegetables and certain roots and tubers |
Positive |
|
11 |
Products of the milling industry; malt; starches; inulin; wheat gluten |
Negative |
08 |
Edible fruit and nuts; peel of citrus fruit or melons |
Positive |
|
24 |
Tobacco and manufactured tobacco substitutes |
Positive |
19 |
Preparations of cereals, flour, starch or milk; pastry-cooks products |
Positive |
|
27 |
Mineral fuels, mineral oils and products of their distillation; bituminous substances; mineral waxes |
Negative |
21 |
Miscellaneous edible preparations |
Positive |
|
32 |
Tanning or dyeing extracts; tannins and their derivatives; dyes, pigments and other colouring matter; paints and varnishes; putty and other mastics; inks |
Negative |
29 |
Organic chemicals |
Positive |
|
33 |
Essential oils and resinoids; perfumery, cosmetic or toilet preparations |
Negative |
35 |
Albuminoidal substances; modified starches; glues; enzymes |
Positive |
|
35 |
Albuminoidal substances; modified starches; glues; enzymes |
Positive |
51 |
Wool, fine or coarse animal hair; horsehair yarn and woven fabric |
Negative |
|
38 |
Miscellaneous chemical products |
Positive |
53 |
Other vegetable textile fibres; paper yarn and woven fabrics of paper yarn |
Negative |
|
39 |
Plastics and articles thereof |
Negative |
56 |
Wadding, felt and nonwovens; special yarns; twine, cordage, ropes and cables and articles thereof |
Positive |
|
50 |
Silk |
Negative |
61 |
Articles of apparel and clothing accessories, knitted or crocheted |
Negative |
|
59 |
Impregnated, coated, covered or laminated textile fabrics; textile articles of a kind suitable for industrial use |
Negative |
68 |
Articles of stone, plaster, cement, asbestos, mica or similar materials |
Negative |
|
60 |
Knitted or crocheted fabrics |
Negative |
96 |
Miscellaneous manufactured articles |
Negative |
|
61 |
Articles of apparel and clothing accessories, knitted or crocheted |
Negative |
|
|
|
|
62 |
Articles of apparel and clothing accessories, not knitted or crocheted |
Negative |
|
|
|
|
63 |
Other made up textile articles; sets; worn clothing and worn textile articles; rags |
Positive |
|
|
|
|
64 |
Footwear, gaiters and the like; parts of such articles |
Negative |
|
|
|
|
68 |
Articles of stone, plaster, cement, asbestos, mica or similar materials |
Negative |
|
|
|
|
74 |
Copper and articles thereof |
Negative |
|
|
|
|
75 |
Nickel and articles thereof |
Negative |
|
|
|
|
78 |
Lead and articles thereof |
Negative |
|
|
|
|
82 |
Tools, implements, cutlery, spoons and forks, of base metal; parts thereof of base metal |
Negative |
|
|
|
|
87 |
Vehicles other than railway or tramway rolling-stock, and parts and accessories thereof |
Negative |
|
|
|
|
89 |
Ships, boats and floating structures |
Positive |
|
|
|
|
92 |
Musical instruments; parts and accessories of such articles |
Positive |
|
|
|
|
94 |
Furniture; bedding, mattresses, mattress supports, cushions and similar stuffed furnishings; lamps and lighting fittings, not elsewhere specified or included; illuminated signs, illuminated name-plates and the like; prefabricated buildings |
Negative |
|
|
|
* Effect shows whether the dummy of 2020 is positive or negative.
** Products significant under both PPML and OLS specifications are marked in bold.
Table A2
Countries for which both the Regression and the Dummy of 2020 was Significant
|
Dynamic gravity model, PPML |
Dynamic gravity model, OLS |
||||||
|
iso3 |
Country |
Effect* |
Export share**, % |
iso3 |
Country |
Effect* |
Export share**, % |
|
643 |
Russian Federation |
Negative |
13.71 |
643 |
Russian Federation |
Negative |
13.71 |
|
804 |
Ukraine |
Negative |
3.20 |
233 |
Estonia |
Negative |
4.60 |
|
682 |
Saudi Arabia |
Negative |
0.64 |
112 |
Belarus |
Negative |
3.73 |
|
012 |
Algeria |
Negative |
0.34 |
300 |
Greece |
Negative |
0.19 |
|
376 |
Israel |
Positive |
0.31 |
705 |
Slovenia |
Negative |
0.15 |
|
417 |
Kyrgyzstan |
Negative |
0.12 |
120 |
Cameroon |
Positive |
0.03 |
|
762 |
Tajikistan |
Negative |
0.12 |
716 |
Zimbabwe |
Positive |
0.00 |
|
504 |
Morocco |
Negative |
0.10 |
|
|
|
|
|
218 |
Ecuador |
Positive |
0.01 |
|
|
|
|
|
008 |
Albania |
Negative |
0.01 |
|
|
|
|
|
694 |
Sierra Leone |
Negative |
0.00 |
|
|
|
|
|
68 |
Bolivia |
Positive |
0.00 |
|
|
|
|
|
148 |
Chad |
Positive |
0.00 |
|
|
|
|
|
598 |
Papua New Guinea |
Positive |
0.00 |
|
|
|
|
|
328 |
Guyana |
Negative |
0.00 |
|
|
|
|
|
624 |
Guinea-Bissau |
Negative |
0.00 |
|
|
|
|
|
096 |
Brunei Darussalam |
Positive |
0.00 |
|
|
|
|
|
140 |
Central African Republic |
Negative |
0.00 |
|
|
|
|
|
242 |
Fiji |
Negative |
0.00 |
|
|
|
|
* Effect shows whether the dummy of 2020 is positive or negative.
** Share of Lithuania‘s export to the specific country in total Lithuania‘s export in 2020, %