Organizations and Markets in Emerging Economies ISSN 2029-4581 eISSN 2345-0037
2022, vol. 13, no. 2(26), pp. 490–514 DOI: https://doi.org/10.15388/omee.2022.13.90
Trade Integration and Export Aspiration: Evidence from India’s Trade in Goods with BRICS Countries
Mudaser Ahad Bhat (corresponding author)
Assistant Professor, Department of Data Science, Christ University Lavasa-Pune, India
https://orcid.org/0000-0002-2343-0877
mudaserahadbhat1990@gmail.com
Aamir Jamal
University of Kashmir, Srinagar, India
https://orcid.org/0000-0002-4892-9324
aamirjamal06@gmail.com
Mirza Nazrana Beg
Cluster University-ASC, India
https://orcid.org/0000-0003-1961-0207
mirza.econ101@gmail.com
Abstract. The purpose of this study was to examine the dynamics of trade between India and the BRICS countries as well as to gauge the relative strength of Indian exports to those nations. The trade integration patterns among BRICS countries were also analyzed. To quantify the extent to which India’s exports correspond to the needs of its BRICS counterparts, a novel export aspiration index was constructed. The index of trade integration patterns has also been employed to quantify India’s trade integration pattern with other BRICS members. Further, the gravity model of trade has been employed to analyze the fundamentals of India–BRICS trade. The export aspiration in individual BRICS countries shows a diverse pattern. However, India’s export aspiration in these countries has improved, although marginally in the long run. Such empirical evidence substantiates that the relative strength of India’s exports within its BRICS counterparts has marginally improved over time. Moreover, the trade integration index indicates a similar trade integration pattern among the BRICS countries and corroborates the presence of inter-industry trade. Added to the conventional variables of the gravity model, India’s outward multilateral trade resistance and BRICS inward multilateral trade resistance significantly promote India–BRICS trade. Hence, the relative strength of Indian exports will increase substantially if India’s commodity composition is diversified by including more commodities in its export baskets that correspond to the needs and changing conditions of the BRICS economies.
Keywords: India–BRICS Trade, Export Aspiration, Gravity Model, Multilateral Trade Resistances
Received: 31/3/2022. Accepted: 25/10/2022
Copyright © 2022 Mudaser Ahad Bhat, Aamir Jamal, Mirza Nazrana Beg. Published by Vilnius University Press. This is an Open Access article distributed under the terms of the Creative Commons Attribution Licence, which permits unrestricted use, distribution, and reproduction in any medium, provided the original author and source are credited.
1. Introduction
Since the turn of the 21st century, developing countries have been at the forefront of global growth and a major source of economic activity. The growth rates of Brazil, India, and China are indicative of this phenomenon. Based on GDP, they are the largest and fastest-growing economies among the major economies of the world. Considering their geographical distance from each other, it was impossible to imagine a bloc made up of these countries. However, Jim O’Neill grouped Brazil, Russia, India and China together and coined the acronym BRIC. He asserted that the size of BRIC economies would grow over the next ten years to the point where they will be able to dominate the global economy. As developing economies, they have made similar progress toward becoming developed nations in recent years. BRICS countries are known for their considerable influence on regional and worldwide events and revamped their political strategies to reap the benefits of global commercialism (Farah, 2006; Degaut, 2015). Dominic Wilson and Roopa Purushothaman (2003) projected in a Goldman Sachs follow-up study that the BRIC economies might be larger than the G6 in less than 40 years, and by 2025, they could account for more than half of the G6. The BRIC economies, or the “Big Four,” started to meet as a group in 2006, and it was on December 24, 2010 that South Africa joined the grouping, which has since been cited as BRICS (Peng Lu, 2014). However, these countries differ in their sociopolitical and legal systems yet are bound by their collective history as developing countries and alternatives to western economic systems.
Since BRICS is one of the pillars of the emerging polycentric world order, their economies play an important role in international trade and economic development, especially in the third-world nations. Furthermore, the BRICS economies are changing the dynamics of intercontinental economic relations and are emerging as key financial donors. Over the last decade, BRICS economies underwent substantial social and economic changes and constituted about 3.1 billion, or about 41 percent of the world populace in 2015 (Tantri & Shaurav, 2018). Based on population size, the BRICS nations barring South Africa, have found themselves among the world’s top ten countries. Moreover, the BRICS economies accounted for about 23 percent and 32 percent of the global GDP based on nominal GDP and purchasing power parity (PPP), respectively (Tantri & Shaurav, 2018). Albeit BRICS global trade has shown an upward trend, the intra-BRICS trade has remained comparatively low. The reason is that these economies have higher transactional costs while trading with each other1. The higher transactional costs adversely affect BRICS economies’ potential to tap emerging avenues of business, economic growth, and development (Chychkalo-Kondratska et al., 2017). Regardless of its limitations, the BRICS bloc has proven itself among global governance institutions in a decade by shaping new institutions and demonstrating its capability to provide global public goods (Käkönen, 2019).
Further, intra-BRICS trade and investment flows are very low despite the opportunities and great potential. Nevertheless, Radulescu et al. (2014) outlined economic cooperation as a major strategy for increasing business between the BRICS nations. Hence, the best way to mitigate unfair competition, trade wars, and the deterioration of international economic relations is to strengthen BRICS cooperation (Yarygina & Zhiglyaeva, 2021). Active trade cooperation, among other things, aims to boost the BRICS economies’ international competitiveness by promoting balanced and inclusive economic growth (Yargina et al., 2020). According to a study by Singh et al. (2011), establishing a preferential trade agreement (PTA) among the BRICS states will aid the region’s development as a leading economic power. However, the relations between the BRICS sides are variable and sometimes have competing interests. Because of the group’s nature, the BRICS failed to harness their expanding economic might into effective diplomatic clout (Pant, 2013). Indeed, the BRICS’ ability to rebuild global economic governance is limited by the club’s dynamics (Hooijmaaijers, 2021). BRICS have significant differences in terms of demographic, economic, military, and political weight, as well as regional and global ambitions. The fact that China’s economy is larger than the combined economies of the other BRICS countries exemplifies these differences. Further, BRICS economic interests are largely guided and blemished by political factors. For example, India-China ties have steadily deteriorated over the past few years. These issues are largely responsible for the limited trade ties among these countries. Therefore, it is crucial to strengthen the collaboration among the BRICS nations in order to increase supply chain interconnectedness and foster trade and investment flows.
Over and above, the importance of BRICS in India’s external economic relations is central. Besides being a rising regional trading arrangement, it also functions as a principal export destination for Indian goods and thus helps to consolidate the India–BRICS trade relations. The share of India–BRICS trade in India’s total trade has grown from 8 per cent in 2002 to over 14 per cent in 2018. This shows that India is committed to building more robust intra-BRICS trade relations. However, India’s trade is in deficit with the rest of the BRICS members. Since 2006, India’s trade balance has deteriorated significantly, not only with the rest of the world but also with the BRICS countries. The trade deficit has risen from $ 8.73 billion in 2006 to $ 65.46 billion in 2018. In recent years, the shortfall has grown even larger. With the exception of Brazil, India has a negative trade balance with the rest of the BRICS. In fact, India is the only BRICS country with a negative global trade balance. India’s large trade imbalance with the BRICS nations indicates that the Indian economy is less competitive than the economies of the BRICS.2 Furthermore, there has been a constant decline in India’s export/import ratio from 0.475 in 2010 to 0.234 in 2017 (Kansra et al., 2021). India’s trade with BRICS countries is not as significant as it should be to justify the importance of BRICS for India as the growth rate of India’s exports and imports to and from BRICS countries has been almost the same post BRICS formation. Unlike China-BRICS trade, India–BRICS trade expansion has not resulted in significant structural changes, and commodity exports remain weak. India’s export inter-dependence vis-à-vis intra-BRICS exports has subsequently decreased. India’s unrealized trade potential in the BRICS countries thus appears to be pretty evident.
Within the BRICS, China’s dominance in terms of trade is another challenge for India, as it creates a barrier to any potential prospects. China’s dominance can be quantified by the fact that it is the largest single trading partner of Russia, Brazil, and South Africa and, as of 2021, was India’s second-largest trading partner3. Nevertheless, there is plenty of room for improvement in India’s trade with the BRICS countries. In order to reduce its growing trade deficit, India would benefit from focusing on its export potential to the BRICS countries. As an added benefit, a strategy of this kind would enhance India’s trade relationship with the BRICS. This will be a difficult task unless India produces and exports goods that are consistent with the aspirations of its BRICS counterparts. Hence, in this perspective, the present paper examines the India-BRICS trade flows. This paper is, of course, not the first paper to analyse the bilateral trade flows between India and the BRICS. See, for example, Chatterji and Sing (2014), Rasoulinezhad and Jabalameli (2018), Paswan (2018), Maryam and Mittal (2019), Khan and Khan (2020), and Lohani (2020) for empirical evidence. However, in those papers, the extent to which India’s exports are in line with the needs of its BRICS partners was not examined. Consequently, this study, by constructing a novel export aspiration index, attempts to quantify the extent to which India’s exports correspond to the needs of its BRICS counterparts4. Further, the gravity model of trade has been employed to analyse the fundamentals of India-BRICS trade.
2. Review of Literature
An emerging strand of literature has utilized the gravity framework and revealed the comparative advantage (RCA) index for analyzing the trade flow dimensions in Caribbean Community and Common Market (CARICOM) countries, UN-defined regional groups, the South Asian Association for Regional Cooperation (SAARC) region, and the BRICS countries (Maryam & Mittal, 2019; Paswan, 2018; Rasoulinezhad & Jabalameli, 2018; Antonio & Troy, 2014). However, for brevity, the literature review has been divided into two subsections. Section 2.1 reviews studies relating to the revealed comparative advantage (RCA) index, and the subsequent section (section 2.2) reviews studies relating to the gravity model of trade.
2.1 Revealed Comparative Advantage
Balassa (1977), using the RCA index, confirmed the presence of export diversification5 and highlighted that with technical improvements, export diversification becomes more robust. Yue (2001), using the RCA indices, confirmed that the export patterns in China have changed in line with its dynamic comparative advantages. Similarly, Ahmad et al. (2018), examining merchandise exports, found that both China and India’s performance have been consistent and robust in these exports since 2000. However, in the bilateral market, the bargaining power of China is more substantial than India. Wang et al. (2018), based on the RCA analysis, confirmed no competition among South Africa, Brazil, and Russia in exporting clothing and service textiles. In contrast, there is intense competition between China and India in clothing and service textiles. In the case of mechanical transport equipment, only China enjoys a comparative advantage among the BRICS nations. However, all BRICS countries have a comparative advantage in the exports of steel products. Lastly, the study also found a complementary relationship in the export of certain products. In the same vein, Raghuramapatruni (2015) found that trade in goods among the BRICS members is complementary rather than competitive. Seyoum (2007) concluded that, akin to the BRICS, certain emerging countries have strong competitive advantages in transportation and tourism services. On the other hand, financial and business services have ample space for improvement. Havlik and Stöllinger (2009) analyzed the opportunities and competitive challenges the BRICS countries present to the EU. There is evidence to suggest that the BRICS countries demonstrate comparative advantage mainly in labor-intensive industries. Beyene (2014a) showed that world trade is skewed towards high-income economies, hindering sub-Saharan Africa and South Asia’s economic integration with the rest of the world. Surprisingly, manufactured goods (exports) are a common subsector for both regions even though they have weaker competitiveness in these exports. Kocourek (2015) found that primary manufacturing has shifted steadily from low-value-added simple products to sophisticated goods over the past two decades. Beyene (2015b) investigated the comparative advantages of the BRICS and Sub-Saharan Africa (SSA) economic blocks in terms of merchandise exports. The evidence demonstrated the BRICS’ structural transformation toward higher-value-added commodities, whereas Sub-Saharan Africa is found to have comparative advantages in all merchandise exports, with the exception of manufactured exports.
Based on the theoretical and empirical literature, two major elements influence a country’s export performance, viz. terms of trade (competitiveness effect) and foreign income (global demand)6. The second effect is a complement to the first and completes it. Export volumes will be low if a country has a high competitiveness effect but low overseas demand for its products. As a result, a country, despite being competitive in the manufacturing of particular goods, fails to create favorable demand for them by designing products that do not meet the requirements and aspirations of customers. Therefore, global demand for a country’s exports is heavily influenced by the exporting country’s ability to produce and export goods that conform to foreign demand.
2.2 Gravity Model and Trade Flows
The trade integration and assimilation patterns differ considerably among members of a particular bloc and its non-members. In this context, Rasoulinezhad and Jabalameli (2018) concluded that Hecksher–Ohlin’s theory of factor endowments is the basis of Russia’s trade in raw materials and manufactured goods with 2014-UN-defined regional groups. In contrast, the Linder hypothesis of international trade is appropriate for the rest of the sample countries. These findings suggest that Russia has dissimilar trade assimilation and integration patterns compared to other BRIC members with 2014-UN-defined regional groups. As a consequence, both revealed comparative advantage postulation and Linder’s hypothesis guide the trade flows among the BRICS trading partners. At the country level, Wani and Dhami (2016) concluded that trade between India and the BRICS is positively and significantly influenced by GDP, GDP per capita, and the degree of market openness. In the same vein, Maryam and Mittal (2019) found that the participating countries size and population positively and significantly affect the India – BRICS exchange of goods. Nevertheless, the distance between India and its BRICS trading partners negatively affects bilateral trade between the two countries. According to Lohani (2020), the gravity model’s traditional arguments are valid in India’s context. Moreover, trade is positively influenced by a common official language and border ties. Likewise, Chakravarty and Chakrabarty (2014) analyzed the Indo–ASEAN trade and confirmed that the Indo–ASEAN trade is more responsive to distance than the country’s size. Dinc and Gonul (2014) used an augmented gravity model to compare Turkey’s import trade to that of the BRICS countries between 2002 and 2012. The findings showed that the basic gravity variables are in line with economic theory. Additionally, Turkish R&D expenditure negatively correlates with the BRICS imports, whereas the BRICS spending on R&D is positively associated with exports. Mishra et al. (2015) used a gravity model to examine India’s trade with the BRICS countries. The findings revealed that the gross national product and transportation costs significantly affect India–BRICS trade, but other factors like the exchange rate, inflation, and import–GDP ratio had no bearing on it. Khayat (2019), based on the gravity model, examined the trade pattern of the Gulf Cooperation Council countries (GCC). The empirical findings revealed that the GCC and destination countries’ GDP per capita and population were significant. Moreover, both countries’ trade policies attempt to eliminate the trade barriers as it acts as a stumbling block to improving trade openness, which boosts bilateral trade. Rahman et al. (2020), using the gravity model, confirmed that intra-BRICS trade relations have a positive impact on economic performance in these countries. Market size and economic freedom index have a positive impact on intra-BRICS trade flows. Lastly, tariffs and taxes within the BRICS are manageable. Nori and Mishra (2021) analysed the fundamentals of bilateral trade between the EU and the BRICS countries by applying the gravity model. The study found that economic size, market size, distance, and Brexit policy have a significant impact on the EU–BRICS trade flows.
Different regional trading arrangements evolved to prove that their formation enhances trade flows and economic growth. Economic integration, according to Surugiu and Surugiu (2015), creates a plethora of growth opportunities for businesses, resulting in the diversification and specialization of goods and services. Establishing a trade bloc is only a part of the story. The other part is how to maximize the benefits from the trade bloc. In this respect, the exports of each member country of a particular trade bloc should correspond to the needs and aspirations of the partner countries. India, however, has been unable to fully leverage the benefits from the BRICS over the last few years (Kansra et al., 2021), as it has been unsuccessful in exporting goods to the BRICS countries in accordance with their aspirations. This reality is evidenced by the falling export–import ratio between India and its BRICS partners. With the exception of South Africa, India’s export–import ratio to other BRICS countries is steadily falling. The export–import ratio, for instance, fell between India and China from 0.58 in 2002 to 0.17 in 2017, from around 1.00 to 0.56 between India and Brazil, and from 1.28 to 0.27 between India and Russia during the same period. As a result, the share of India’s exports to other BRICS nations in the total exports of India declined from 9.3 percent in 2008 to 8.1 percent in 2018 (Export–Import Bank of India, 2020). The declining export–import ratio and export share reveal India’s competitive disadvantage over the rest of the BRICS. Further, exports from countries like China are generally characterized by goods that are intended to meet the needs of the people based on hierarchy.7 This is, in some sense, consistent with the theory of comparative advantage following (CAF) strategy8. Through this strategy, China is able to export according to the needs and aspirations of its trading partners. This is one of the reasons why China is currently the world’s largest exporter of goods. Therefore, exporting in accordance with the aspirations of trading partners, as well as learning by exporting, are critical components in upgrading an economy’s endowments. Given this context, it will be beneficial to evaluate the relative strength of India’s exports in the BRICS and to gauge the degree of trade integration among the BRICS nations. Among the novel features of the present study is the construction of two indices that quantify various dimensions of the India–BRICS trade. Additionally, no study has sought to analyze the impact of multilateral trade resistance and trade freedom on the India–BRICS trade, to the best of our knowledge. Thus, it is essential that we delve deeper into these areas; hence, an attempt has been made in this direction.
3. Methods
3.1 Sources of Data
Secondary sources of data were consulted in order to obtain the necessary information for the present study. We have aimed to analyze India’s trade in goods with the BRICS from 1996 to 2018. Data on trade flow has been sourced from the International Trade Centre (ITC Trade Map) and the UN Common Format for Transient Data Exchange (UN COMTRADE). Data for the RCA calculation was extracted from World Trade Integrated Solutions (WITS). Data on the GDP, GDP per capita, and population were taken from the World Bank Development Indicators. Data related to distance was obtained from the Centre for Prospective Studies and International Information (CEPII, France). The data for the composite measure of trade freedom was obtained from the World Heritage Foundation (in collaboration with the Wall Street Journal). Following Head (2003), we estimated the remoteness variable or multilateral trade resistance as the GDP weighted average of the trading partners’ distance.
3.2 Index of Trade Integration Pattern
The composition of a country’s trade and its volume is time variant. Various factors drive this change, and the theory of comparative advantage explains a great deal about global trade patterns9. We, therefore, constructed an index of trade integration patterns using the information on the comparative advantage of various products10. By constructing an index of trade integration patterns, our objective was to quantify India’s trade integration pattern (similarity/dissimilarity) with other BRICS members. More precisely, it is based on the notion that the greater the number of commodities where trading partners have a comparative advantage in common, the more similar their trading patterns are. This index is expected to lie between 0 and 1. The closer the value is to 0, the more dissimilar the trading pattern is, and the more inter-industry trade occurs. Conversely, the closer the value is to 1, the more similar the trading pattern is, and intra-industry trade prevails. Our index is specified as follows:
 (1)
(1)
where C is the number of commodities in which two trading partners enjoy a comparative advantage in common, N1 is the total number of commodities in which one trading partner enjoys a comparative advantage and N2 is the total number of commodities in which the second trading country enjoys comparative advantage. It is to be noted that we have used the following equation to calculate the revealed comparative advantage index (Balassa, 1965a)11:
 (2)
(2)
where Xkab = exports of product k from country a to country b; Xab = total exports of country a to country b; Xkwb = exports of product k from world w to country b; Xwb = total exports to country b.
3.3 Export Aspiration Index
In a globalized world, economies have become more dependent on one another. Promoting exports through active participation in international trade leads to productivity improvements and an increase in competition (Wagner, 2007). Further, the increase in high-tech exports also brings significant gains to an exporting country. It is also imperative that, along with increasing the percentage of high-tech exports, countries produce and export products that are relevant to the aspirational category. This means that exports of such goods should cover the needs of the people according to their hierarchy and should be able to differentiate between the groups of people. China, for example, manufactures products of varying quality to appeal to a wide range of buyers. Generally, products of low quality are manufactured to meet the expectations of a specific category of consumers and to gain market access. This does not necessarily indicate that the country lacks the necessary expertise. In fact, strategic products from China are of high quality and, therefore, more or less developed countries are affected in extremely different ways by the Chinese rise (Woo, 2012). With this in mind, our objective in developing the export aspiration index was to quantify how closely Indian exports are aligned with the needs of the people in other BRICS nations. Our export aspiration index is specified as follows:
K =  (3)
(3)
where Xij is the proportion of exports of country i to country j, expi is the export unit value index of country i, Yj is the GDP per capita of country j, Mj are the imports of country j from rest of the world; Ýj is the domestic absorption of country j12 , and Impj is an import unit value index of country j13. To take into account productivity changes in the domestic export sector, we multiplied the final index value by the per capita GDP of the exporting country (Yi). The n index of export aspiration is a quantitative measure that reflects how the exports of a country change over time in response to changes in the purchasing power or needs of the people in the importing country. Our measure supplements the export sophistication index and captures productivity changes in the domestic export sector. While exporting goods, countries are said to reveal their productivity levels. Similarly, importing countries reveal their needs or aspirations akin to the concept of revealed comparative advantage. This is the basic intuition behind our index. For instance, in the absence of trade interventions, products exported by countries according to the needs of the international markets will allow high-wage-earning producers to compete in such markets. Among other factors, exporting high-tech content goods according to the needs of the global markets, therefore, plays a vital role in determining a country’s export basket. Nevertheless, the benefits from trade are not unlimited and unqualified (Hausman et al., 2005). To benefit from trade, a country must boost exports based on the customer orientation and ongoing consumption spectrum. Moreover, the proportion of exports that corresponds to the aspirations of the population of the importing country will increase as their purchasing power increases. Henceforth, the trade aspiration index value will obtain larger values in data sets of high aspiration and smaller values in data sets with low aspiration. Thus, a country is considered to have a high aspirational extent if it has a greater value of the export aspiration indicator and vice-versa.
3.4 Gravity Model
The gravity model of trade, akin to the Newtonian law of gravitation, postulates that the trade between two countries is directly proportional to the product of their GDPs and inversely proportional to the distance between them (Batra, 2004; Rahman, 2006). The gravity model was first employed by a Dutch economist Tinbergen (1962), in the empirical analysis. Albeit the gravity model was acknowledged for its success in predicting the determinants of trade between the countries, some researchers criticized it for lacking a solid theoretical foundation (Antonia & Troy, 2014; Anderson & Van Wincoop, 2003). However, the seminal work of Anderson presented a theoretical foundation for the gravity models. Subsequent elaborations to Anderson’s work proved that the gravity models could stem from various trade theories. In this context, Bergstand (1989) associated gravity model equations with monopolistic competition to analyze the determinants of bilateral trade. Similarly, Deardorff (1998) derived a gravity-type equation from an H–O framework; Eaton and Kortum (2002) provided evidence that it could arise from a Ricardian framework. Likewise, Helpman et al. (2008) and Chanay (2008) derived the gravity model equation from a theoretical model of trade in differentiated goods with firm heterogeneity (Rahman, 2006; Antonia & Troy, 2014).
The baseline gravity equation is often specified in a logarithm form as follows:
 (4)
(4)
Baseline gravity equation (4) treats trade as a positive function of the trading partners’ economic sizes and a negative function of physical distances between them. The classical gravity framework uses cross-sectional data to analyze the trade effects for a particular time (Maryam & Mittal, 2019). However, the panel data or longitudinal methodology has many benefits over pure cross-sectional or time-series data. The panel model gives more informative data, boosts degrees of freedom, and reduces multicollinearity among explanatory variables (Gujarati, 2015). The panel data methodology is more appropriate for disentangling and demonstrating country-specific and time-invariant effects (Egger, 2000). Further, the longitudinal data estimation methods allow minimization of bias and predisposition by taking heterogeneity across entities explicitly into account and allowing choice or space to include subject-specific variables (Gujarati, 2015). Keeping these advantages of panel estimation in view, we have employed panel data techniques to estimate our gravity model14.
Further, three basic frameworks are used to generalize the model given in equation (4). These basic frameworks are as follows:
(a) Pooled OLS Regression Model. In the pooled OLS regression model, we can pool all observations and can estimate a grand trade function, ignoring the twofold nature of cross-sectional and time-series data. Such a pooling of observations assumes that the coefficients across cross-section and time remain constant. The pooled OLS regression is also called a constant-coefficient model due to constant across time and cross-section coefficients. The pooled OLS regression model is modelled as follows:
 (5)
(5)
where i represents the cross-sectional unit/entity, and t is the time.
(b) Fixed Effects Model (FEM). One way we can take into account differences or heterogeneity that may exist among entities is to allow each entity to have its intercept, as in the following equation:
 (6)
(6)
In equation (6) we have added subscript i to the constant term to convey that our sample countries’ intercepts may differ. FEM is made operational by introducing differential intercept dummies.
(c) Random Effects Model (REM). In contrast to FEM, in a random-effects model, it is implicit that the individual or country-specific coefficient β1i is a random variable with a mean value of β1, and the intercept of any cross-sectional unit is denoted as
β1i = β1+ εi
where εi is a random error term with mean 0 and variance σ2ε. Consequently, the REM may be expressed as
 (7)
(7)
We can also rewrite equation (7) as follows:
 (8)
(8)
In comparison to FEM, in REM, there are fewer parameters or restrictions to estimate.
Since, in the present study, “the number of time observations is greater than the number of cross-sectional units, there is likely to be little difference in the values of the parameters estimated by FEM and REM” (Gujarati, 2015; Judge et al., 1985). The choice then depends on computational ease and convenience, which in our case, favors FEM. Since the observation units in our panel data set are members of the BRICS bloc, these countries certainly cannot be considered to represent a random sample of the 200-odd sovereign nations in the world. We should, therefore, employ FEM rather than REM even though this can entail a loss of efficiency (Dougherly, 2011). Moreover, in theory, in the case of balanced panel data sets, FEM is preferred, whereas, in the case of unbalanced panel data sets, REM is more appropriate. Thus, we used the panel OLS and fixed effects models to analyze the India–BRICS trade flows15. The choice between the pooled OLS model and the FEM model is made based on the F-test. Under the null hypothesis, the efficient estimator is pooled least squares; the F-ratio used for this test is
 (9)
(9)
where U refers to the unrestricted model, and P indicates the pooled or restricted model.
The statistically significant value of the F-test implies that FEM is superior to the pooled regression model.
Gravity Model Equation
The extended gravity model has been estimated in a logarithm form as follows
 (10)
(10)
where:
i = 1 (India)
j = 2, 3, 4, 5, (other BRIC members)
t = 1996, 1997… 2018
L = log
Tijt : India's trade with country j in year t
GDPijt: Product of GDP of country i and j in year t
DPCYijt : Absolute difference in GDP per capita of the BRICS countries. This has been introduced to identify a possible Linder effect/O–H effect.
TRFijt : Product of trade freedoms of country i and j in year t
POPijt : Product of populations of country i and j in year t
DISij : Distance in kilometers between country i and country j (used as a proxy for transportation costs)
LREMit : India's outward multilateral trade resistance (MTRs)
LREMjt : BRICS countries inward MTRs.
εijt : Error term.
4. Empirical Results
4.1 Revealed Comparative Advantage (RCA)
Table 1 presents the mean RCA of India and other BRICS members from 1996 to 2018 for 23 product categories. The mean RCA for animals is greater than units for Brazil, Russia, India and less than one for China and South Africa. This implies that Brazil, Russia, and India (countries with high RCA values) can expand trade in animals with low RCA countries of the BRICS, such as China and South Africa. The results also indicate low competition between Russia and India in animal trade but fierce competition between Brazil and India. Though India’s agricultural raw materials competitiveness is slightly higher than that of Brazil and South Africa, it is very low (3.08) compared to that of Russia (17.07). Well-known for vegetable exports, India faces competition only from Brazil (7.64). With an index value of (1.60), China stands as the sole competitor to India in plastic and rubber exports. India does not have a relative advantage in the export of wood, as it has not been a steady exporter largely due to high national demands, whereas Brazil, Russia, and South Africa exhibit competitiveness with the RCA value of (1.64), (4.26), and (1.46) respectively.
Table 1
Mean RCA for India and Other BRICS Members in Selected Products (Mean RCA, 1996-2018)
|
Mean RCA for India and other BRICS Members in Selected Products (Mean RCA, 1996-2018) |
|||||
|
Commodity/Sectors |
Brazil |
Russia |
India |
China |
South Africa |
|
Animals |
4.45 |
1.10 |
3.08 |
0.74 |
0.23 |
|
Agricultural Raw Materials |
1.58 |
17.07 |
3.77 |
0.47 |
1.73 |
|
Vegetable |
7.64 |
0.20 |
5.13 |
0.63 |
0.51 |
|
Plastic or Rubber |
0.21 |
0.49 |
1.78 |
1.60 |
0.17 |
|
Wood |
1.64 |
4.26 |
0.31 |
0.39 |
1.46 |
|
Transportation |
0.56 |
3.52 |
1.07 |
0.35 |
0.39 |
|
Raw Materials |
3.98 |
2.48 |
4.13 |
1.49 |
3.79 |
|
Minerals |
8.95 |
0.71 |
16.98 |
0.49 |
12.54 |
|
Metals |
0.63 |
1.64 |
3.25 |
0.98 |
2.84 |
|
Manufactures |
0.25 |
0.52 |
1.64 |
1.19 |
0.48 |
|
Machinery and Electronics |
0.12 |
0.26 |
0.43 |
0.90 |
0.12 |
|
Machinery & Transport Equipment |
0.20 |
0.25 |
0.57 |
0.78 |
0.17 |
|
Hides and Skins |
1.57 |
0.05 |
2.72 |
5.13 |
0.38 |
|
Stone and Glass |
0.20 |
0.18 |
0.93 |
0.57 |
0.60 |
|
Footwear |
0.46 |
0.01 |
5.36 |
10.28 |
0.05 |
|
Commodity/Sectors |
Brazil |
Russia |
India |
China |
South Africa |
|
Food Products |
7.50 |
0.09 |
3.26 |
0.78 |
1.22 |
|
Chemicals |
0.26 |
1.39 |
4.15 |
1.16 |
1.20 |
|
Textile and Clothing |
0.16 |
0.03 |
9.11 |
3.87 |
0.56 |
|
Ores and Metals |
3.70 |
0.86 |
8.56 |
5.33 |
7.16 |
|
Intermediate Goods |
1.16 |
1.23 |
3.26 |
1.10 |
1.48 |
|
Consumer Goods |
0.39 |
0.55 |
4.14 |
2.22 |
0.22 |
|
Capital Goods |
0.18 |
0.30 |
0.51 |
0.71 |
0.16 |
|
Miscellaneous |
0.05 |
0.77 |
0.53 |
0.95 |
0.08 |
Note. The bold figures indicate the country’s comparative advantage in the underlying product.
The higher the RCA value of wood for Russia shows that it is relatively more competitive in this field than Brazil and South Africa. With an index value of (3.52), Russia stands as a sole competitor to India in transportation. In raw materials and intermediate goods, the RCA values of all BRICS countries are greater than one, indicating a competitive relationship among the BRICS countries. The RCA values of Brazil, India, and South Africa in the case of minerals are far larger than one. In the export of metals, Russia and South Africa are the two major competitors to India. India could become the largest exporter of manufacturers as its RCA value is above one, and only China stands as a competitor to India in manufacturer exports. All BRICS countries have a comparative disadvantage in exports of machinery and electronics, machinery and transport equipment, stone and glass, capital goods, and miscellaneous products. Therefore, there seems no scope in expanding trade among BRICS nations in these product lines.
India has a lower RCA value in hides and skin compared to China. Brazil has also emerged as a competitor in hides and skin export. In the case of footwear, textile and clothing, and consumer goods, China remains a major competitor to India. Brazil and South Africa stand as two major contenders to India exporting food products. Furthermore, India’s export of chemicals has a higher RCA value than its competitors, Russia, China, and South Africa.
4.2 Trade Integration Pattern Index
Table 2 indicates a dissimilar trade integration pattern among BRICS countries (Saji, 2019), as the trade integration index values are far less than one. The results also imply that trade flows among the BRICS nations involve inter-industry trade. Therefore, the BRICS economies tend to export those goods to the BRICS market that uses relatively large amounts of the abundant factors and import goods that use large quantities of scarce factors. Thus, the differences in factor endowments are the basis of trade among the BRICS nations (Maryam & Mittal, 2019; Pingyao & Jing-Yun, 2012). Moreover, country-wise, results show that India’s trade integration pattern is more dissimilar to Russia and South Africa than Brazil and China. As a result, India’s trade with Russia and South Africa also involves a significant exchange of differentiated goods which are similar but not identical. Lastly, Russia’s and South Africa’s trade is more dissimilar to the BRICS as a market. Most successful economies have experienced astounding economic growth as a result of an export-driven strategy. These economies have used the comparative advantages of their abundant low-skilled labor force to drive economic growth. In addition, they were able to capitalize on their comparative advantages and increase their exports following the dynamic comparative advantage strategy. However, one major stumbling block in BRICS economies development (with the exception of China) is their inability to capitalize on their comparative advantage in low-skilled, labor-intensive manufacturing. Akin to China, the rest of the BRICS members should also capitalize on their competitive strengths. Therefore, to diversify trade patterns, the BRICS members should start the process of dynamic comparative advantage by creating a pool of skilled labor, technology, and capital (Chen, 2012).
Table 2
Trade Integration Pattern Index
|
Country |
1 |
2 |
3 |
4 |
5 |
6 |
|
Brazil |
- |
0.36 |
0.51 |
0.29 |
0.42 |
0.30 |
|
Russia |
0.36 |
- |
0.33 |
0.25 |
0.29 |
0.24 |
|
India |
0.51 |
0.33 |
- |
0.43 |
0.24 |
0.39 |
|
China |
0.29 |
0.25 |
0.43 |
- |
0.30 |
0.30 |
|
South Africa |
0.42 |
0.29 |
0.24 |
0.30 |
- |
0.28 |
|
BRICS |
0.30 |
0.24 |
0.39 |
0.30 |
0.28 |
- |
4.3 India’s Export Aspiration with the BRICS
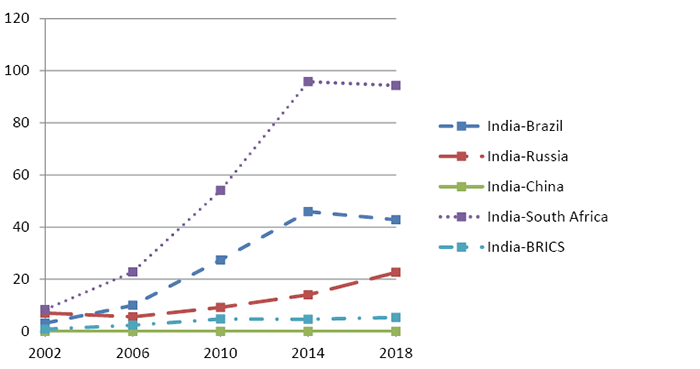
Figure 1 shows the relative export aspiration of India’s exports in the BRICS countries. The export aspiration in individual BRICS countries shows a diverse pattern, but India’s export aspiration in these countries has improved over time, though marginally in the case of China. It is to be noted that an increase in India’s export aspiration over time is equivalent to a gain in the relative strength of India’s exports. Except for China16, the export aspiration of India in Brazil, Russia and South Africa has improved mainly since the BRICS inception. Still, the growth rate of the measure has been relatively slow in the BRICS market as a whole. Country-wise, Figure 1 shows that India’s export aspiration to Brazil increased from 2002 to 2014, however, it decreased to 42.83 in 2018. Theoretically, an increase in the percentage of India’s exports to Brazil from 0.72 per cent in 2002 to 2.25 per cent in 2014 and a decline to 1.11 per cent in 2018 could be responsible for this behavior of India’s export aspiration to Brazil. In a similar vein, the upward trend in India’s export aspiration to South Africa from 2002 to 2014 can be explained by the rise in the proportion of India’s exports to South Africa to its overall exports from 0.94 percent in 2006 to 1.80 percent in 2014. The proportion of India’s exports to Russia, however, has decreased from 1.47 percent in 2002 to 0.70 percent in 2014, and for China, this percentage decreased from 6.46 percent in 2006 to 5.08 percent in 2014.17 Further, the increase in Indian exports to China has not been evenly spread across all commodity groups. In fact, natural resource-based raw materials or semi-manufactured products dominate Indian exports to China, which is not considered to be healthy from the Indian point of view (Singla, 2015). Consequently, India continued to have low export aspirations with China and Russia during the time period. Overall results indicate that India’s exports correspond more to the needs of Brazil, South Africa, and Russia and less to the needs of the people of China.18
Figure 1
India’s Export Aspiration with the BRICS
4.4 Gravity Model Estimates
The augmented gravity model results for India-BRICS reciprocal trade are reported in Table 3. Since the F-test statistic is statistically significant at a 1% significance level, therefore, the F-test statistic robustly rejects the pooled model in favor of the fixed-effects model19. The empirical results of the fixed-effects model divulge that log of the product of GDP’s of India and its BRICS trade partners (LGDPij) has a positive and statistically significant impact on India–BRICS trade. Thus, the combined economic size of India and its BRICS partners positively and significantly influences trade between them (Lohani, 2020; Rahman et al., 2020; Khayat, 2019; Maryam & Mittal, 2019; Wani & Dhami, 2016; Ekanayake et al., 2010; Batra, 2004). The positive, low, and insignificant coefficients of difference in income levels signify two things. Firstly, the positive coefficient for the difference in income levels demonstrates that India–BRICS trade is dominated by the H–O theory rather than the Linder hypothesis.
Table 3
Results of Static Panel Models
|
Dependent Variable: |
||||||||
|
Pooled OLS Model |
Fixed Effects Model |
|||||||
|
Variables |
Coeffi. |
Std. |
t |
p-value |
Coeffi. |
Std. |
t |
p-value |
|
LGDPij |
0.98 |
0.34 |
2.88 |
0.005*** |
0.81 |
0.20 |
3.94 |
0.000*** |
|
LDPCYij |
1.08 |
0.37 |
2.86 |
0.005*** |
0.22 |
0.21 |
1.03 |
0.306 |
|
LTRFij |
0.14 |
0.13 |
1.11 |
0.271 |
0.73 |
0.10 |
6.82 |
0.000*** |
|
LPOPij |
1.27 |
0.66 |
1.90 |
0.058* |
1.27 |
0.66 |
1.90 |
0.058* |
|
LDISij |
-4.49 |
1.04 |
-4.29 |
0.000*** |
-1.09 |
0.25 |
-4.35 |
0.000*** |
|
LREMi |
2.77 |
0.42 |
6.52 |
0.000*** |
0.82 |
0.34 |
2.39 |
0.019** |
|
LREMj |
1.61 |
0.89 |
1.81 |
0.074* |
1.66 |
0.49 |
3.36 |
0.001*** |
|
Constant |
-151.0 |
24.0 |
-6.27 |
0.0008 |
-117.0 |
34.79 |
-3.36 |
0.001*** |
|
F statistic = 115.02, |
F statistic = 319.57, |
|||||||
|
R2 = 0.9055 |
R2 = 0.9723 |
|||||||
|
F/Wald test statistic = 86.19 |
Prob. F/Wald test statistic = 0.0000*** |
|||||||
Note. *, ** and *** indicate significance at 10%, 5% and 1% levels of significance respectively.
Secondly, the low coefficient of differences in income levels signifies a reduction in inter-industry trade in favor of vertical intra-industry trade. The vertical intra-industry trade is perhaps encouraged by the emerging wave of multinational corporations that developed a labor-oriented production segment in the BRICS economies due to cheap labor costs vis-à-vis the advanced countries.
The positive and significant coefficient on the composite measure of trade freedom(s) validates the hypothesis that the more open the economies are, the more is the flow of trade between them (Ali, 2016). Further, the ratification of bilateral and multilateral trade agreements between India and its BRICS counterparts has substantially benefited India–BRICS bilateral trade. The estimated coefficient on the population variable used as a proxy for the market size is positive and significant in explaining India–BRICS trade (Khayat 2019). The distance variable is also significant, with an expected negative sign, which conveys that India tends to trade more with its immediate neighboring countries among BRICS nations (Lohani, 2020; Wani & Dhami, 2016; Antinio & Troy, 2014). Interestingly, India–BRICS trade responds less than proportionally to economic size but more than proportionally to market size and distance (Bhattacharyya & Banerjee, 2006). Generally, higher multilateral trade resistance (MTR) promotes bilateral trade flows among member countries of a particular trade bloc. The results in Table 3 also confirm that India’s outward MTR (LERMi) and the BRICS countries’ inward MTR (LERMj) have a positive and statistically significant impact on India–BRICS bilateral trade. Higher inward MTR for the importer (India’s BRICS partners) induces more trade from India since higher trade barriers between BRICS and the rest of the world reduce India’s relative price of goods. Conversely, higher outward MTR for the exporter (India) leads to less demand from it, which lowers its relative price, making it more attractive for its BRICS partners to import.
5. Limitations and Future Research
To study the fundamentals of India–BRICS trade, the current analysis was limited to a few critical macroeconomic variables that were fundamentally quantifiable. The India–BRICS trade is heavily influenced by various issues, including political, legal, technological etc. Further, the India–BRICS trade flows have been affected by many fresh exogenous shocks like the COVID-19 pandemic and Russian–Ukraine political tension. The inclusion of such exogenous shocks could provide more valuable information regarding the India–BRICS trade patterns. Alternative measurements of transport costs and multilateral trade resistance can also be employed for better insights. Future research should consider the factors which influence India’s export aspiration in the BRICS countries. Last but not least, future studies should also compare India’s export aspirations with the rest of the BRICS countries in order to draw more meaningful conclusions.
6. Conclusion
The present study aimed to quantify the trade integration pattern among the BRICS economies. The trade integration index indicated a similar trade integration pattern among the BRICS countries and substantiated the presence of inter-industry trade. Gravity model estimates showed that trade freedoms, market size, India’s outward multilateral trade resistances, and the BRICS inward multilateral trade resistance significantly impacts the India–BRICS trade flows. Besides, a novel export aspiration index was constructed to quantify the extent to which India’s exports correspond to the needs of its BRICS counterparts. Although the export aspiration in individual BRICS countries shows a diverse pattern, the relative strength of India’s exports within its BRICS counterparts has improved slowly. The exports aspiration index also indicated that India’s exports correspond less to the needs of China vis-à-vis other BRICS counterparts. Hence, the relative strength of Indian exports will increase substantially if India’s commodity composition is diversified by including more commodities in its export baskets that correspond to the BRICS economies needs and changing conditions. Since inward multilateral trade resistance confirmed that higher trade barriers between BRICS and the rest of the world reduce India’s relative price of goods and makes imports cheaper from it, therefore, India should develop comprehensive and systematic free trade agreements with the rest of the BRICS members in order to reap the maximum benefits from the BRICS integration. Literature as well as results of the present study suggest that low trade integration is a fundamental impediment to the development of India–BRICS trade relations. However, better growth and market returns would be delivered by India by reinforcing its domestic market as well as its export aspirations in these economies.
References
1. Adam, C., & Cobham, D. (2007). Modelling multilateral trade resistance in a gravity model with exchange rate regimes. In Centre for Macroeconomic Analysis Conference Paper 2007(pp. 1 –36).
2. Ahmad, I., Kunroo, M., & Sofi, I. (2018). An RCA Analysis of India – China Trade Integration: Present Potential and Prospects. Foreign Trade Review, 53(1), 1 –10.doi:10.1177/0015732516681885.
3. Ahn, J., & McQuoid, A. F. (2013). Capacity Constrained Exporters: Micro Evidence and Macro Implications. Department of Economics Working Papers 1301, Florida International University.
4. Anderson, J. E. (1979). A Theoretical Foundation for the Gravity Equation. The American Economic Review, 69(1), 106 –116.
5. Anderson, J. E., & Van Wincoop, E. (2003). Gravity with Gravitas: A Solution to the Border Puzzle. The American Economic Review, 93(1), 170 –192. doi:10.1257/000282803321455214.
6. Antonio, A., & Troy, L. (2014). A Gravity Model Approach to Analysing the Trade Performance of CARICOM Member States. Applied Econometrics and International Development, 14(2), 145 –160.
7. Ali, G. (2016), Does Trade Openness have Noteworthy Effect on Bilateral Trade Flows of E.C.O. countries: An Empirical Investigation, Timisoara Journal of Economics and Business 9(2). DOI: 10.1515/tjeb-2016-0007.
8. Balassa, B. (1965a). Trade Liberalisation and ‘Revealed’ Comparative Advantage. The Manchester School of Economics and Social Studies, 33(2), 99-123.
9. Balassa, B. (1977b). ‘Revealed’ Comparative Advantage Revisited: An Analysis of Relative Export Shares of the Industrial Countries, 1953-1971. The Manchester School of Economics and Social Studies, 45(4), 327–344.
10. Batra, A. (2004). India’s Global Trade Potential: The Gravity Model Approach. (Indian Council for Research on International Economic Relations, Working Paper No. 151).
11. Bergstrand, J. H. (1989). The Generalised Gravity Equation, Monopolistic Competition, and Empirical Evidence. Review of Economics and Statistics, 71, 143-153.
12. Beyene, G. H. (2014). Trade Integration and Revealed Comparative Advantages of Sub-Saharan Africa and South Asian Merchandise Export. Foreign Trade Review, 49(2), 163-176. DOI: 10.1177/0015732514525170.
13. Beyene, G. H. (2015). BRICS and Sub-Saharan Africa trade interdependence and peace: Evidence based on revealed comparative advantages. Journal of Law, Society and Development, 2(1), 4–28.
14. Bhattacharya, R. & Banerjee, T. (2006). Does the Gravity Model Explain India’s Direction of Trade? A Panel Data Approach. (Working paper No. 2006-09-01, Indian Institute of Management Ahmedabad, India).
15. Carbaugh, J. R. (2008). International Economics (7th ed.). Thomson South-Western, Canada.
16. Chakravarty, S. L, Chakrabarty, R. (2014). A Gravity Model Approach to Indo-ASEAN Trade Fuctuations and Swings. Procedia: Social and Behavioral Sciences, 133, 383–391.
17. Chaney, T. (2008). Distorted Gravity: The Intensive and Extensive Margins of International Trade. American Economic Review, 98(4), 1707 –1721.
18. Chatterjee, B., Jena, P., & Sing, S. (2014). Intra-BRICS Trade and its Implications for India. (Discussion Paper, CUTS International) www.cutsinternational.org
19. Chen, L. (2012). The BRICS in the Global Value Chains: An Empirical Note. Cuadernos de Economía, 31(57), 221 –239.
20. Chychkalo-Kondratska, I., Bezrukova, N., & Svichkar, V. (2017). New “Stars” of Global Economy: TICKS comes to replace BRICS. Journal of International Studies, 10(3), 24–34, doi :https://dx.doi:org/10.14254/2017-8330.217/10-3/2
21. Deardorff, A. V. (1998). Determinants of Bilateral Trade: Does Gravity Work in a Neoclassical Work. In J. A. Frank (Ed.), The Regionalisation of the World Economy (pp. 7-32). Chicago, IL: University of Chicago Press.
22. Degaut, M. (2015). Do the BRICS Still Matter? (A Report of the CSIS Americas Program).
23. Dinc er Gonul. (2014). Turkey’s Rising Imports from BRICS: A Gravity Model Approach. (MPRA Paper No. 61979. University Library of Munich, Germany).
24. Dougherty, C. (2011). Introduction to Econometrics (4th ed.). Oxford University Press.
25. Eaton, J., & S. Khortum (2002). Technology, Geography and Trade. Econometrica, 70(5), 1741–1779.
26. Egger, P. (2002). An Econometric View on the Estimation of Gravity Models and the Calculation of Trade Potentials. The World Economy, 25(2), 297–312.
27. Ekanayake, E., Mukherjee, A., & Veeramacheneni, B. (2010). Trade Blocs and Gravity Model: A Study of Economic Integration among Asian Developing Countries. Journal of Economic Integration, 25(4), 627–643.
28. Farah, P. D. (2006). Five Years of China’s WTO Membership: EU and US Perspectives on China’s Compliance with Transparency Commitments and Transitional Review Mechanism. Legal Issues of Economic Integration, 33(3), 263–304.
29. Gujarati, D. (2015). Econometrics by Example (2nd ed.). Palgrave UK.
30. Halpin, T. (2009, June 17). Brazil, Russia, India, and China formed a bloc to challenge US dominance. The Times.
31. Hausmann, R., Hwang, J., & Rodrik, D. (2005). What You Export Matters. (CID Working Paper Series 2005.123, Harvard University, Cambridge, MA, December 2005).
32. Havlik, P., & Stöllinger, R. (2009). EU and BRICs: Challenges and opportunities for European competitiveness and cooperation. (Industrial Policy and Economic Reform Papers No. 13).
33. Head, K. (2003). Gravity for Beginners. University of British Columbia.
34. Helpman, E., M. Metliz., & Y. Rubinstein. (2008). Estimating Trade Flows: Trading Partners and Trading Volumes. Quarterly Journal of Economics, 103(2), 441–467.
35. Hillman, A. L. (1980). Observations on the relations between “revealed comparative advantage” and comparative advantage as indicated by pre-trade relative prices. Weltwirtschaftliches Archiv, 116, 315–321. DOI: 10.1007/BF02696859.
36. Hooijmaaijers, B. (2021). China, the BRICS, and the limitations of reshaping global economic governance. The Pacific Review, 34(1), 29–55.
37. I-Hui Cheng., & H.J. Wall. (2005). Controlling for Heterogeneity in Gravity Models of Trade and Integration. Federal Reserve Bank of St. Louis Review, 87(Jan.), 49–63.
38. Judge, G. G., Hill, R. C., Griffiths, W. E., Lutkepohl, H., & Lee, L. C. (1985). Introduction to the Theory and Practice of Econometrics (2nd ed.). New York: John Wiley and Sons.
39. Kansra, P., Kumar, P., Mahapatra, S. K., & Oberoi, S. (2021). Economic concert, cooperation and trade specialisation of India in comparison with rest of BRICS nations. International Journal of Trade and Global Markets, 14(6), 580–602.
40. Khan S, & Khan AT. (2020). India’s Trade Relation with BRICS Countries and Issues of Sustainability. Management and Economics Research Journal, 6(S5), 9900028. https://doi.org/10.18639/MERJ.2020.9900028
41. Khayat, H. S. (2019). A gravity model analysis for trade between the GCC and developed countries. Cogent Economics & Finance, 7(1), 1–13. https://doi.org/10.1080/23322039.2019.1703440
42. Käkönen, J. (2019). Global change: BRICS and the pluralist world order. Third World Thematics: A TWQ Journal, 4(6), 415–423.
43. Kocourek, A. (2015). Structural Changes in Comparative Advantage of the BRICS. Procedia—Social and Behavioral Sciences, 172,10–17.
44. Lohani, K. K. (2020). Trade Flow of India with BRICS Countries: A Gravity Model Approach. Global Business Review, https://doi.org/10.1177/0972150920927684.
45. Máñez, J. A., Rochina, M. E., & Llopis, J. A. S. (2008). Sunk Cost Hysteresis in Spanish Manufacturing Exports. Review of World Economics, 144, 272–294.
46. Maryam, J., & Mittal, A. (2019). An empirical analysis of India’s trade in goods with BRICS. International Review of Economics, 66(4), 399–421. https://dx.doi:org/10.1007/s12232-019-00328-7
47. Mishra, A. K., Gadhia, J. N., & Sahoo, M. (2015). Trade Flows between India and Other BRICS Countries: An Empirical Analysis Using Gravity Model. Global Business Review, 16(1), 107–122.
48. Nori, U., & Mishra, R. K. (2021). An analysis of trade flows between BRICS and European Union: A quantitative assessment. Transnational Corporations Review, 13(4), 394-405. doi: 10.1080/19186444.2021.1875732
49. Pant, H. V. (2013). The BRICS Fallacy. The Washington Quarterly, 36(3), 91–105.
50. Pant, M. (2013). India and the BRIC’s Ccountries: Issues of Trade and Technology. In S. Mathur & M. Dasgupta (Eds.), BRICS: Trade Policies, Institutions and Areas of Deepening Cooperation (pp.163–191). Centre for WTO Studies.
51. Paudel, R. C. (2014). Liberalisation reform and export performance of India. (ASARC Working Paper 03).
52. Peng Lu (2014). A comparative analysis of political confidence in the BRICS countries, Japanese Journal of Political Science, 15(3), 417–441.
53. Pingyao, L., & Jingyun, W. (2012). Opportunities and Challenges fFced by the Cooperation of BRICS. Statistical Research, 29(2), 21–27.
54. Radulescu, I. G., Panait, M. & Voica, C. (2014). BRICS Countries Challenge to the World Economy New Trends. Procedia Economics and Finance, 8, 605–613.
55. Raghuramapatruni, R. (2015). Revealed Comparative Advantage and Competitiveness: A Study on BRICS. Arabian Journal of Business and Management Review, 5(152), 10–7, doi: https://dx.doi:org/10.4172/2223-5833.1000152
56. Rahman, M., Fatima, Z., & Rahman, N. (2020). Quantitative dynamics of intra-BRICS trade. BRICS Journal of Economics, 1(4), 6–23. https://doi.org/10.38050/2712-7508-2020-1-4-2
57. Rahman, M. M. (2006). A Panel Data Analysis of Bangladesh’s Trade: The Gravity Model Approach. [PhD Dissertation, University of Sydney, Sydney].
58. Rani, R., & Kumar, N. (2018). Panel Data Analysis of Financial Development, Trade Openness and Economic Growth: Evidence from BRICS Countries. Emerging Economy Studies, 4(1), 1–18, doi: https://dx.doi:org/10.1177/2394901518767023.
59. Rasoulinezhad, E., & Jabalameli, F. (2018). Do BRICS Countries Have Similar Trade Integration Patterns? Journal of Economic Integration, 33(1), 1011–1045. doi: https://dx.doi:org/10.11130/jei.2018.33.1.1011
60. Saji, G., T. (2019). Does Economic Integration Really Improve Trade Competitiveness? The Case of BRICS. Economic Affairs, 64(3), 469–480.
61. Sen, S. (2017). BRICS and the New Financial Architecture. Economic & Political Weekly, 52(11), 25–27.
62. Seyoum, B. (2007). Revealed comparative advantage and competitiveness in services: A study with special emphasis on developing countries. Journal of Economic Studies, 34(5), 376–388. https://doi.org/10.1108/01443580710823194
63. Singh, A., Dhania, R., Upasani, R., & Mathur, S. K. (2011). Analysing the Trade Flows for Brazil, Russia, India, China and South Africa (BRICS), Available at. https://www.scribd.com/doc/ 63710945/Analyzing-the-Trade-Flows-for-BRICS
64. Singla, K. S. (2015). An Analysis of India’s Export Performance with China. Foreign Trade Review, 50(3), 219–230.
65. Surugiu, M.R. & Surugiu, C. (2015). International Trade, Globalisation and Economic Interdependence between European Countries: Implications for Businesses and Marketing Framework. Procedia Economics and Finance, 32, 131–138.
66. Tantri, L. M., & Shaurav, K. (2018). Food security in BRICS – Current status and issues. (Working Paper No. 419, The Institute for Social and Economic Change, Bangalore).
67. Tinbergen, J. (1962). Shaping the World Economy: Suggestions for an International Economic Policy. New York: The Twentieth Century Fund.
68. United Nations. (2019). What is ‘South-South cooperation’ and why does it matter? https://www.un.org/development/desa/en/news/intergovernmental-coordination/south-south-cooperation-2019. html.
69. Vannoorenberghe, G. (2012). Firm-level volatility and exports. Journal of International Economics, 86, 57–67.
70. Wagner, J. (2007). Exports and Productivity: A Survey of the Evidence from Firm-level Data. World Economy, 30(1), 60–82.
71. Wang, P., Zhao, Y., & Chu, L. (2018). Analysis of Competition and Complementarity in the BRICS Export Products. In Proceedings of the 4th Annual International Conference on Management, Economics and Social Development (ICMESD 2018) (pp. 847–857). Atlantis Press.
72. Wani, N., & Dhami J. (2016). Trade Potential of India Against BRICS Economies: An Empirical Analysis Based on Gravity Model. (MPRA Paper No. 91785).
73. Wilson, D., & Roopa P. (2003). Dreaming with BRICs: The Path to 2050. (Goldman Sachs Global Economics Paper No. 99).
74. Woo, J. (2012). Technological Upgrading in China and India: What do we know? (OECD Development Centre Working Paper No. 308).
75. Yarygina, I. Z., & Zhiglyaeva, A. V. (2021). Trade and Economic Cooperation Within BRICS: Actual Problems and Prospects. In: O. G. Shakirova, , O. V Bashkov, & A. A. Khusainov (Eds.), Current Problems and Ways of Industry Development: Equipment and Technologies (pp. 919-929). Springer. https://doi.org/10.1007/978-3-030-69421-0_102
76. Yarygina, I. Z., & Zhiglyaeva, A.V., Vershinina, V. O., & Kuvshinova, A. Y. (2021). Trade and Economic Cooperation of BRICS: Problems and Prospects. Academic Journal of Interdisciplinary Studies, 9(6), 89–104.
77. Yue, C. (2001). Comparative Advantage, Exchange Rate and Exports in China. Paper for the international conference on Chinese economy, CERDI, France.
78. Export–Import Bank of India. (2020). BRICS: Promoting Trade, Investment and Business Cooperation. BRICS Business Council India Chapter. https://www.eximbankindia.in/Assets/Dynamic/PDF/Publication
Appendix
Figure A
Evolution of Trade Balance between India and its Trade Partners (World) (US $ Billion)
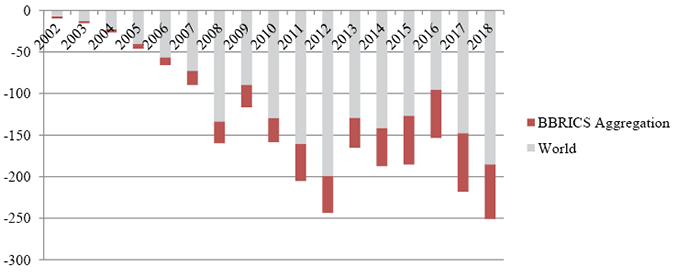
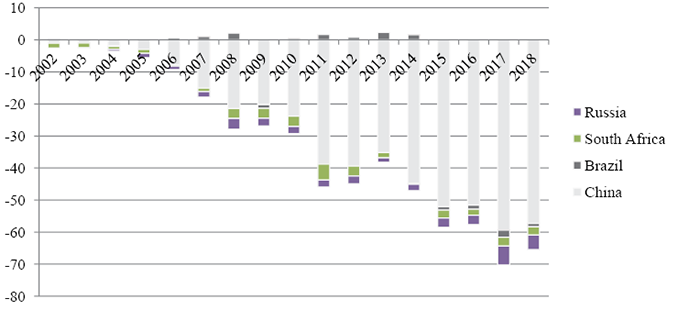
Figure B
India’s Trade Balance with Brazil, Russia, China, and South Africa over Time US $ Billion)
1 According to Chychkalo-Kondratska et al. (2017), the prime reasons for rising transactional costs in BRICS transactions are high bilateral tariff rates, lower use of technology in trading operations, marginal export aspiration, poor trade logistic infrastructure, and poor management practices.
2 See Figure (a) and Figure (b) in Appendix for further clarifications.
3 China’s share in total exports of Brazil, Russia, and South Africa was 31.3 per cent, 13.8 per cent and 11.79 percent, respectively in 2021. These figures suggest that Indian exports to the BRICS appear to have been displaced in recent years by competitive and dynamic Chinese exports to these nations.
4 The novelty of the present study is that two indices, viz., export aspiration index and trade integration pattern index were constructed to quantify the various dimensions of India–BRICS trade.
5 An export diversification strategy involves changing the composition of a country’s existing export product mix or expanding exports into new markets.
6 For further clarifications, see Paudel (2014); Ahn and McQuoid (2013); Vannoorenberghe (2012); Máñez et al. (2008); Ilmakunnas and Nurmi (2007).
7 To improve the relative strength of its exports, the exporting country must first comprehend the needs and desires of its customers, and then create and produce items to suit those desires (Lu & Beamish, 2001). That is, the exporting country must discern between the wants and aspirations of customers in the destination country belonging to various socioeconomic classes (Hortinha et al., 2011). The exporting country’s capacity to differentiate among needs of the people, as well as its customer-centric approach, could play a vital role in raising sales and strengthening the country’s reputation in foreign markets (Katzikeas et al., 2006). Thus, hierarchy here refers to organization of exports according to the needs and aspirations of consumers belonging to different sections of the society.
8 By following this strategy, the nation’s factor endowments are upgraded more quickly, thereby reducing the technological gap between the country and developed countries, especially by acquiring from the developed world industrial and technological innovations that complement the country’s new comparative advantage (Gnangnon, 2020). China is following CAF strategy more rigorously than India.
9 Hillman (1980) states that there is an exact relationship between comparative advantage as indicated by pre-trade relative prices and the observed trade pattern in a setting where two goods have been aggregated; this is given by the direction of trade, with an economy exporting that item of goods that would be relatively cheaper domestically in an autarky equilibrium.
10 Beyene (2014a) observes that the current reality of a country’s or region’s comparative advantage has an impact on the ease with which economic integration in that region can be facilitated.
11 For the calculation of the mean RCA, we have used data at the aggregate level as provided by WITS, instead of various SITC Revisions, due to concordance issue.
12 Domestic absorption or expenditures has been calculated as the difference between national income and net exports of the country.
13 Unit value indices, which are used to track price changes in imported and exported commodities, are useful for economic study in a variety of ways. They are employed as short-term indicators of inflation transmission, as well as deflators of export and import values to generate measurements of changes in export and import volumes. Therefore, to normalize our index for price changes in exported and imported goods, we also included the export unit value index and the import unit value index in our index formula.
14 Here each country/entity is observed in T = 23 years, i. e., from 1996 to 2018. The panel data employed is balanced for the observations (23) are the same for each country. Since the number of time observations is greater than the number of cross-sectional units, our data set is a long panel data set.
15 There is, of course, a problem with FEM. FEM cannot estimate coefficients of the variables that are time-invariant. However, it can be avoided by running a second-stage regression as Cheng and Wall (2005) suggested.
16 Indian exports to China primarily constitute raw materials which add to the production thereby increasing the aspiration indirectly with some gestation period.
17 India export partner share to Brazil, Russia, South Africa, and China can be accessed at https://wits.worldbank.org/
18 For some countries, data on export and import unit value indices was available only from 2002, so we analyzed India’s export aspiration to the rest of the BRICS from 2002.
19 Since the pooled regression model does not seem appropriate, the direction of our analytical efforts, thus, focuses on fixed effect estimators.