Organizations and Markets in Emerging Economies ISSN 2029-4581 eISSN 2345-0037
2023, vol. 14, no. 1(27), pp. 110–132 DOI: https://doi.org/10.15388/omee.2023.14.84
The Role of Entrepreneurial Orientation and Learning on the Performance of Junior Enterprises
Jeferson Carlin dos Santos (corresponding author)
São Paulo State University – Unesp, Brazil
https://orcid.org/0000-0002-4549-7191
carlin.jeferson@gmail.com
Hermes Moretti Ribeiro da Silva
São Paulo State University – Unesp, Brazil
https://orcid.org/0000-0002-0505-8688
hermes.silva@unesp.br
Gustavo Hermínio Salati Marcondes de Moraes
University of Campinas – Unicamp, Brazil
North-West Univerity, South África
https://orcid.org/0000-0001-5238-0314
salati@unicamp.br
Fernanda Cortegoso de Oliveira Frascareli
São Paulo State University – Unesp, Brazil
https://orcid.org/0000-0002-6369-9870
fernandacortegoso@yahoo.com.br
Abstract. This study aims to develop a model that analyzes the influence of learning orientation (LO) and entrepreneurial orientation (EO) as antecedents of performance in junior enterprises (JEs). To this end, a research model was developed and tested through a survey of a sample of 235 presidents of Brazilian Junior Enterprises. Through the Structural Modeling Equation (SME) technique, the effects of each of the variables on the performance of JEs were evaluated. The results indicate that both the EO and LO dimensions have a positive impact on the performance of this type of a company. Therefore, this study advances the understanding of the impact of strategic dimensions in a new context, as well as making direct contributions to these companies and other interested parties to use the results presented to support the construction of new strategies for improving performance.
Keywords: entrepreneurial orientation, learning orientation, performance, junior enterprises
Received: 19/6/2022. Accepted: 1/5/2023
Copyright © 2023 Jeferson Carlin dos Santos, Hermes Moretti Ribeiro da Silva, Gustavo Hermínio Salati Marcondes de Moraes, Fernanda Cortegoso de Oliveira Frascareli. Published by Vilnius University Press. This is an Open Access article distributed under the terms of the Creative Commons Attribution Licence, which permits unrestricted use, distribution, and reproduction in any medium, provided the original author and source are credited.
1. Introduction
Over the las few years, global growth and the consequent increase in world trade complexity have forced organizations to constantly reinvent themselves (Huang & Wang, 2011; Euchner, 2020). The challenges are increasingly greater and demand, for all company profiles, a significant ability to adapt in order to remain competitive and achieving their goals (Auwal et al., 2018).
Within this context, a number of strategic orientations have become particularly relevant: orientations which are able to offer leverage for businesses. Such is the case with EO and LO, which have been proven, through various studies, to be important factors of impact for the performance of enterprises (Lee et al., 2019; Werlang & Rosseto, 2019; Mulyana & Hendar, 2020).
EO is a business strategy that concentrates on risk-taking, innovation, proactivity, competitive aggressiveness and autonomy (Lumpkin & Dess, 1996), while LO analyzes the way in which organizations absorb and share information regarding strategic factors, with the aim of creating continuously better solutions (Kharabsheh et al., 2017). A complementary series of studies have been identified with respect to the influence of these indicators on the performance of a wide range of organizations. However, few studies have directly related them to the context of JEs.
The principal characteristics of JEs are that they are formed and managed exclusively by university students who, with the assistance of professors, offer services to society to benefit their members, the university and the marketplace in which they operate (Almeida et al., 2019a). These organizations are located within university centers and count on a vast network of possibilities; they offer the young people involved, who normally do not have professional experience, an optimal opportunity to gain first-hand entrepreneurial experience (Cortez et al., 2019). Although the main purpose of JEs is to develop students’ capabilities, such businesses also need to implement strategies to improve performance to complete their marketplace objective. For this reason, understanding the strategic guidelines of JEs proves to be an essential part of promoting their success.
Notwithstanding the limited number of available research studies around the topic of JEs, it can be clearly determined that such experiences offer students unparalleled benefits. Practical learning which complements theoretical learning in a classroom, an initial contact with the world of entrepreneurship (helping participants to form a network that will be evidently useful in the future) and developing leadership and managerial abilities are some examples of these benefits (Almeida et al., 2019a). However, little has been explored by researchers at an organizational level, resulting in a lack of understanding of how JEs function and how their performance strategies might be improved.
Despite EO and LO being widely reported in the academic literature, these constructs have never been evaluated in JEs or similar organizations in a joint or comparative way, which highlights the need to develop studies and models pertinent to this environment. This is important since the objectives of JEs are very different from those of companies that are more traditional and which usually focus on studies. One of these main differences is the search for profit versus the search for learning and development, which can impact the fundamentals of the constructs that form the EO, as observed by Almeida et al. (2019a), which potentially could also happen with the LO. Furthermore, it is important to mention the high turnover of its members, since students end up graduating and therefore can no longer be part of JE. Finally, when we talk about hierarchy, JEs tend to be much more horizontal, with decisions being taken in the vast majority of times in a shared way (Ribeiro et al., 2021).
Based on these premises, the objective of the present study is to answer the following research question: What is the effect of EO and LO on the performance of JEs?
To this end, we present (in Section 2) a theoretical literature review on JEs, LO, EO, and performance. In Section 3, a series of hypotheses (to be evaluated) are presented. Section 4, in turn, is dedicated to the conceptual model and the tools and methods employed during the study. Section 5 expounds on the results and the empirical tests of the model. Sections 6 and 7 present our discussions and results.
2. Literature Review
2.1 Junior Enterprises
The first JE, Junior ESSEC Conseil – L’Ecole Supérieure des Sciences Economiques et Commerciales, was founded in France in 1967, by a student of ESSEC whose objective was to create a professional organization led by students (Junior Essec, 2020). The Junior Business Movement (JBM) arrived in Brazil in 1988, and since then JBM has been responsible for fomenting the practical learning of thousands of students. According to data from Junior Brazil (2019), the end of 2020 reached a mark of 1,336 JEs present in 255 IES, with a total of 22,000 junior entrepreneurs operating throughout Brazil.
Brazil, in turn, was the first country to pass a law that would regulate the existence of this type of organization and help bring clarity about the main characteristics of these organizations. According to the Brazilian Law No. 13,267, JEs are organizations that exist with the aim of carrying out projects and services that contribute to the academic and professional development of associated students, making them more prepared for future professional challenges. Exclusively undergraduate students manage these entities with teacher’s support.
Although there are few studies regarding JE, those that there are reinforce the fact that participation in such organizations positively impacts on the entrepreneurial intention of its members, complementing the entrepreneurial education learning of students (Almeida et., 2019b) and increasing their employability index (Pennarola et al., 2016).
2.2. Entrepreneurial Orientation
Mintzberg (1973) and Khandwalla (1977) established EO as an intrinsic management tool for organizational decision making. In turn, Lumpkin and Dess (1996) went on to describe EO as an “organizational phenomenon” related to important decisions made in the name of an organization. In a similar way, Covin and Slevin (1991) considered entrepreneurial organizations to be those in which managers possess entrepreneurial business management characteristics, a fact seen in the strategic decisions taken by them.
Miller and Friesen (1982) characterized EO as the simultaneous demonstration of three constructs: innovation, risk-taking and proactivity. Lumpkin and Dess (1996), similarly defined EO as a series of processes, practices and decisions which lead to new openings for an organization. The authors referenced the three dimensions already cited by Miller and Friesen (1982), and added two others, namely autonomy and competitive aggressiveness.
Miller (1983) had a vision of innovation essentially based on product innovation. Lumpkin and Dess (1996), in turn, sought to expand this vision, describing it as a trend of an organization to be involved in and supportive of experimentation, new ideas and more creative processes, with the aim of creating new products, services and technologies. According to Miller (1983), a proactive organization is one that seeks to anticipate opportunities, aiming to introduce new products and, by such means, obtain competitive advantages. Accepting risks is evidence of an organization’s natural assumption of uncertainty. This is demonstrated by a predisposition to commit specific resources to new types of projects, activities or solutions, which inherently contain a high level of uncertainty with respect to returns (Hughes & Morgan, 2007). Competitive aggressiveness is the intensity with which an organization decides to compete and the efforts made to outperform competitors (Hughes & Morgan, 2007). Even autonomy represents a degree of freedom given to employees who are developing and executing new ideas (Lumpkin & Dess, 1996).
Research papers on the theme of EO provide a running debate with respect to its conceptualization and measurement (Covin & Wales, 2019). George and Marino (2011) suggest that to enrich knowledge with respect to EO, it is important to sustain the three central dimensions (proactivity, risk acceptance and innovation) and add other categories such as those proposed by Lumpkin and Dess (1996), in order to generate inputs which are relevant to specific contexts.
2.3. Learning Orientation
LO concerns the way in which organizations access information, share their knowledge and is generally related to market intelligence, new trends, threats and technologies, which can help with the long-term success of an enterprise (Calantone et al., 2002).
This construct also refers to the activities of an organization that involve the creation and use of knowledge with a view to increasing competitive advantage including: to obtain and share information about client needs, market changes and actions of competitors, and the development of new technologies to create new products which are superior to those of competitors (Hurley & Hult, 1998).
LO comprises four factors: commitment to learning, shared vision, open mind and intra-organizational knowledge sharing (Calantone et al., 2002).
Commitment to learning concerns the degree to which an enterprise valorizes and promotes learning, as well as its propensity to promote a learning environment (Choi, 2012). Shared vision is correlated to the level of focus and integration of an organization in the question of knowledge; open mind is the willingness to critically evaluate the operational routine of an enterprise and accept new ideas (Sinkula et al., 1997). Finally, intra-organizational knowledge sharing refers to collective beliefs or shared behavioral routines related to the dissemination of learning between different units within an organization (Hage et al.,1976).
2.4. Performance
Only through organizational performance evaluation is it possible to analyze if a strategy is assertive, understand its challenges and processes and, finally, overcome them (Venkatraman & Ramanujam, 1986). It is a complex business to arrive at a definition of what performance is, especially when dealing with non-profit organizations or social business.
Most non-profit cultures are influenced by the assumption that a non-profit is not a business and should not have strategic goals, this topic is supported by the idea that non-profits do not have a profit-generating interest and should not worry about planning the same way as a for-profit organization (Clark, 2012).
However, in the ever more competitive context, in which the search for survival is seen as essential, all organizations inevitably consider improving the evaluation of their results, aiming to improve them (González‐Benito et al., 2009).
The relationship between EO and LO and business performance has been broadly studied, bringing to light a wide variety of performance measures that have been used to evaluate the results of these constructions (Bhuian et al., 2005). These objective measures are frequently criticized, however, because the objective data are frequently not representative or consistent with the data supplied by other enterprises from the same sample, or because managers are often unwilling to supply it (Dess & Robinson, 1984).
For this reason, authors in many studies suggest the use of subjective measures when the objective collection of data is inadequate or unavailable (Deutscher et al., 2016). Indeed, the review carried out by Ellis (2006) highlights greater effects in performance when subjective factors are measured instead of objective factors, since the latter may limit or over-simplify the analysis. Regarding multi-dimensionality, many argue that business performance is, by nature, the result of multiple dimensions, and to focus only on objective data may lead to imprecision, since it may not reflect the true source of competitive advantage (Morgan & Strong, 2003).
JEs are characterized as non-profit civil organizations having organizational characteristics similar to small and medium enterprises and SB (social business). In this sense, studies that analyze the performance of these organizational models may provide interesting insights when deciding which scales will be defined to measure the performance of the JEs in this study.
We offer Modi and Mishra (2010) as an example. They measured the performance in non-profit organizations by means of four dimensions: satisfaction of the beneficiary, resource attraction, pair reputation and effectiveness. Miles et al. (2013), in turn, utilized measurements based on the social performance of an organization together with its economic performance in their studies about performance in SB. The former is formed from the satisfaction of donors and beneficiaries, advocacy for beneficiaries, and environmentally and socially responsible management.
Based on these observations, a multi-dimensional measurement, composed of measurements that evaluate the economic performance of clients and developments, appears to be appropriate for the objective of the present work.
3. Hypotheses Development
3.1. Entrepreneurial Orientation and Performance
Lumpkin and Dess (1996) were the first authors to clarify the link between EO and organizational performance. They proposed a unique conceptual structure to evaluate the relationship. Since then, much has been studied on this relationship in different contexts: small and medium enterprises (Kiyabo & Isaga, 2020; Mulyana & Hendar, 2020); fledgling enterprises (Hughes & Morgan, 2007); non-profit enterprises (Hu, 2013); large enterprises and industries (Bayarçelik & Özşahin, 2014); and enterprises from developing countries (Soomoro & Shah, 2020). Due to the substantial number of studies, a consensus may be drawn that, in truth, EO influences organizational performance.
JEs have some similar characteristics to all these company profiles, which may be a good indication of a potential relationship between EO and performance in this context, but at the same time, there are previously mentioned differences that can lead to different behaviors.
Innovation and proactivity can lead to the creation and implementation of new products and services with increasing added value (Rezaei & Ortt, 2018) as well as the process of taking risks can lead to new discoveries of previously unimagined opportunities for financial gain (Pham & Dao, 2022). Finally, competitiveness against other JEs can lead to a comparison of financial results and a consequent search for better performance (Csapi & Balogh, 2020). Therefore, the following hypothesis is proposed:
H1: Entrepreneurial orientation promotes greater economic performance in JEs.
Proactivity and autonomy can lead to a better exploratory process of the real and most important problems of the clients (Martin et al., 2018) while innovation can lead to the creation of solutions with greater adherence to these challenges (Desouza et al., 2008). The JE favorable environment for taking risks can facilitate the implementation of tests without fear of major losses. Finally, the more aggressive competitiveness against other JEs can lead to the search for increasingly better solutions to serve customers better than their competitors (Adefulo et al., 2018). Based on the above, the following hypothesis is proposed:
H2: Entrepreneurial orientation promotes greater client performance in JEs.
Autonomy can lead members to experiment with new ways and formats of executing projects and processes (Khoshnaw & Alavi, 2020), as well as innovation, proactivity and risk taking can lead to the design and subsequent execution of activities that are different and more challenging than those usually applied by JEs (Segarra-Ciprés et al., 2019). All these characteristics can collaborate for the use of new skills thus influencing the perception of greater development on the part of students. In this way, the following hypothesis can be proposed:
H3: Entrepreneurial orientation promotes greater development performance in JEs.
3.2. Learning Orientation and Performance
Studies such as those of Hu (2013) and Kharabsheh et al. (2017) emphasize how high levels of LO result in good performance levels in the contexts of non-profit and manufacturing organizations; while other studies such as Cho and Lee (2020), applied to Korean entrepreneurs, and Phorncharoen (2020) with small business in the real-estate sector do not demonstrate a significant relationship. Contrasting results are continually found in diverse studies.
Commitment to learning can lead to greater training of members with a view to better performance of key activities or new products, thus bringing a potential for greater financial return (Espinoza et al., 2023). An open mind, in turn, can create a more conducive environment for discovering new services and business opportunities (Dukeov et al., 2020) which can be better explored through a single vision shared by the company. Therefore, the following hypothesis is proposed:
H4: Learning orientation promotes greater economic performance in JEs.
Commitment to learning can lead to further development of JE members, making them more capable of performing key activities to generate value for their clients, potentially increasing their performance (Wang & Lo, 2002). Open mindset can allow for more active listening to the real needs of customers, creating solutions that are more in line with their real needs (Al-Abrrow et al., 2021). Finally, sharing knowledge can help to provide more uniform training for members, ensuring a more standardized delivery of value with similar quality, without disparity in customer service (Shen & Tang, 2018). Based on the above, the following hypothesis is proposed:
H5: Learning orientation promotes greater client performance in JEs.
An open mind can help in a greater understanding and acceptance of the students learning gaps, and the commitment, in turn, can lead to a greater dedication in the process of improving them, positively affecting their developmental performance (Lord, 2015). On the other hand, sharing learning in a more controlled environment can make this development process uniform throughout the company (Mohajan, 2019), since there is no centralization of knowledge in a few people. In this way, the following hypothesis can be proposed:
H6: Learning orientation promotes a greater development performance in JEs.
4. Research Methodology
4.1. Sample and Data Collection Technique
The study sample comprises presidents and directors of JEs drawn from the entire territory of Brazil. We did not consider individuals from lower hierarchical levels. This decision was taken to collect information from respondents that characterized a holistic view of organizational strategy.
The sample is of the non-probabilistic type in relation to the size of the sample, considering a finite group of 1,140 JEs. We used the GPower software for PLS-SEM, for which a minimum sample size of 77 is recommended.
In total, 242 responses were collected during the period from the 1st to 31st July 2020. However, as seven of these indicated that the respondent did not hold a position of president or director, only 235 were considered valid.
The collection of data was done through the application of a survey-type form, given to presidents and directors from Brazilian JEs. The respondents were reached by sharing the questionnaire through electronic means, principally social media (such as WhatsApp and Facebook), and by publication in specific groups of the focus profiles mentioned above. In addition to publications on social media, we approached leaders in each state to obtain contact details for the JE presidents in their regions, allowing us to personally contact each one. This strategy ensured greater effectiveness in the number of respondents, the main means by which answers were obtained.
Of the 235 respondents, 117 were female (49.8%), 117 were male (49.8%) and 1 individual declared as transgender (0.4%), it is noteworthy that the equal number between female and male respondents was just a coincidence. In terms of the length of time participating in a JE, we observed that most of respondents had between 13 to 24 months’ experience, which is coherent with the average minimum time to reach a leadership position within a JE. In terms of geographical distribution, we identified respondents from all regions of Brazil (18 states, in addition to the Federal District). The states with more respondents were Minas Gerais (17.9%) and Santa Catarina (14%). Altogether, 12.4% of replies were from the Central-west region, 21.4% from the Northeast region, 1.7% from the North region, 39.6% from the Southeast region and 25.1% from the South region. We also sought a complementary analysis of the educational background of respondents, in which 48.9% stated they were from the “Engineering and Technology” area, 14.5% from “Applied Social Sciences” and 12.8% identified as “Others”.
4.2. Measurement
The scales chosen were adapted from the original scales and translated into Portuguese. EO, LO and performance were measured using a Likert scale of 7 points, ranging from 1 = completely disagree to 7 = completely agree.
EO is measured by means of the Hughes and Morgan (2007) scale, constructed based on the Lumpkin and Dess (1996) concept of EO, and covers the following dimensions: risk acceptance (RA), proactivity (PR), innovation (IN), competitive aggressiveness (CA) and autonomy (AU). Various studies, which have used the Hughes and Morgan (2007) scale, confirm its high reliability and applicability for the measurement of EO in small and medium enterprises (Buli, 2017).
The LO scales were adapted from Calantone et al. (2002). According to the authors, LO refers to the activity of an organization to create and use knowledge to increase competitive advantage, and includes four components: commitment to learning (CL), shared vision (SV), open mind (OM) and intra-organizational knowledge sharing (KS).
To measure performance, a multi-dimensional approach, comprising elements that evaluate economic, client and development performance, was considered appropriate for the objective of the current work.
Miles et al. (2013), in their analysis of economic performance (EP) in social business, were able to develop a new bias for scale and focused on economic viability and not necessarily on profitability. Affirming that this scale best fits that expected of JEs, we opted to use such a scale to evaluate performance. Client performance (CP) was measured with a scale developed by Hughes and Morgan (2007), which the authors used to evaluate the relationship between EO dimensions and the performance of enterprises. Development performance (DP) can be measured through the scale of Chen and Hsu (2013), developed to measure the performance of non-profit organizations and their relationship with EO. The scale does not measure the skill development enterprise members, instead reflecting on organizational vision, the degree of coordination between members and their satisfaction.
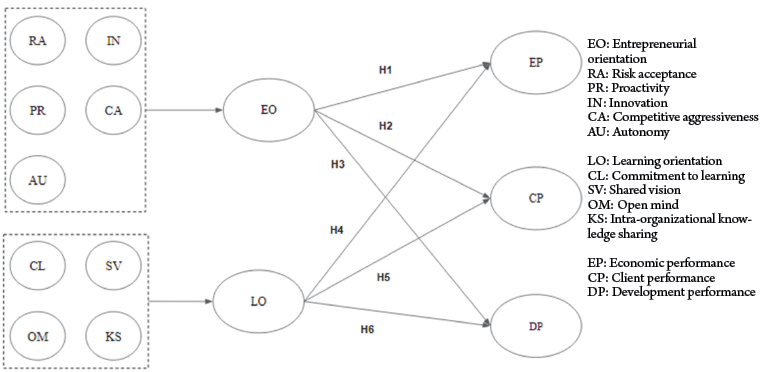
4.3. Conceptual Model
The conceptual model illustrated in Figure 1 summarizes the hypotheses previously constructed. The model proposed examines the impact of EO and LO on the performance of JEs.
Figure 1
A Framework Linking Entrepreneurial Orientation and Learning Orientation to Performance
5. Results
The analysis of the results contemplated the evaluations of the scales and of the measurement and structural models.
Initially, a Confirmatory Factor Analysis (CFA) was performed to ensure the reliability and validity of the results and the quality of the evaluations to be carried out later. The CFA followed the recommendations of Hair et al. (2019), and only measures that could negatively affect stroke and critical ratio were eliminated. Thus, indicators AU4, AU6, OM3, EP1 and EP3 were excluded. It is observed that, with regard to autonomy, issues related to freedom of communication and access to vital information did not prove to be significant, and it may be the result of still very hierarchical structures present in JEs as well the leadership profile based on the command and control. Regarding economic performance, the two excluded constructs are very similar and demonstrated some difficulty in understanding by the interviewees, which may have led to the results presented. The Appendix presents the CFA performed with the SmartPLS software (Ringle et al., 2015).
After evaluating the measurement scales, the measurement model was evaluated using a two-step approach. In the first part, the first order constructs were evaluated considering the convergent validity, the discriminant validity, the internal consistency and the reliability of the indicator. Table 1 presents the evaluation, and all indicators are within the range established by Hair et al. (2019).
Table 1
Evaluation of the First Order Constructs Measurement Model
|
Constructs |
CA |
RA |
AU |
CL |
IO |
CP |
DP |
EP |
IN |
OM |
PR |
SV |
|
CA |
0.858 |
|
|
|
|
|
|
|
|
|
|
|
|
RA |
0.291 |
0.735 |
|
|
|
|
|
|
|
|
|
|
|
AU |
0.164 |
0.355 |
0.730 |
|
|
|
|
|
|
|
|
|
|
CL |
0.192 |
0.334 |
0.371 |
0.732 |
|
|
|
|
|
|
|
|
|
IO |
0.197 |
0.334 |
0.367 |
0.452 |
0.730 |
|
|
|
|
|
|
|
|
CP |
0.099 |
0.173 |
0.273 |
0.132 |
0.172 |
0.843 |
|
|
|
|
|
|
|
DP |
0.167 |
0.302 |
0.410 |
0.266 |
0.450 |
0.381 |
0.715 |
|
|
|
|
|
|
EP |
0.259 |
0.196 |
0.288 |
0.155 |
0.279 |
0.423 |
0.507 |
0.712 |
|
|
|
|
|
IN |
0.189 |
0.360 |
0.315 |
0.254 |
0.410 |
0.252 |
0.442 |
0.283 |
0.811 |
|
|
|
|
OM |
0.213 |
0.323 |
0.256 |
0.403 |
0.455 |
0.040 |
0.323 |
0.197 |
0.394 |
0.761 |
|
|
|
PR |
0.396 |
0.296 |
0.194 |
0.233 |
0.299 |
0.355 |
0.494 |
0.461 |
0.427 |
0.274 |
0.750 |
|
|
SV |
0.169 |
0.250 |
0.403 |
0.319 |
0.428 |
0.133 |
0.568 |
0.330 |
0309 |
0365 |
0.422 |
0.805 |
|
Cronbach’s Alpha |
0.829 |
0.587 |
0.727 |
0.707 |
0.783 |
0.790 |
0.803 |
0.795 |
0.740 |
0.643 |
0.609 |
0.818 |
|
Composite Reliability |
0.893 |
0.772 |
0.817 |
0.821 |
0.849 |
0.878 |
0.861 |
0.869 |
0.851 |
0.805 |
0.792 |
0.880 |
|
Average Variance Extracted |
0.736 |
0.540 |
0.532 |
0.535 |
0.533 |
0.710 |
0.511 |
0.627 |
0.657 |
0.579 |
0.562 |
0.647 |
The second part of the analysis involved the evaluation of the second order constructs (EO and LO), which are formative, and the reflexive constructs (DP, CP, EP). Table 2 presents the results of the evaluation of reflexive constructs, which are within the criteria established by Hair et al. (2019) and Hair et al. (2018).
Table 2
Evaluation of the Second Order Constructs Measurement Model
|
Constructs |
CP |
DP |
EP |
LO |
EO |
|
CP |
0.843 |
|
|
|
|
|
DP |
0.385 |
0.714 |
|
|
|
|
EP |
0.425 |
0.510 |
0.713 |
|
|
|
LO |
0.172 |
0.612 |
0.365 |
FORMATIVE |
|
|
EO |
0.417 |
0.617 |
0.494 |
0.594 |
FORMATIVE |
|
Cronbach’s Alpha |
0.79 |
0.803 |
0.731 |
FORMATIVE |
FORMATIVE |
|
Composite |
0.879 |
0.861 |
0.829 |
FORMATIVE |
FORMATIVE |
|
Average Variance Extracted |
0.711 |
0.51 |
0.509 |
FORMATIVE |
FORMATIVE |
To evaluate the formative constructs, the Variance Inflation Factor (VIF), the redundancy analysis and the significance of the indicators were evaluated. All values presented were adequate to maintain the indicators in the model (Hair et al., 2019).
The evaluation of the structural model used the bootstrapping technique to analyze the significance of the relationships. The distribution of the T statistics analyzes the hypothesis that the path coefficients are significant (Hair et al., 2019). Table 3 presents the values of the coefficients between the constructs and their respective statistical T scores.
Table 3
Coefficients of the Structural Model Between Constructs
|
Relationships |
Average |
Standard |
T |
P-value |
|
Learning Orientation → Client Performance |
-0.104 |
0.072 |
1.648 |
0.100 |
|
Learning Orientation → Development Performance |
0.378 |
0.071 |
5.346 |
0.000 |
|
Learning Orientation → Economic Performance |
0.118 |
0.086 |
1.266 |
0.206 |
|
Entrepreneurial Orientation → Client Performance |
0.485 |
0.074 |
6.583 |
0.000 |
|
Entrepreneurial Orientation → Development Performance |
0.401 |
0.065 |
6.046 |
0.000 |
|
Entrepreneurial Orientation → Economic Performance |
0.434 |
0.070 |
6.164 |
0.000 |
As shown, two T values were not above 1.96, therefore not supporting hypotheses 4 and 5. Both are related to the impact of learning on customer performance and economic performance, this may have occurred due to the fact that, when talking about learning within JEs, it still ends up focusing on individual needs of members that can be good for the future professional, but that do not necessarily have a direct correlation with the needs of the clients or the results derived from them. The complete resultant model of our empirical approach is presented in Figure 2.
Figure 2
Complete Empirical Model
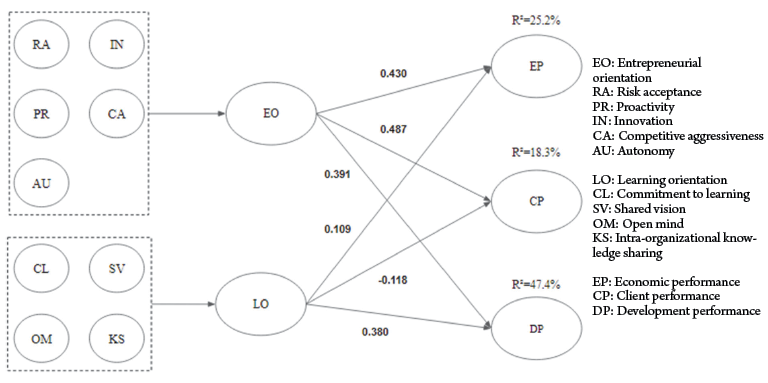
According to Cohen (1988) and Faul et al. (2009), R² values varying from 2% to 13%, 13% to 35% and above 35% are considered as having a small, medium and great effect, respectively. The calculations show that economic performance presented an R² of 0.252 (medium effect), client performance – an R² of 0.183 (medium effect), and development performance – an R² of 0.474 (great effect). Therefore, it can be observed that, despite the fact that the values demonstrated satisfactory effects, there is an apparent discrepancy between the effects on the development that comes from the constructs related to LO in relation to EO.
6. Discussion
The proposed research model sought to evaluate the effects of the EO and LO dimensions on the performance of Brazilian JEs presented in the scales developed by Hughes and Morgan (2007) and Calantone et al. (2002), respectively.. Three main strands of performance were evaluated: economic, development and client.
The analyses of the Measurement and Structural Models confirmed that EO and LO have a positive influence on the performance of JEs, which is consistent with the literature. However, we found different levels of influence. Through the Coefficient of Determination (R²), a disparity was noted: 0.252 in the case of economic performance, 0.183 in client performance, and 0.474 in development performance.
As indicated by Almeida et al. (2019a), we found a positive result in the relationship between EO and performance, which supports hypotheses H1, H2 and H3. This discovery reinforces the importance enterprises should place on encouraging characteristics such as risk-taking, proactivity, autonomy, innovation and competitiveness in their employees. A business culture that implies entrepreneurship is beneficial for the growth of JEs.
The discovery of the effect of LO on the performance of JEs replicates and amplifies the research of Calantone et al. (2002), Hu (2013), and Kharabsheh et al. (2017), who found a positive relationship between LO and performance. However, it is worth mentioning that this relationship is only significant for the context in which the performance related to development (H6) is analyzed, in counterpoint to economic performance (H4) and client performance (H5), in which we observed no significant relationship. This can be explained by the focus on the development of students and their learning above financial gains and the development of their clients (Ribeiro et al., 2021). As pointed out in the results, the focus on the students’ personal development is not always directly linked to the real gaps in the relationship with their clients, which ends up with the creation of formal development programs that generate impact on the professional training of the student but that do not necessarily impact customers in the short term. If there is no or low direct impact on the customer development, consequently, it will not provide a real exchange of value between the parties, impacting on the customers’ willingness to provide a financial return, which may consequently justify the low relationship with economic development.
Indeed, despite being positive, the effect of LO on performance is marginal when compared to the effect of EO on performance. This means that performance, whether economic, client or development, is much more related to the entrepreneurial characteristics than those geared towards learning.
Thus, we conclude the analyses and results of this study. All the stages established during the methodology were operationalized, all the hypotheses were tested and their results evaluated and discussed. The final chapter of this work will place emphasis on discussion regarding the proposed objectives, on the contributions of the research, and on its limitations and suggestions for future studies.
7. Conclusion and Final Remarks
Based on the issues expounded in the introductory chapter, the objective of this work was to evaluate the validity of a model that contemplates EO and LO as antecedents of performance in JEs.
The entrepreneurial EO presented a positive effect in all the performance scopes analyzed, reinforcing that by encouraging characteristics such as risk-taking, proactivity, innovation, competitive aggressiveness and autonomy, JEs will be capable of achieving better financial, client satisfaction and member development indicators. The EO turns out to have a greater influence on CP (0.487), closely followed by EP (0.430) and finally, DP (0.391), which demonstrates a significant relationship of EO in the process of expansion in the number of customers and consequent improvement in JEs financial indicators, but which reinforces an opportunity to improve customer satisfaction. These results are in line with a stimulus given to JEs in recent years, in which the execution of more rather than better projects has still been prioritized.
In contrast, LO presents a positive, although marginal, relationship with the performance of such organizations. Promoting a greater commitment to learning, shared vision, open mind and knowledge sharing does not show to be significant for EP or CP, only for DP. The LO had the greatest impact on DP (0.380), followed by EP (0.109), and a negative impact on CP (-0.118). As the CP is related to expanding the customer base and attracting new ones, it can be said that the influence of the LO ends up being low in this first stage of action, which is the acquisition of new customers. However, when this customer becomes part of JEs customer portfolio, we can say, based on the observed DP values, that the LO ends up influencing its retention, since the DP is directly related to employee satisfaction and the quality of the service provided by them to the current customer base.
Based on the above, it is believed that the work reached the objective of understanding the effect of both mentioned guidelines on the performance of JEs.
Being an empirical investigation, the current study has some limitations. Firstly, there is the point that our sample, despite contemplating JEs from various regions and different areas of study, is still non-probabilistic. In addition, the impact of control variables, such as JE size, main business or area of study of members, was not evaluated. A larger sample would have provided for a more robust statistical analysis in this respect.
Secondly, the challenge of using existing EO and LO scales is high, exactly because the majority of them do not match the reality and characteristics of organizations such as JEs. The use of Likert scales also implies subjective results from respondents with respect to their organizations, an effect that may generate biased views as they are based on the individual perception of only one member of an organization.
Future research could analyze the dimensions studied in the present research within different study areas, regions and countries, thereby offering important insights to the refinement of the scales. We also suggest carrying out other surveys on different samples to test new dimensions. In addition, new studies should evaluate the effects of IO on performance to confirm the non-existence of this relationship, as well as the mediating effects of OI dimensions.
Finally, the procedure of the present study revealed that there is a lack of research about organizations such as JEs. There is a need in this respect to better understand their characteristics and impact on students, so that it might be possible to recommend specific measures to improve the performances of these organizations and, consequently, increase their relevance.
References
Adefulo, A. D., Asikhia, O. U., & Aroyeun, T. F. (2018). The Effect of Pro-Activeness on Growth of Selected Small and Medium Scale Enterprises in Ogun State Nigeria. IOSR Journal of Business and Management, 20(12), 14–21.
Al-Abrrow, H., Fayez, A.S., Abdullah, H., Khaw, K.W., Alnoor, A., & Rexhepi, G. (2021). Effect of open-mindedness and humble behavior on innovation: Mediator role of learning. International Journal of Emerging Markets (ahead-of-print). https://www.emerald.com/insight/1746-8809.htm
Almeida, J., Daniel, A. D., & Figueiredo, C. (2019a). Understanding the Role of Entrepreneurial Orientation in Junior Enterprises. Journal of Entrepreneurship Education, 22(2), 1–14.
Almeida, J., Daniel, A. D., & Figueiredo, C. (2019b). The future of management education: the role of entrepreneurship education and junior enterprises. The International Journal of Management Education, 19(1), 100318.
Auwal, A. M., Mohamed, Z., Shamsudin, M. N., Sharifuddin, J., & Ali, F. (2018). External pressure influence on entrepreneurship performance of SMEs: A case study of Malaysian herbal industry. Journal of Small Business & Entrepreneurship, 32(2), 1–23.
Bayarçelik, E. B., & Özşahin, M. (2014). How Entrepreneurial Climate Effects Firm Performance? Procedia – Social and Behavioral Sciences, 150, 823–833.
Bhuian, S. N., Menguc, B., & Bell, S. J. (2005). Just Entrepreneurial Enough: The Moderating Effect of Entrepreneurship on the Relationship Between Market Orientation and Performance. Journal of Business Research, 58(1), 9–17. DOI:10.1016/S0148-2963(03)00074-2
Brasil Júnior (2019, November 25). Planejamento Estratégico da Rede 2019 – 2021. https://pedarede.com.br/#inicial.
Brasil Júnior (2020, April 10). Relatório de Legado, 2019. https://drive.google.com/file/d/1kuLpgUjmeIseb4nP6WZ382oi3wuoPhWu/view
Brasil Júnior (2019, October 07). Brasil Júnior Homepage. https://www.brasiljunior.org.br/.
Buli, B. M. (2017). Entrepreneurial orientation, market orientation and performance of SMEs in the manufacturing industry. Management Research Review, 40(3), 292–309.
Calantone, R. J., Cavusgil, S. T., & Zhao, Y. (2002). Learning orientation, firm innovation capability, and firm performance. Industrial Marketing Management, 31(6), 515–524.
Chen, H. L., & Hsu, C. H. (2013). Entrepreneurial Orientation and Firm Performance in Non-Profit Service Organizations: Contingent Effect of Market Orientation. The Service Industries Journal, 33(5), 445–466.
Cho, Y. H., & Lee, J. H. (2020). A Study on the Effects of Entrepreneurial Orientation and Learning Orientation on Financial Performance: Focusing on Mediating Effects of Earket Orientation. Sustainability, 12(11), 4594.
Choi, S. (2012). Learning Orientation and Market Orientation as Catalysts for Innovation in Nonprofit Organizations. Nonprofit and Voluntary Sector Quarterly, 43(2), 393–413.
Clark, W. (2012). Introducing Strategic Thinking into a Non-profit Organization to Develop Alternative Income Streams. Journal of Practical Consulting, 4(1), 32–42.
Cohen, J. (1988). Statistical Power Analysis for the Social Sciences (2nd ed.). Lawrence Erlbaum Associates.
Cortez, P. A., Veiga, H. M. S., & Salvador, A. P. (2019). Impact of personality and junior enterprise to stimulate potential entrepreneurs. Arquivos Brasileiros de Psicologia, 71 2), 179-192.
Covin, J. G., & Wales, W. J. (2019). Crafting High-Impact Entrepreneurial Orientation Research: Some Suggested Guidelines. Entrepreneurship Theory and Practice, 43,(1), 3–18.
Covin, J. G., & Slevin, D. P. (1991). A Conceptual Model of Entrepreneurship as Firm Behavior. Entrepreneurship Theory and Practice, 16(1), 7–26.
Csapi, V., & Balogh, V. (2020). A financial performance-based assessment of SMEs’ competitiveness – an analysis of Hungarian and US small businesses. Problems and Perspectives in Management, 18(3), 452–464.
Desouza, K. C., Awazu, Y., Jha, S., Dombrowski, C., Papagari, S., Baloh, P., & Kim, J. Y. (2008). Customer-Driven Innovation. Research-Technology Management, 51(3), 35–44.
Dess, G. G., & Robinson, R. B. (1984). Measuring Organizational Performance in the Absence of Objective Measures: The Case of the Privately Held Firm and Conglomerate Business Unit. Strategic Management Journal, 5(3), 265–273.
Deutscher, F., Zapkau, F. B., Schwens, C., Baum, M., & Kabst, R. (2016). Strategic orientations and performance: A configurational perspective. Journal of Business Research, 69(2), 849–861.
Dukeov, I., Bergman, J.P., Heilmann, P., & Nasledov, A. (2020). Impact of a firm’s commitment to learning and open-mindedness on its organizational innovation among Russian manufacturing firms. Baltic Journal of Management, 15(4), 551–569.
Ellis, P. D. (2006). Market Orientation and Performance: A Meta-Analysis and Cross-National Comparisons. Journal of Management Studies, 43(5), 1089–1107.
Espinoza, P. A. M., Martins, T. S., Gomes, P. M. L. (2023). The relationship between learning orientation and new product development capability. Knowledge and Process Management, 30(1), 3–13.
Euchner, J. (2020). Innovation and Globalization. Research Technology Management, 63(6), 13–14.
Faul, F., Erdfelder, E., Buchner, A., & Lang, A. G. (2009). Statistical power analyses using G*Power 3.1: Tests for correlation and regression analyses. Behavior Research Methods, 41(4), 1149–1160.
George, B. A., & Marino, L. (2011). The Epistemology of Entrepreneurial Orientation: Conceptual Formation, Modeling, and Operationalization. Entrepreneurship Theory and Practice, 35(5), 989–1024.
González-Benito, O., González-Benito, J., & Muñoz-Gallego, P. A. (2009). Role of entrepreneurship and market orientation in firms’ success. European Journal of Marketing, 43(¾), 500–522.
Hage, J., Zaltman, G., Duncan, R., & Holbek, J. (1976). Innovations and Organizations. Contemporary Sociology, 5(4), 479–487.
Hair, J. F., Risher, J., Sarstedt, M., & Ringle, C. M. (2019). When to Use and How to Report the Results of PLS-SEM. European Business Review, 31(1), 2–24.
Hair, J. F., Sarstedt, M., Ringle, C. M., & Gudergan, S. P. (2018). Advanced Issues in Partial Least Squares Structural Equation Modeling. Sage.
Hu, Y. (2013). Role of Organizational Learning in the Relationship between Entrepreneurial Orientation and Performance of Nonprofit Organizations. Journal of Applied Sciences, 13(14), 2795–2800.
Huang, S. K., & Wang, Y. L. (2011). Entrepreneurial orientation, learning orientation, and innovation in small and medium enterprises. Procedia – Social and Behavioral Sciences, 24, 563–570.
Hughes, M., & Morgan, R. E. (2007). Deconstructing the Relationship Between Entrepreneurial Orientation and Business Performance at the Embryonic Stage of Firm Growth. Industrial Marketing Management, 36(5), 651–661.
Hurley, R. F., & Hult, G. T. (1998). Innovation, Market Orientation, and Organizational Learning: An Integration and Empirical Examination. Journal Of Marketing, 62(3), 42–54.
Junior Enterprises Global (2020, April 20). Confederations. Junior Enterprises Global. https://juniorenterprises.org/confederations/.
Junior Enterprises Europe (2019, June 13). JE Network. Junior Enterprises Europe. https://juniorenterprises.eu/.
Junior Essec (2020, June 20). History of Junior ESSEC. Junior Essec. https://www.en.junioressec.com/history.
Khandwalla, P. N. (1977). Some Top Management Styles, Their Context and Performance. Organization & Administrative Sciences, 7, 21–45.
Kharabsheh, R., Ensour, W., & Bogolybov, P. (2017). Learning Orientation, Market Orientation and Organizational Performance: The Mediating Effect of Absorptive Capacity. Business And Economic Research, 7(1), 114–127.
Khoshnaw, S., & Alavi, H. (2020). Examining the Interrelation Between Job Autonomy and Job Performance: A Critical Literature Review. Multidisciplinary Aspects of Production Engineering, 3(1), 606–616.
Kiyabo, K., & Isaga, N. (2020). Entrepreneurial orientation, competitive advantage, and SMEs’ performance: application of firm growth and personal wealth measures. Journal of Innovation and Entrepreneurship, 9, 12(2020). https://doi.org/10.1186/s13731-020-00123-7
Lee, Y., Zhuang, Y., Joo, M., & Bae, T. J. (2019). Revisiting Covin and Slevin (1989): Replication and extension of the relationship between entrepreneurial orientation and firm performance. Journal of Business Venturing Insights, 12, e00144.
Lord, M. (2015). Group learning capacity: The roles of open-mindedness and shared vision. Frontiers in Psychology, 6,150.
Lumpkin, G. T., & Dess, G. G. (1996). Clarifying the Entrepreneurial Orientation Construct and Linking It to Performance. The Academy of Management Review, 21,(1), 135–172.
Martin, S. L., Klimoski, R. J., & Henderson, A. (2018). The Impact of Employee Proactivity on Dimensions of Internal Service Quality. Academy of Management Annual Meeting Proceedings(1),12016. DOI:10.5465/AMBPP.2018.12016
Miles, M. P., Verreynne, M. L., Luke, B., Eversole, R., & Barraket, J. (2013). The development of a social value orientation scale: The nexus of Vincentian social values and entrepreneurship in social enterprises. Review of Business, 33(2), 91–102.
Miller, D., & Friesen, P. H. (1982). Innovation in Conservative and Entrepreneurial Firms: Two Models of Strategic Momentum. Strategic Management Journal, 3(1), 1–25.
Miller, D. (1983). The Correlates of Entrepreneurship in Three Types of Firms. Management Science, 29(7), 770–791.
Mintzberg, H. (1973). Strategy-Making in Three Modes. California Management Review, 16(2), 44–53.
Modi, P., & Mishra, D. (2010). Conceptualizing Market Orientation in Non-Profit Organisation: Definition, Performance, and Preliminary Construction of a Scale. Journal of Marketing Management, 26(5-6), 548–569.
Mohajan, H. K. (2019). Knowledge Sharing among Employees in Organizations. Journal of Economic Development Environment and People, 8(1), 52–61.
Morgan, R. E., & Strong, C. A. (2003). Business performance and dimensions of strategic orientation. Journal of Business Research, 56(3), 163–176.
Mulyana, M., & Hendar, H. (2020). Market and entrepreneurial orientation on business performance: Role of networks innovation agility. Journal of Small Business & Entrepreneurship, 1–17. DOI:10.1080/08276331.2020.1855025
Pennarola, F., Pistill L., & Dawson, G. (2016). From College to Consulting Through the Main Door: When IT Skills Make a Difference for Junior Enterprise Students. In 37th International Conference on Information Systems, (pp. 2549–2565).
Pham, P. M. T., & Dao, B. T. T. (2022). A meta-analysis of risk taking and corporate performance. Cogent Business & Management, 9(1), 2064263. https://doi.org/10.1080/23311975.2022.2064263
Phorncharoen, I. (2020). Influence of market orientation, learning orientation, and innovativeness on operational performance of real estate business. International Journal of Business Management, 12, 1–11.
Rezaei, J., & Ortt, R. (2018). Entrepreneurial orientation and firm performance: The mediating role of functional performances. Management Research Review, 41(7), 878–900.
Ribeiro, A. M. S., Burger, R. E., & Cario, S. A. F. (2021). The Iintermediary Role of Junior Enterprises in University–Industry Interaction: The Case of Santa Catarina. Revista Gestão Universitária na América Latina–GUAL, 14(3). DOI: https://doi.org/10.5007/1983-4535.2021.e77523
Ringle, C. M., Wende, S., & Becker, J. M. (2015). SmartPLS 3. Boenningstedt: SmartPLS. Retrieved from https://www.smartpls.com
Segarra-Ciprés, M., Escrig-Tena, A., & García-Juan, B. (2019). “Employees’ proactive behavior and innovation performance: Examining the moderating role of informal and formal controls.” European Journal of Innovation Management, 22(5), 866–888.
Shen, J., & Tang, C. (2018). How does training improve customer service quality? The roles of transfer of training and job satisfaction. European Management Journal, 36(6), 708–716.
Sinkula, J. M., Baker, W. E., & Noordewier, T. (1997). A Framework for Market-Based Organizational Learning: Linking Values, Knowledge, and Behavior. Journal of The Academy of Marketing Science, 25 (4), 305–318.
Soomro, B.A., & Shan, N. (2020). Entrepreneurial orientation and performance in a developing country: Strategic entrepreneurship as a mediator. Business Strategy and Development, 3(4), 567–577.
Venkatraman, N., & Ramanujam, V. (1986). Measurement of Business Performance in Strategy Research: A Comparison of Approaches. Academy of Management Review, 11(4), 801–814.
Wang, Y, & Lo, H-P. (2002). Customer-focused performance and the dynamic model for competence building and leveraging: A resource-based view. Journal of Management Development, 22(6), 483–526.
Werlang, N. B., & Rossetto, C. R. (2019). The effects of organizational learning and innovativeness on organizational performance in the service provision sector. Gestão & Produção, 26 (3), e3641.
Appendix
Confirmatory Factor Analysis Results
|
|
Items |
Std. path loading |
Mean |
SD |
Critical Ratio |
P-value |
|
|
Risk |
RA1 |
The term “risk-taker” is considered a positive attribute for people in our enterprise. |
0.553 |
4.877 |
1.323 |
5.977 |
0.000 |
|
RA2 |
People in our enterprise are encouraged to assume calculated risks with new ideas. |
0.751 |
5.421 |
1.233 |
11.329 |
0.000 |
|
|
RA3 |
Our enterprise emphasizes the exploitation and experimentation of opportunities. |
0.866 |
6.047 |
1.049 |
20.492 |
0.000 |
|
|
Proactivity |
PR1 |
We always try to take the initiative in all situations (against competitors, in projects where we work with other people). |
0.755 |
5.179 |
1.338 |
16.901 |
0.000 |
|
PR2 |
We excel at identifying opportunities. |
0.851 |
4.323 |
1.407 |
41.858 |
0.000 |
|
|
PR3 |
We initiate actions to which other organizations respond. |
0.624 |
4.387 |
1.738 |
8.759 |
0.000 |
|
|
Innovation |
IN1 |
We have actively implemented improvements and innovation in our business. |
0.802 |
5.587 |
1.342 |
29.652 |
0.000 |
|
IN2 |
Our business is creative in terms of its operational methods. |
0.853 |
4.855 |
1.361 |
37.825 |
0.000 |
|
|
IN3 |
Our business seeks new ways of doing things. |
0.777 |
5.545 |
1.331 |
20.94 |
0.000 |
|
|
Competitive Aggressiveness |
CA1 |
Our enterprise is intensively competitive. |
0.854 |
3.753 |
1.769 |
27.604 |
0.000 |
|
CA2 |
In general, our enterprise adopts a daring or aggressive approach to competition. |
0.859 |
3.119 |
1.669 |
28.659 |
0.000 |
|
|
CA3 |
We try to undo and out-maneuver the competition in the best way possible. |
0.864 |
4.034 |
1.701 |
37.642 |
0.000 |
|
|
Autonomy |
AU1 |
Employees are allowed to act and think without interference. |
0.614 |
5.698 |
1.343 |
8.752 |
0.000 |
|
AU2 |
Employees perform tasks that allow them to make and instigate changes in the way they do their jobs. |
0.833 |
5.877 |
1.155 |
28.63 |
0.000 |
|
|
AU3 |
Employees have the freedom and independence to decide themselves how they carry out their work. |
0.777 |
5.579 |
1.267 |
15.976 |
0.000 |
|
|
AU4 |
Employees have the freedom to communicate without interference. (Excluded) |
- |
6.43 |
0.886 |
- |
- |
|
|
AU5 |
Employees are given the authority and responsibility to act alone if they think that this is in the best interests of business. |
0.682 |
5.468 |
1.36 |
11.657 |
0.000 |
|
|
AU6 |
Employees have access to all vital information. (Excluded) |
- |
6.13 |
1.251 |
- |
- |
|
|
Commitment to learning |
CL1 |
Managers fundamentally agree that the learning capacity of our organization is essential for our competitive advantage. |
0.681 |
5.983 |
1.13 |
11.352 |
0.000 |
|
CL2 |
The fundamental values of this organization include learning as a key to improvement. |
0.697 |
6.136 |
1.11 |
13.747 |
0.000 |
|
|
CL3 |
The sense here is that employee learning is an investment, not an expense. |
0.727 |
6.596 |
0.886 |
12.503 |
0.000 |
|
|
CL4 |
Learning in my organization is seen as an essential product, necessary to ensure organizational survival. |
0.813 |
6.506 |
0.801 |
19.967 |
0.000 |
|
|
Shared |
SV1 |
There is a similarity of purpose in my organization. |
0.792 |
5.63 |
1.36 |
24.023 |
0.000 |
|
SV2 |
There is complete agreement about our organizational vision in all levels, functions and divisions. |
0.785 |
5.217 |
1.499 |
24.228 |
0.000 |
|
|
SV3 |
All employees are committed to the objectives of this organization. |
0.854 |
5.217 |
1.479 |
42.131 |
0.000 |
|
|
SV4 |
Employees see themselves as partners in mapping the direction of this organization. |
0.787 |
5.515 |
1.253 |
21.441 |
0.000 |
|
|
Open Mind |
OM1 |
We are not afraid of critically reflecting on the shared suppositions that we make about our clients. |
0.719 |
5.745 |
1.276 |
13.581 |
0.000 |
|
OM2 |
The members of this enterprise understand that the way in which they perceive the market should be continually questioned. |
0.795 |
5.068 |
1.463 |
22.121 |
0.000 |
|
|
OM3 |
Rarely do we collectively question our own bias regarding the way in which we interpret client information. (Excluded) |
- |
4.0 |
1.573 |
- |
- |
|
|
OM4 |
We continually judge the quality of our decisions and activities taken over time. |
0.769 |
5.455 |
1.295 |
19.5 |
0.000 |
|
|
Intra-organizational knowledge sharing |
IO1 |
It is a generous dose of organizational conversation that keeps the lessons learned from the past alive. |
0.793 |
5.2 |
1.501 |
32.492 |
0.000 |
|
IO2 |
We always analyze unsuccessful organizational enterprises and widely communicate the lessons learned. |
0.682 |
4.621 |
1.802 |
15.136 |
0.000 |
|
|
IO3 |
We have specific mechanisms to share the lessons learned, through organizational activities between departments. |
0.653 |
3.847 |
1.887 |
11.981 |
0.000 |
|
|
IO4 |
The leadership group repeatedly emphasizes the importance of knowledge sharing in our enterprise. |
0.752 |
5.634 |
1.459 |
18.621 |
0.000 |
|
|
IO5 |
We give little effort to sharing lessons and experiences. |
0.767 |
5.949 |
1.18 |
21.591 |
0.000 |
|
|
Client Performance |
CP1 |
We have been able to attract totally new clients this year. |
0.895 |
5.132 |
2.064 |
55.749 |
0.000 |
|
CP2 |
We have been able to expand our existing client base this year. |
0.917 |
4.885 |
2.075 |
66.72 |
0.000 |
|
|
CP3 |
We have been able to maintain our client base and obtain repeated orders. |
0.700 |
3.77 |
1.865 |
14.439 |
0.000 |
|
|
Development Performance |
DP1 |
The perspective of our organization is good. |
0.686 |
5.74 |
1.32 |
14.386 |
0.000 |
|
DP2 |
There is a high level of objective service satisfaction. |
0.600 |
5.677 |
1.247 |
9.724 |
0.000 |
|
|
DP3 |
Our employees are satisfied with our current business model. |
0.789 |
5.06 |
1.326 |
29.488 |
0.000 |
|
|
DP4 |
There is a high level of coordination among our employees. |
0.758 |
5.14 |
1.302 |
21.673 |
0.000 |
|
|
DP5 |
Our employees are satisfied with the organization. |
0.762 |
5.553 |
1.171 |
21.512 |
0.000 |
|
|
DP6 |
Our employees are satisfied with their participation in the organization. |
0.660 |
5.46 |
1.189 |
12.061 |
0.000 |
|
|
Economic Performance |
EP1 |
We are more effective at serving our beneficiaries than others. (Excluded) |
- |
4.16 |
1.527 |
- |
- |
|
EP2 |
Over the last few years, we have increased our effectiveness. |
0.866 |
5.821 |
1.412 |
41.429 |
0.000 |
|
|
EP3 |
We are more efficient at serving our beneficiaries than others. (Excluded) |
- |
4.25 |
1.588 |
- |
- |
|
|
EP4 |
Over the last few years, we have increased our efficiency. |
0.820 |
5.868 |
1.3 |
25.548 |
0.000 |
|
|
EP5 |
Over the last few years, our financial situation has improved. |
0.844 |
5.668 |
1.753 |
33.287 |
0.000 |
|
|
EP6 |
Our organization is financially sustainable. |
0.611 |
5.162 |
1.897 |
9.664 |
0.000 |
|