Organizations and Markets in Emerging Economies ISSN 2029-4581 eISSN 2345-0037
2023, vol. 14, no. 1(27), pp. 6–25 DOI: https://doi.org/10.15388/omee.2023.14.80
Assessment of Stock Market Liquidity and Efficiency: Evidence from an Emerging Country
Reema Monga
University School of Management and Entrepreneurship, Delhi Technological University, India
https://orcid.org/0000-0001-9619-0205
reemamonga23@gmail.com
Deepti Aggrawal (corresponding author)
University School of Management and Entrepreneurship, Delhi Technological University, India
https://orcid.org/0000-0003-1899-1570
deeptiaggrawal@dtu.ac.in
Jagvinder Singh
Department of Operational Research, University of Delhi, India
https://orcid.org/ 0000-0002-4558-5220
jagvinder.singh@gmail.com
Abstract. The study examines the market efficiency, multi-dimensions of liquidity, and their interconnectedness in the emerging Indian stock market. In contrast to the existing literature, the current study aims to fill the gap by testing market liquidity considering multi-dimensions such as depth, breadth, immediacy, tightness, and resilience. Second, the study used a battery of tests to determine efficiency, including the Ljung and Box, the runs test, the Bartels test, Variance Ratio, and the BDS tests. To the best of the authors’ knowledge, this is also the primary study to assess how market efficiency and liquidity are related in the Indian equity market. The results of the study show that during the pandemic, the Indian stock market was proven to be efficient, suggesting that there are no abnormal returns. Moreover, the research demonstrates that during the COVID-19 pandemic, large volumes of securities were traded quickly and at a lower price effect, but with higher trading costs for completing a market transaction. However, it is worth noting that increased liquidity equates to greater efficiency, while lower liquidity equates to inefficiency. The study has underlined the most significant implications for policymakers, market regulators, investors and other stakeholders who are monitoring the asset allocations and risk management.
Keywords: COVID-19, market liquidity, efficiency, Indian stock market, multi-dimensional approach, country lockdown
Received: 14/9/2022. Accepted: 17/2/2023
Copyright © 2023 Reema Monga, Deepti Aggrawal, Jagvinder Singh. Published by Vilnius University Press. This is an Open Access article distributed under the terms of the Creative Commons Attribution Licence, which permits unrestricted use, distribution, and reproduction in any medium, provided the original author and source are credited.
1. Introduction
Since the beginning of 2020, the ongoing COVID-19 pandemic has slowed the global and national economies (Goodell, 2020; Ozili & Arun, 2020; Chowdhury et al., 2021; Khan et al., 2021, Su et al., 2021). The novel coronavirus has triggered an infectious disease crisis worldwide, resulting in the loss of human lives and other tangible and financial losses. To limit the spread of the virus, governments around the world have implemented several containment measures, including workplace and school closures, public event cancellations, travel restrictions, home isolations, quarantines, social distancing, and mask wear (Hale et al., 2020; WHO, 2020). However, this endeavor has resulted in a substantial global economic downturn (Ashraf, 2020; Baker et al., 2020; Janiak et al., 2021). The entire economic climate and operational activities become depressed with the outbreak and the growth in COVID-19 cases over time. In particular, hysteria has disrupted the market by preventing customers and businesses from engaging in normal consumption patterns.
The initial wave of the COVID-19 pandemic (early 2020) sparked alarm and compelled the temporary closure of nearly all economies. However, various economies are particularly more vulnerable to the second wave of pandemic (early 2021). The first occurrence of infection in India was reported on January 30th, 2020, as a result of an overseas connection. Despite having the world’s second-largest population and inadequate health-care infrastructure, India had fared well in its initial struggle against COVID-19 compared to countries that are significantly more developed and equipped. However, the scenario is totally disastrous, and it had spread to become a terrifying pandemic during its second hit. The second wave of coronavirus was spreading like a tsunami, and COVID-19 cases in India had surpassed 15.9 million as of April 23rd, 2021, with 185,000 deaths. As a result, this invasion has resulted in a large number of afflicted people and, unfortunately, a high fatality rate.
Big events such as natural disasters, disease outbreaks, and political upheavals influence market conditions. With the onset of COVID-19, several studies have identified adverse stock reactions, surge in market volatility, higher systematic risk, and decreased market liquidity and stability (Al-Awadhi et al., 2020; Ashraf, 2020; Zhang et al., 2020; Baig et al., 2021). It is quite evident that investors are considered rational, fully informed, and base their investment decisions on publicly available information under normal circumstances. However, a crisis like COVID-19 can cause market overreaction, causing investors’ decision-making processes to be disrupted. During a worldwide shock, informational market efficiency is critical for investors and other market participants to make effective trading decisions and achieve profitable results. Furthermore, liquidity is an essential indicator of market health because a liquidity shortage can lead to a financial crisis (Munteanu, 2012) and market degradation (Amihud et al., 1990).
Financial research has long focused on the stock markets in the aftermath of previous extraordinary extreme occurrences and catastrophes, such as the SARS pandemic of 2002–2004, the global financial crisis of 2008, and the H1N1 virus (Dimitriou et al., 2013; Peckham, 2013; Chang et al., 2020; Shehzad et al., 2020). In line with the idea, the novel COVID-19 outbreak allows us to examine the two crucial dimensions, i.e., liquidity and efficiency, because these are the key policy areas that tend to be adverse in challenging market conditions, such as crises and pandemics. Brunnermeier and Pedersen (2009) argued that liquidity plays a vital role in market functioning during a financial crisis. Notably, a lack of market liquidity impairs the ability to execute purchase and sell transactions – potentially jeopardizing financial stability. Moreover, with the outbreak of the COVID-19 pandemic, the argument over the validity of informational market efficiency in financial markets has been reignited.
This research is essential for investors, market regulators, and policymakers to understand market liquidity and efficiency during intense turbulence like COVID-19. Furthermore, emerging markets have more information asymmetry and less liquidity (Hu & Prigent, 2019; Mdaghri et al., 2020; Yildiz, 2021). As a result, any unexpected global economic shock that strikes emerging economies creates uncertainty and has a detrimental influence on their financial markets (Tran et al., 2018).
We contribute to the literature in a number of different ways. First, as India is one of the most important components of emerging economies, this article examines the market efficiency of the Indian stock market during the pandemic. Second, several authors point out the limitations of using a single measure or proxy to assess liquidity, i. e., there is no consensus over the ideal metric for gauging liquidity. Therefore, we used the multi-faceted concept of liquidity, which encompasses five different multi-dimensions of liquidity: depth, breadth, immediacy, tightness, and resilience. Further, there is a paucity of research regarding the connectedness of market liquidity and efficiency, thus, in this study, the Efficient Market Hypothesis (EMH) is being tested on the returns of several stocks that have been sorted for market liquidity.
The remainder of this research is outlined as follows. The literature is examined in Section 2. Section 3 delves into the data and methodology. The empirical results are reported in Section 4. Section 5 concludes the paper. Finally, Section 6 presents the implications and future scope of research.
2. Review of Literature
Major events such as financial crises, pandemics, and natural catastrophes have been labeled as “black swan” events that have induced uncertainty in the financial markets (Burch et al., 2016; Ahmad et al., 2021; Antipova, 2021; Yarovaya et al., 2022). Global financial markets have been severely disrupted as the world deals with the enormous economic and social instability caused by COVID-19. To put in another way, the stock market has plummeted as a result of the economic slowdown caused by the COVID-19 outbreak (Topcu & Gulal, 2020; Chowdhury et al., 2021; Okorie & Lin, 2021; Sadiq et al., 2021; Bannigidadmath et al., 2022; Chopra & Mehta, 2022; Nguyen & Nguyen, 2022).
It is evident that the uncertainty surrounding the COVID-19 cases, in particular, could serve as a warning to the financial markets and their participants about the pandemic’s progression. Liu et al. (2020) investigated the impact of the Coronavirus outbreak on 21 major stock markets. They found that equity markets fell precipitously following the pandemic, with the negative impact being more significant in Asian countries than in other countries. Ozili and Arun (2020) investigated the impact of Covid-19 on the global economy. They found that efforts to control the virus resulted in the closure of corporate enterprises, business events, and global financial markets, which halted the economies. Given the severity of the pandemic, Firzli (2020) and IMF (2020b) marked this pandemic as “the Great Financial Crisis.” IMF (2020a) also stated that the COVID-19 put the entire world into the biggest crisis of the century, even worse than the 2007–2008 Financial Crisis.
Pandemics can cause extraordinary disruptions in the financial markets, affecting stock market’s liquidity, volatility, and returns (Baker et al., 2020; Mdaghri et al., 2020). With the commencement of the COVID-19 pandemic, financial markets have been influenced by panic and uncertainty, which has been mirrored in global equity markets (Khan et al., 2020; Berberet al., 2021). Baker et al. (2020) concluded that stock market volatility in the US peaked at its greatest level in history due to the outbreak. Zaremba et al. (2020) found that COVID-19 has affected the financial market and resulted in aberrant trading behavior, and destabilizing most of the financial markets. Mdaghri et al. (2020) reported that the pandemic has reduced stock market liquidity in the MENA region in terms of depth and tightness dimensions. Dev and Sengupta (2020) investigated the impact of Covid-19 on the Indian economy, concluding that the economy decelerated due to the nationwide lockdown, global economic crisis, and concomitant disruption of demand and supply networks.
Ozkan (2020) examined the impact of COVID-19 on the efficiency of six developed countries: the United States, the United Kingdom, Spain, France, Italy, and Germany, using a wild bootstrap automated variance-ratio and the automatic portmanteau test. The author found that during the COVID-19 pandemic, markets became more inefficient, implying a higher likelihood of predictability and abnormal returns. Baig et al. (2021) concluded that the COVID-19-related lockout impairs the stability and liquidity of the US stock market. Vasileiou (2021) investigated the efficiency of the US stock market and found that the market was inefficient during the pandemic. The Coronovirus Fear Index was also employed in the study, which demonstrated that fear had a detrimental impact on the performance of the US stock market. Nguyen et al. (2021) looked at the influence of the COVID-19 pandemic on the stock returns and liquidity of the financial services industry in Vietnam. They discovered that as the COVID-19 scenario worsens, stock returns and market liquidity suffer significantly. Using the automatic variance ratio and portmanteau test, Bhatia (2022) looked into how the pandemic affected the efficiency of the Indian stock market. The author came to the conclusion that the Indian stock market displayed a divergence from market efficiency, suggesting anomalous gains. Monga et al. (2021, 2022) tested different factor based and optimization based investment strategies in the emerging Indian equity market and found evidence of better risk-adjusted performance and diversification.
Despite several studies on the influence of COVID-19 on various economies, geographies, and sectors, research on emerging equity markets remains scarce. Also, the related literature covers areas like return; volatility; proxies of liquidity such as depth and immediacy. However, this study addresses the gap by examining multi-dimensions of stock market liquidity: depth, breadth, immediacy, tightness, and resilience in the emerging Indian equity market. This research further emphasizes the role of liquidity as an important consideration for market efficiency. In other words, adequate liquidity may be a critical condition for the Efficient Market Hypothesis; thus, our study comprises testing the linkage between market liquidity and efficiency. Finally, our findings add to current research on the market efficiency during the COVID-19 pandemic.
3. Data and Methodology
For this study, we chose 500 stocks from the NIFTY 500 index of the NSE (National Stock Exchange) of India. However, we used a dataset of 485 stocks available during the study period of January 30th, 2020–December 28th, 2021. This time span encompasses both when India first reported a COVID-19 case and when cases began to decline amid the devastating second wave of the pandemic. All the daily data on closing share prices, the number of shares outstanding, trading volume, bid and ask prices were retrieved from Bloomberg. The daily return for the stock is calculated as follows:
Rt = lnPt – lnPt–1 (1)
where Rt is the daily stock return at time t; lnPt and lnPt–1 are the natural logarithm of the closing price at time t and t – 1 respectively.
3.1 Framework of the Study
Figure 1
Model for Testing Market Liquidity and Efficiency
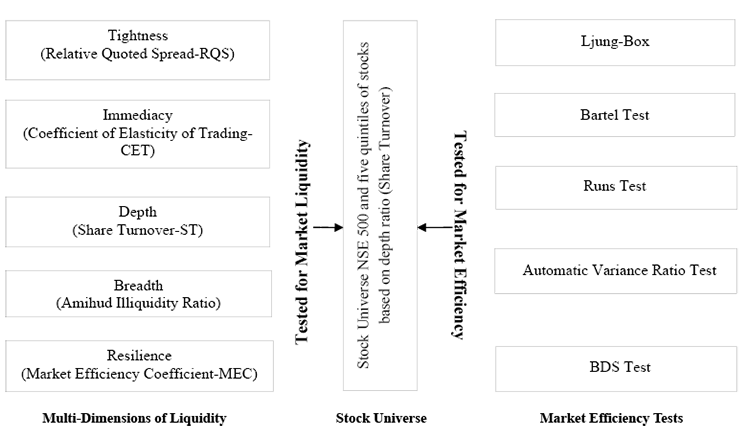
3.2 Multi-dimensions of Liquidity
The nature of market liquidity has been conceptualized variably in the literature (Sarr & Lybek, 2002; Bhattacharyaet al., 2019; Diaz & Escribano, 2020; Naik et al., 2020; Naik & Reddy, 2021; Le & Gregoriou, 2020), and hence measuring market liquidity accurately was a difficult issue for previous studies. It is observed from the previous literature that there is no consensus to quantify liquidity, and as a result, various authors employed different measures for the same. Therefore, given the heterogeneous characteristics of market liquidity, we used a multi-dimensional approach proposed by Sarr and Lybek (2002) to measure market liquidity, which encompasses the five dimensions: depth, tightness, immediacy, breadth, and resilience. The proxies to represent various dimensions are listed below.
Tightness: It is a characteristic of transaction costs that is represented by the difference in ask and bid prices. To accomplish so, we used the Closing Percent Quoted Spread (CPQS), which was developed by Chung and Zhang (2014). It is calculated using daily closing bid-ask prices and is recognized as the most widely utilized proxy measure for the effective bid-ask spread by previous studies (Fong et al., 2017; Diaz & Escribano, 2020; Le & Gregoriou, 2020; Naik et al., 2020).
 (2)
(2)
Immediacy: It refers to the simplicity and speed with which the process of trade can be well-accomplished and settled (Tripathi et al., 2019). It displays the settlement structure, coherence of trading systems, and the speed at which orders are executed. In other words, it relates to the amount of time both parties will need to complete the stated quantity of a security at the agreed-upon price.
To quantify market immediacy, Wanzala (2018) and Naik et al. (2020) used the Coefficient of Elasticity of Trading (COE), which accurately portrays the speed with which a trade is executed. The following formula is used to calculate it:
 (3)
(3)
where, %ΔT and %ΔP represent the percentage changes in daily trading volume, and closing price, respectively.
Depth: It demonstrates the market’s ability to accommodate a vast number of orders to maintain stock price equilibrium. In this approach, the number of stocks traded in the entire market is critical for the survival of a deeper market (Naik et al., 2020). It is calculated using Equation 4:
 (4)
(4)
where, VOt and SOt represents the volume of stocks and shares outstanding at time t, respectively.
Breadth: It refers to the capacity of the market to seamlessly facilitate the trading of a certain amount of securities without significantly impacting their share prices. In analyzing the dimension of breadth, we utilize the Amihud Illiquidity Ratio, which was proposed by Amihud (2002) and was considered the best price impact metric by earlier studies (Diaz & Escribano, 2020; Le & Gregoriou, 2020; Naik et al., 2020). This ratio shows how the price of a security changes when its volume changes. It is calculated as follows:
 (5)
(5)
where Rit stands for absolute return on day t for stock i, and Volit represents Volume value.
Resilience: It is a market characteristic in which new trade orders flow quickly to fix trading imbalances, and prices tend to revert to intrinsic value. Hasbrouck and Schwartz (1988) suggested the Market Efficiency Coefficient (MEC) as a way to discern short-term price changes from long-term price changes, i. e., the variances of two returns with distinct time duration. Following Sarr and Lybek (2002) and Bhattacharyaet al. (2019), we considered five day-returns as a longer period and daily returns as a short term, and thus T equals 5 for our study. In efficient liquid markets, the statistic is close to one, but large deviations from one indicate a lack of liquidity. The following formula is used to compute MEC:
 (6)
(6)
where T stands for the number of short periods within each longer period.
3.3 Testing of Efficient Market Hypotheses
The study of EMH, as proposed by Fama (1970), is a critical concept in finance. An efficient market is one in which asset values are not predictable since the prices already represent the information and quickly respond to any new information.
In the current study, the analysis of EMH has been carried out with a battery of tests (Urquhart, 2016) including the Ljung and Box test, runs test, the Bartels test, the Variance ratio test, and the BDS test.
The weak-form efficiency has been examined using two hypotheses, which are as follows:
H0: Return series follows a random walk, i. e., market is weak-form efficient.
H1: Return series does not follow a random walk, i. e., market is weak-form inefficient.
The autocorrelation test is a useful and accurate tool for determining the independence of a set of random variables, with a null hypothesis of no correlation (p = 0). Statistically, positive autocorrelation is indicated by p > 0, and negative autocorrelation is shown by p < 0. If autocorrelation exists, returns are influenced by their preceding values. However, when the returns are independent, the series shows no signs of autocorrelation, signaling that the time series follows a random walk process. We use the Ljung-Box (Ljung & Box, 1978) test to look at the autocorrelation of returns:
 (7)
(7)
where  indicates the autocorrelation of order k, k is the number of lags, and n denotes the sample size.
Second, the runs test is employed as a non-parametric technique for determining the randomness of time series, particularly those that are not normally distributed. The test looks to see if the direction of one observation impacts subsequent observations. The idea behind this test is that if the time series is randomly fluctuating and independent, the number of actual runs in the series should be identical to the expected number of runs. The following formula is used to compute the number of expected runs:
 (8)
(8)
where P represents positive runs and N indicates negative runs.
The variance is computed as follows:
 (9)
(9)
Furthermore, to determine the randomness of the series, the third test is the Bartels (1982) test, which is a rank variant of von Neumann’s Ratio Test for Randomness. This non-parametric test is equivalent to the Run test but is considered to be more effective. It uses independence as the null hypothesis, i.e., determining whether returns are independent. If the null hypothesis is rejected in any of these tests, it is likely that stock returns can be forecast using historical data, which would indicate that weak-form market efficiency is not being followed.
In addition to the tests listed above, the Variance Ratio (VR) Test, created by Lo and Mackinlay (1988), is the most often used econometric instrument to evaluate the random walk hypothesis. It is a common approach for examining serial independence with the null hypothesis of random walk or martingale, i.e., the returns is serially uncorrelated. To implement the VR test, we utilize the Choi (1999) automatic variance test (AVR) in conjunction with wild bootstrap Kim (2009) to improve the small sample properties.
 (10)
(10)
where k represents the holding period, pj denotes the autocorrelation of return in order j.
Next, we employed the BDS test for serial dependence, which is one of the most prominent and extensively used non-parametric tests (Brock et al., 1996). The null hypothesis asserts that data generation mechanisms are “independent and uniformly distributed,” whereas the alternative hypothesis holds that “the model is unspecified.” Following Lim (2013) and Urquhart (2016), we chose embedding dimension (m) ranging from 2 to 5, and ε/σ is 1, i.e., 1 times the standard deviation of the returns.
 (11)
(11)
where Wm,n(ε) is the BDS statistics, n is the sample size, m is the embedding dimension, and (ε) is the metric bound, the largest difference between the observation pairs considered while calculating the correlation integral.
Thereafter, our study involves examining the connectedness of market liquidity and efficiency, i.e., the Efficient Market Hypothesis (EMH) is being tested on the returns of several stocks that have been sorted for market liquidity. The tests used to examine market efficiency closely follow those of Urquhart (2016) and Wei (2018).
Firstly, we followed the methodology based on the work of Naik et al. (2020) to divide the stock universe into five quintiles based on the Depth ratio, with the 1st Quintile (upper quintile) being the most liquid and the 5th Quintile (lower quintile) being the least liquid. This procedure is used to evaluate how closely liquidity and efficiency are related. Additionally, the weak-form of efficiency is examined for five different quintiles that are classified by depth ratio in order to ascertain the linkage between liquidity and efficiency. We closely follow Wei (2018) for a set of statistical tests for randomness and note the quintile-based p-values for each of the efficiency tests for the five stock groups arranged by liquidity.
During the sample period, each quintile included a total of 97 stocks, with each quintile allowed to vary based on the yearly rankings of their share turnover (ST) ratio. To compute aggregate market liquidity, we converted daily stock-specific data into cross-sectional averages that were weighted depending on the daily market capitalization of the stocks. These daily averages of liquidity metrics were converted to natural log values to eliminate outliers. Finally, the aggregate market liquidity results were calculated using these log values.
4. Analysis of Findings and Discussion
Table 1 shows the return statistics for the entire sample and for the different quintiles, which are divided into five groups depending on the Depth ratio, with group 1 being the most liquid and group 5 being the least liquid. The results indicate that, on average, the stock market had positive returns based on the entire sample period and the quintiles. Notably, the findings also imply an illiquidity premium, as indicated by the highest mean return for the 5th quintile, signifying that equity investors must expect a premium to retain illiquid stocks. However, considering the standard deviation, the 5th quintile has the most extensive volatility, while the 1st quintile has the lowest. This is in line with the premise that pricing efficiency is higher in liquid markets with more active traders, resulting in lower volatility.
Table 1
Descriptive Statistics of Returns Sorted by Liquidity
|
Sort by Liquidity |
Return Characteristics |
||||||||
|
|
Group |
Depth |
Mean |
Median |
Maximum |
Minimum |
SD |
Skewness |
Kurtosis |
|
|
Full Sample |
- |
0.0012 |
0.0036 |
0.0705 |
-0.1287 |
0.0163 |
-2.1049 |
18.3768 |
|
High liquidity |
1st Quintile |
0.0111 |
0.0014 |
0.0043 |
0.0719 |
0.1762 |
0.0140 |
-2.2705 |
17.0161 |
|
2nd Quintile |
0.0048 |
0.0013 |
0.0041 |
0.0834 |
-0.1445 |
0.0149 |
-1.8239 |
15.9930 |
|
|
Low Liquidity |
3rd Quintile |
0.0026 |
0.0011 |
0.0026 |
0.0689 |
-0.1239 |
0.0171 |
-1.6190 |
15.0737 |
|
4th Quintile |
0.0017 |
0.0008 |
0.0021 |
0.0818 |
-0.1255 |
0.0189 |
-1.7279 |
22.4100 |
|
|
5th Quintile |
0.0009 |
0.0015 |
0.0025 |
0.0541 |
-0.0914 |
0.0220 |
-1.5877 |
12.6931 |
|
Table 2 summarizes the descriptive statistics for the liquidity measurements. Compared to other measures, the log mean values show that CET is greater and AR is lower, indicating that huge volumes of securities may be traded quickly and at a lower price effect. It further shows that the high log mean value of MEC indicates that order imbalances are better corrected throughout the outbreak. Next, in terms of market depth, the value of ST indicates that the market is deeper, implying that market has a significant number of orders to keep price equilibrium. Furthermore, it is notable that RQS is higher than ST and AR, indicating higher trading costs for completing a market transaction. In other words, the findings demonstrate that the market is less tight during COVID-19, implying that trading is more expensive during the pandemic.
Table 2
Descriptive Statistics for Liquidity Measures for the Full Sample
|
|
AR |
ST |
CET |
ROS |
MEC |
|
Mean |
-7.154 |
-5.618 |
4.526 |
-3.386 |
-0.400 |
|
Median |
-7.227 |
-5.606 |
4.495 |
-3.468 |
-0.399 |
|
Maximum |
-5.098 |
-4.737 |
7.434 |
-1.589 |
-0.027 |
|
Minimum |
-8.001 |
-7.534 |
1.601 |
-4.253 |
-0.891 |
|
Std. Dev. |
0.388 |
0.227 |
0.660 |
0.324 |
0.139 |
|
Skewness |
1.695 |
-1.620 |
0.295 |
1.861 |
-0.289 |
|
Kurtosis |
7.202 |
17.760 |
5.858 |
8.219 |
3.760 |
Table 3 shows that the upper and lower quintile groups have a substantial gap in share turnover (almost 56 percent). Furthermore, AR is smaller in the upper quintile (most liquid), meaning that heavily traded equities have less price influence due to their trading consistency. Notably, the MEC for the top quintiles is particularly high, implying a better correction of order imbalances for highly traded stocks. Furthermore, the upper quintile has a greater CET, indicating a speedy flow of order transactions. Unlike other indicators, the dimension of tightness suggests that stocks in the lower quintile have lower spreads (as measured by RQS) than those in the upper quintile. This means that trading in low-volume equities is less expensive during the pandemic than trading in high-volume ones.
Table 3
Descriptive Statistics for Liquidity Measures for the Quintiles
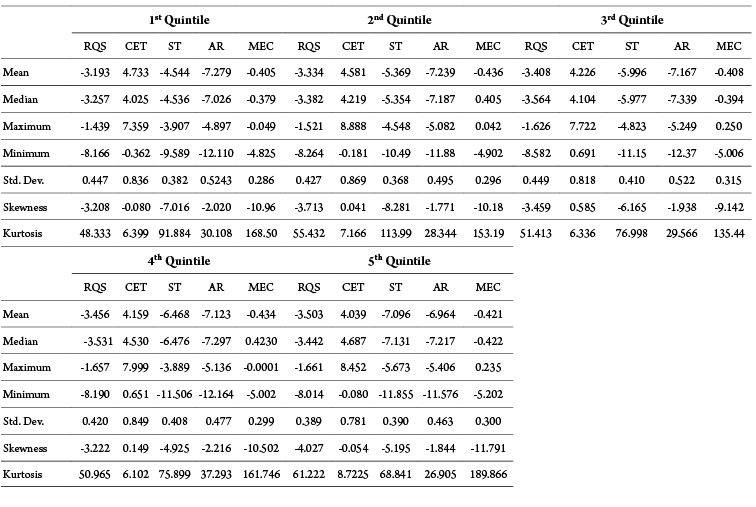
Table 4 displays the efficiency results for the entire sample and five different quintiles. Except for non linear BDS testing, all tests show a sign of efficiency for the entire sample. This indicates that the market does not support return projection, implying that there is lack of possibility of earning abnormal profits during the pandemic. Further, considering the results of quintiles, the p-values of the lowest quintile (with the least liquidity) reject the null hypothesis of randomness in all tests at a 5% significance level. To put it another way, the quintiles with the least liquidity diverge the most from market efficiency. However, higher liquidity quintiles exhibit higher average p-values, showing that high-liquid markets are more efficient. The findings are noteworthy because they suggest a linkage between market liquidity and market efficiency, signaling that stronger liquidity is associated with greater efficiency.
Table 4
Results for Weak-Form of Market Efficiency Sorted by Liquidity
|
Sort by Liquidity |
p- values |
||||||
|
|
Group |
Depth |
Ljung-Box |
Bartels test |
Runs test |
AVR |
BDS |
|
|
Full Sample |
- |
0.118 |
0.129 |
0.103 |
0.45 |
0.0163* |
|
High liquidity |
1st Quintile |
0.011 |
0.871 |
0.74 |
0.103 |
0.846 |
0.022* |
|
2nd Quintile |
0.005 |
0.128 |
0.139 |
0.09 |
0.41 |
0.018* |
|
|
Low Liquidity |
3rd Quintile |
0.003 |
0.043* |
0.057* |
0.058* |
0.031* |
0.017* |
|
4th Quintile |
0.002 |
0.024* |
0.044* |
0.046* |
0.048* |
0.015* |
|
|
5th Quintile |
0.001 |
0.017* |
0.015* |
0.035* |
0.021* |
0.014* |
|
Note. * denotes significance at a 5% level.
Throughout human history, epidemic diseases have had catastrophic social consequences (deaths of millions of people) and tremendous economic and financial consequences. Compared to the previous pandemics, COVID-19 has a massive effect on global economies (Baker et al., 2020; Jorda, 2020; Ma et al., 2021). It is apparent that most of the world’s stock markets have been affected by COVID-19, and among all, India is one of the countries afflicted by the pandemic. Considering this, the research intends to evaluate the two crucial dimensions, i.e., market liquidity and efficiency in the emerging Indian stock market. We looked at market liquidity from multiple perspectives, including depth, immediacy, breadth, tightness, and resilience. The findings of the study indicate that the Indian stock market has been efficient during the pandemic, suggesting that there are no abnormal returns. The study also shows that large amounts of securities can be swiftly traded with a minimal price effect despite increasing trading costs required to execute a market transaction. Finally, it is important to note that increased liquidity equates to greater efficiency, whereas lower liquidity is associated with inefficiency.
The research also tested the market efficiency using a list of tests including the Ljung and Box, the runs test, the Bartels test, the Variance ratio test, and the BDS test. The results show that over the study period, the emerging Indian stock market supported the EMH, suggesting that returns are unpredictable. Also, it was worth checking the linkage with liquidity and efficiency for such analysis, five stock quintiles were formed with 1st Quintile (upper quintile) being the most liquid and the 5th Quintile (lower quintile) being the least liquid. The findings demonstrate that the higher liquidity quintiles exhibit efficiency, showing that high-liquid markets are more efficient. Overall, the study suggests a linkage between market liquidity and market efficiency, implying that higher liquidity is associated with greater market efficiency.
5. Conclusion
The COVID-19 pandemic is the ideal test scenario for assessing key components of the stock market as these unfolding events were completely unknown to participants in the financial market. Particularly, the rapid spread of the COVID-19 pandemic has had an unfathomable impact on the worldwide community, culminating in devastating economic and human costs. We contribute to the literature by looking at multi-dimensions of market liquidity and market efficiency over the evaluation period from January 30th, 2020 to December 28th, 2021. The findings show that the market is less tight during the pandemic, as seen by higher trading costs for executing a market transaction. Also, as indicated by CET and AR, there is a high degree of immediacy and a lower price impact, implying that large volumes of securities are traded quickly with a lower price effect.
The study also investigated multi-dimensions of liquidity for various quintiles based on the criteria of market depth. According to the findings, the top quintile with a deeper market has more RQS than the bottom quintile, implying that high liquidity equities are more expensive to trade. Considering the dimension of market breadth, AR is smaller in the top quintile, meaning that actively traded equities have less price influence due to their trading consistency. The MEC for the top quintiles is very high, showing that high-liquid equities handle order imbalances better than low-liquid stocks. Empirically, the upper quintile has a greater CET, indicating a speedy flow of trading orders.
Using five tests— the Ljung and Box, runs tests, the Bartels test, the Variance ratio test, and BDS— the study also examined the market efficiency during the COVID-19 outbreak. The findings reveal that the weak-form of efficiency is supported by the emerging Indian stock market across the whole sample period, implying that returns are unpredictable. Previous research has shown that there are no definitive findings on the interconnectedness of market liquidity and efficiency (Cajueiro & Tabak, 2004; Bariviera, 2011). Therefore, we used the approach of five different quintiles based on market depth to evaluate the linkage between these two dimensions. According to the analysis, higher liquidity quintiles exhibit efficiency, showing that high-liquid markets are more efficient. However, it is worth noting that increased liquidity associates with greater efficiency, while lower liquidity is linked to inefficiency.
6. Implications and Future Scope of Research
COVID-19 is a worldwide pandemic that is affecting both developed and developing nations. To the best of our knowledge, this is one of the early initiatives to investigate the stock market efficiency, liquidity and their interconnectedness during the COVID times. Notably, a shortage of market liquidity limits the ability to undertake buy-and-sell transactions, putting financial stability at risk. Furthermore, the debate over the validity of informational market efficiency in financial markets has been revived with the onset of the COVID-19 pandemic. As a result, analyzing these dimensions is critical for regulatory authorities and market players, particularly during crises and pandemics.
Given the severity of the pandemic, the study has highlighted the most significant implications for policymakers, investors, market regulators, and other stakeholders who are monitoring the asset allocations and risk management during the outbreak. The findings of the study suggest that the Indian stock market has higher trading costs during the COVID-19, implying that trading is more expensive. Furthermore, the results supported that the market is efficient, i.e., no exploitable trading opportunities exist, and thus, there is a lack of possibility of earning abnormal profits. Lastly, the study provides empirical evidence that the liquidity and efficiency are linked, i. e., greater liquidity resulting in higher market efficiency.
The findings of the study could be useful for both academicians as well as managers of corporate houses. The results can help the academicians to understand the stock market’s response to the pandemic (Covid-19 in this case). The study can also serve as a base for future researchers to determine the numerous elements that need to be addressed in the event of a global issue or pandemic, which will enable better handling of such circumstances. The outcome of the study will be helpful to the market players as well since they could take necessary strategic decisions and adapt to the changes in the market. They may also take measures to reduce the risk or uncertainties prevalent in the stock market owing to these pandemic and other challenges that may occur in the future. Furthermore, these insights are also critical for other market stakeholders since they actively participate in the market and therefore better comprehend the market’s situation during such catastrophic events.
Further research could focus on a time-varying approach to market efficiency, particularly during the catastrophic events. Testing the efficiency and multi-dimensions of liquidity in other asset classes and among different emerging economies could be another area of investigation.
Declaration of Conflicting Interests
The Authors declare that there is no conflict of interest.
References
Ahmad, W., Kutan, A. M., & Gupta, S. (2021). Black swan events and COVID-19 outbreak: Sector level evidence from the US, UK, and European stock markets. International Review of Economics & Finance, 75, 546–557. https://doi.org/10.1016/j.iref.2021.04.007
Al-Awadhi, A. M., Alsaifi, K., Al-Awadhi, A., & Alhammadi, S. (2020). Death and contagious infectious diseases: Impact of the COVID-19 virus on stock market returns. Journal of Behavioral and Experimental Finance, 27, 100326. https://doi.org/10.1016/j.jbef.2020.100326
Amihud, Y. (2002). Illiquidity and Stock Returns: Cross-Section and Time-Series Effects. Journal of Financial Markets, 5(1), 31–56. https://doi.org/10.1016/S1386-4181(01)00024-6
Amihud, Y., Mendelson, H., & Wood, R. (1990). Liquidity and the 1987 stock market crash. Journal of Portfolio Management, 16(3), 65–69. https://doi.org/10.3905/jpm.1990.409268
Antipova, T. (2020). Coronavirus Pandemic as Black Swan Event. In T. Antipova (Ed.), Integrated Science in Digital Age 2020, ICIS 2020 (pp. 356–366). Springer, Cham. https://doi.org/10.1007/978-3-030-49264-9_32
Ashraf, B. N. (2020). Stock markets’ reaction to COVID-19: Cases or fatalities?. Research in International Business and Finance, 54, 101249. https://doi.org/10.1016/j.ribaf.2020.101249
Baig, A. S., Butt, H. A., Haroon, O., & Rizvi, S. A. R. (2021). Deaths, panic, lockdowns and US equity markets: The case of COVID-19 pandemic. Finance Research Letters, 38, 101701. https://doi.org/10.1016/j.frl.2020.101701
Baker, S. R., Bloom, N., Davis, S. J., Kost, K., Sammon, M., & Viratyosin, T. (2020). The Uprecedented Stock Market Reaction to COVID-19. The Review of Asset Pricing Studies, 10(4), 742–758. https://doi.org/10.1093/rapstu/raaa008
Bannigidadmath, D., Narayan, P. K., Phan, D. H. B., & Gong, Q. (2022). How stock markets reacted to COVID-19? Evidence from 25 countries. Finance Research Letters, 45, 102161. https://doi.org/10.1016/j.frl.2021.102161
Bariviera, A. F. (2011). The influence of liquidity on informational efficiency: The case of the Thai Stock Market. Physica A: Statistical Mechanics and its Applications, 390 (23–24), 4426–4432. https://doi.org/10.1016/j.physa.2011.07.032
Bartels, R. (1982). The Rank Version of von Neumann’s Ratio Test for Randomness. Journal of the American Statistical Association, 77(377), 40–46. https://doi.org/10.2307/2287767
Berber, E., Sumbria, D., & Çanakoğlu, N. (2021). Meta-analysis and comprehensive study of coronavirus outbreaks: SARS, MERS and COVID-19. Journal of Infection and Public Health, 14(8), 1051–1064. https://doi.org/10.1016/j.jiph.2021.06.007
Bhatia, M. (2022). Stock Market Efficiency and COVID-19 with Multiple Structural Breaks: Evidence from India. Global Business Review, 0(0).https://doi.org/10.1177/09721509221110372
Bhattacharya, S. N., Bhattacharya, M., & Basu, S. (2019). Stock market and its liquidity: Evidence from ARDL bound testing approach in the Indian context. Cogent Economics & Finance, 7(1), 1586297. https://doi.org/10.1080/23322039.2019.1586297
Broock, W. A., Scheinkman, J. A., Dechert, W. D., & LeBaron, B. (1996). A test for independence based on the correlation dimension. Econometric Reviews, 15(3), 197–235. https://doi.org/10.1080/07474939608800353
Brunnermeier, M. K., & Pedersen, L. H. (2009). Market Liquidity and Funding Liquidity. The Review of Financial Studies, 22(6), 2201–2238. https://doi.org/10.1093/rfs/hhn098
Burch, T. R., Emery, D. R., &Fuerst, M. E. (2016). Who Moves Markets in a Sudden Marketwide Crisis? Evidence from 9/11. Journal of Financial and Quantitative Analysis, 51(2), 463–487. https://doi.org/10.1017/S0022109016000211
Cajueiro, D. O., & Tabak, B. M. (2004). Ranking efficiency for emerging markets. Chaos, Solitons & Fractals, 22(2), 349–352. https://doi.org/10.1016/j.chaos.2004.02.005
Chang, C. L., McAleer, M., & Wang, Y. A. (2020). Herding behaviour in energy stock markets during the Global Financial Crisis, SARS, and ongoing COVID-19. Renewable and Sustainable Energy Reviews, 134, 110349. https://doi.org/10.1016/j.rser.2020.110349
Choi, I. (1999). Testing the Random Walk Hypothesis for Real Exchange Rates. Journal of Applied Econometrics, 14(3), 293–308. https://doi.org/10.1002/(SICI)1099-1255(199905/06)14:3<293::AID-JAE503>3.0.CO;2-5
Chopra, M., & Mehta, C. (2022). Is the COVID-19 pandemic more contagious for the Asian stock markets? A comparison with the Asian financial, the US subprime and the Eurozone debt crisis. Journal of Asian Economics, 101450. https://doi.org/10.1016/j.asieco.2022.101450
Chowdhury, E. K., Khan, I. I., & Dhar, B. K. (2021). Catastrophic impact of Covid-19 on the global stock markets and economic activities. Business and Society Review, 127(3). https://doi.org/10.1111/basr.12219
Chung, K. H., &Zhang, H. (2014). A simple approximation of intraday spreads using daily data. Journal of Financial Markets, 17(C), 94–120. https://doi.org/10.1016/j.finmar.2013.02.004
Dev, S. M., & Sengupta, R. (2020). Covid-19: Impact on the Indian economy. (Indira Gandhi Institute of Development Research, Mumbai Working Papers 2020-13). https://ideas.repec.org/p/ind/igiwpp/2020-013.html
Díaz, A., & Escribano, A. (2020). Measuring the multi-faceted dimension of liquidity in financial markets: A literature review. Research in International Business and Finance, 51, 101079. https://doi.org/10.1016/j.ribaf.2019.101079
Dimitriou, D., Kenourgios, D., & Simos, T. (2013). Global financial crisis and emerging stock market contagion: A multivariate FIAPARCH–DCC approach. International Review of Financial Analysis, 30, 46–56. https://doi.org/10.1016/j.irfa.2013.05.008
Fama, E. F. (1970). Efficient Capital Markets: A Review of Theory and Empirical Work. The Journal of Finance, 25(2), 383–417.https://doi.org/10.2307/2325486
Firzli, M. N. (2020). Financial Market impact of the COVID-19 pandemic. https://en.wikipedia.org/wiki/Financial_market_impact_of_the_COVID-19_pandemic
Fong, K. Y., Holden, C. W., &Trzcinka, C. A. (2017). What Are the Best Liquidity Proxies for Global Research?. Review of Finance, 21(4), 1355–1401. https://doi.org/10.1093/rof/rfx003
Goodell, J. W. (2020). COVID-19 and finance: Agendas for future research. Finance Research Letters, 35, 101512. https://doi.org/10.1016/j.frl.2020.101512
Hale, T., Angrist, N., Kira, B., Petherick, A., Phillips, T., & Webster, S. (2020). Variation in Government Responses to COVID-19. (Working Paper BSG-WP-2020/032).https://www.bsg.ox.ac.uk/research/publications/variation-government-responses-covid-19.
Hasbrouck, J., & Schwartz, R. A. (1988). Liquidity and execution costs in equity markets. Journal of Portfolio Management, 14(3), 10–16. https://doi.org/10.3905/jpm.1988.409160
Hu, Y., & Prigent, J. L. (2019). Information asymmetry, cluster trading, and market efficiency: Evidence from the Chinese stock market. Economic Modelling, 80, 11–22. https://doi.org/10.1016/j.econmod.2018.04.001
International Monetary Fund (IMF). (2020a, March 23). IMF managing director Kristalina Georgieva’s statement following a G20 ministerial call on the coronavirus emergency [Press Release No. 20/98]. https://www.imf.org/en/News/Articles/2020/03/23/pr2098-imf-managing-director-statement-following-a-g20-ministerial-call-on-the-coronavirus-emergency
IMF. (2020b, June 20). A Crisis Like No Other, An Uncertain Recovery. World Economic Outlook Update. https://www.imf.org/en/Publications/WEO/Issues/2020/06/24/WEOUpdateJune2020
Janiak, A., Machado, C., & Turén, J. (2021). Covid-19 contagion, economic activity and business reopening protocols. Journal of Economic Behavior &Organization, 182, 264–284. https://www.sciencedirect.com/science/article/pii/S1544612321002269#bib0020
Jordà, Ò., Singh, S. R., & Taylor, A. M. (2020). Longer-Run Economic Consequences of Pandemics (NBER working paper No. 26934). National Bureau of Economic Research. https://doi.org/10.3386/w26934
Khan, A., Khan, N., & Shafiq, M. (2021). The Economic Impact of COVID-19 from a Global Perspective. Contemporary Economics, 15(1), 64–76. https://go.gale.com/ps/i.do?id=GALE%7CA653470027&sid=googleScholar&v=2.1&it=r&linkaccess=abs&issn=20840845&p=AONE&sw=w&userGroupName=anon%7E86a28113
Khan, K., Zhao, H., Zhang, H., Yang, H., Shah, M. H., & Jahanger, A. (2020). The Impact of COVID-19 Pandemic on Stock Markets: An Empirical Analysis of World Major Stock Indices. The Journal of Asian Finance, Economics, and Business, 7(7), 463–474. https://doi.org/10.13106/jafeb.2020.vol7.no7.463
Kim, J. H. (2009). Automatic variance ratio test under conditional heteroskedasticity. Finance Research Letters, 6(3), 179–185. https://doi.org/10.1016/j.frl.2009.04.003
Le, H., & Gregoriou, A. (2020). How do you Capture Liquidity? A Review of the Literature on Low‐Frequency Stock Liquidity. Journal of Economic Surveys, 34(5), 1170–1186. https://doi.org/10.1111/joes.12385
Lim, K. P., & Hooy, C. W. (2013). Non‐Linear Predictability in G7 Stock Index Returns. The Manchester School, 81(4), 620–637. https://doi.org/10.1111/j.1467-9957.2012.02303.x
Liu, H., Manzoor, A., Wang, C., Zhang, L., & Manzoor, Z. (2020). The COVID-19 Outbreak and Affected Countries Stock Markets Response. International Journal of Environmental Research and Public Health, 17(8), 2800. https://doi.org/10.3390/ijerph17082800
Ljung, G. M., & Box, G. E. (1978). On a Measure of Lack of Fit in Time Series Models. Biometrika, 65(2), 297–303.https://doi.org/10.1093/biomet/65.2.297
Lo, A. W., & MacKinlay, A. C. (1988). Stock market prices do not follow random walks: Evidence from a simple specification test. The Review of Financial Studies, 1(1), 41–66. https://doi.org/10.103/rfs/1.1.41
Ma, C., Rogers, J. H., & Zhou, S. (2021). Modern Pandemics: Recession and Recovery. Available at SSRN: https://dx.doi.org/10.2139/ssrn.3565646
Mdaghri, A. A., Raghibi, A., Thanh, C. N., &Oubdi, L. (2020). Stock market liquidity, the great lockdown and the COVID-19 global pandemic nexus in MENA countries. Review of Behavioral Finance, 13(1), 51–68. https://doi.org/10.1108/RBF-06-2020-0132
Monga, R., Aggrawal, D., & Singh, J. (2021). Exploring new frontiers in indexing strategies: an optimization-based risk-efficient solution. International Journal of System Assurance Engineering and Management, 1–13. https://doi.org/10.1007/s13198-021-01138-3
Monga, R., Aggrawal, D., & Singh, J. (2022). Smart Beta Investing: An Alternative Investment Paradigm in Emerging Indian Equity Market. Organizations and Markets in Emerging Economies, 13(1), 209–237.https://doi.org/10.15388/omee.2022.13.77
Munteanu, I. (2012). Bank Liquidity and its Determinants in Romania. Procedia Economics and Finance, 3, 993–998. https://doi.org/10.1016/S2212-5671(12)00263-8
Naik, P., Poornima, B. G., & Reddy, Y. V. (2020). Measuring liquidity in Indian stock market: A dimensional perspective. PloSOne, 15(9), e0238718. https://doi.org/10.1371/journal.pone.0238718
Naik, P., & Reddy, Y. V. (2021). Stock Market Liquidity: A Literature Review. Sage Open, 11(1), 2158244020985529. https://doi.org/10.1177/2158244020985529
Nguyen, C. T., Hai, P. T., & Nguyen, H. K. (2021). Stock market returns and liquidity during the COVID-19 outbreak: evidence from the financial services sector in Vietnam. Asian Journal of Economics and Banking,5(3), 324-342. https://doi.org/10.1108/AJEB-06-2021-0070
Nguyen, V. C., & Nguyen, T. T. (2022). The Effect of Covid 19 Pandemic on the Financial Market’s Performance: Evidence from Top ASEAN Stock Markets. In N. Mansour & L.M.B. Vadell (Eds.), Finance, Law, and the Crisis of COVID-19 (pp.139–155). Springer, Cham.https://doi.org/10.1007/978-3-030-89416-0_9
Okorie, D. I., & Lin, B. (2021). Stock markets and the COVID-19 fractal contagion effects. Finance Research Letters, 38, 101640.https://doi.org/10.1016/j.frl.2020.101640
Ozili, P. K., & Arun, T. (2020). Spillover of COVID-19: Impact on the Global Economy.Available at SSRN: http://dx.doi.org/10.2139/ssrn.3562570
Ozkan, O. (2021). Impact of COVID-19 on stock market efficiency: Evidence from developed countries. Research in International Business and Finance, 58, 101445. https://doi.org/10.1016/j.ribaf.2021.101445
Peckham, R. (2013). Economies of contagion: financial crisis and pandemic. Economy and Society, 42(2), 226–248. https://doi.org/10.1080/03085147.2012.718626
Sadiq, M., Hsu, C. C., Zhang, Y., & Chien, F. (2021). COVID-19 fear and volatility index movements: Empirical insights from ASEAN stock markets. Environmental Science and Pollution Research, 28(47), 67167–67184. https://doi.org/10.1007/s11356-021-15064-1
Sarr, A., & Lybek, T. (2002). Measuring Liquidity in Financial Markets. Available at SSRN 880932. https://www.imf.org/en/Publications/WP/Issues/2016/12/30/Measuring-Liquidity-in-Financial-Markets-16211#:~:text=The%20measures%20include%20bid%2Dask,depth%2C%20breadth%2C%20and%20resiliency.
Shehzad, K., Xiaoxing, L., & Kazouz, H. (2020). COVID-19’s disasters are perilous than Global Financial Crisis: A rumor or fact? Finance Research Letters, 36, 101669. https://doi.org/10.1016/j.frl.2020.101669
Su, C. W., Dai, K., Ullah, S., & Andlib, Z. (2021). COVID-19 pandemic and unemployment dynamics in European economies. Economic Research-EkonomskaIstraživanja, 1–13, 1226469. https://www.tandfonline.com/doi/full/10.1080/1331677X.2021.1912627
Topcu, M., & Gulal, O. S. (2020). The impact of COVID-19 on emerging stock markets. Finance Research Letters, 36, 101691. https://doi.org/10.1016/j.frl.2020.101691
Tran, L. T. H., Hoang, T. T. P., & Tran, H. X. (2018). Stock liquidity and ownership structure during and after the 2008 Global Financial Crisis: Empirical evidence from an emerging market. Emerging Markets Review, 37, 114–133. https://doi.org/10.1016/j.ememar.2018.07.001
Tripathi, A., & Dixit, A. V. (2019). Liquidity of financial markets: A review. Studies in Economics and Finance, 37(2), 201–227.https://doi.org/10.1108/SEF-10-2018-0319
Urquhart, A. (2016). The inefficiency of Bitcoin. Economics Letters, 148, 80–82. https://doi.org/10.1016/j.econlet.2016.09.019
Vasileiou, E. (2021). Behavioral finance and market efficiency in the time of the COVID-19 pandemic: Does fear drive the market? International Review of Applied Economics, 35(2), 224-241. https://doi.org/10.1080/02692171.2020.1864301
Wanzala, R. W. (2018). Estimation of market immediacy by Coefficient of Elasticity of Trading three approach. The Journal of Finance and Data Science, 4(3), 139–156. https://doi.org/10.1016/j.jfds.2018.02.006
Wei, W. C. (2018). Liquidity and market efficiency in cryptocurrencies. Economics Letters, 168, 21–24. https://doi.org/10.1016/j.econlet.2018.04.003
World Health Organization. (2020). Overview of public health and social measures in the context of COVID-19: Interim guidance, 18 May 2020 (No. WHO/2019-nCoV/PHSM_Overview/2020.1).
Yarovaya, L., Matkovskyy, R., & Jalan, A. (2022). The COVID-19 black swan crisis: Reaction and recovery of various financial markets. Research in International Business and Finance, 59, 101521. https://doi.org/10.1016/j.ribaf.2021.101521
Yildiz, Y. (2021). Foreign institutional investors, information asymmetries, and asset valuation in emerging markets. Research in International Business and Finance, 56, 101381. https://doi.org/10.1016/j.ribaf.2021.101381
Zaremba, A., Aharon, D. Y., Demir, E., Kizys, R., & Zawadka, D. (2021). COVID-19, government policy responses, and stock market liquidity around the world: A note. Research in International Business and Finance, 56, 101359. https://doi.org/10.1016/j.ribaf.2020.101359
Zhang, D., Hu, M., & Ji, Q. (2020). Financial markets under the global pandemic of COVID-19. Finance Research Letters, 36, 101528. https://doi.org/10.1016/j.frl.2020.101528