Organizations and Markets in Emerging Economies ISSN 2029-4581 eISSN 2345-0037
2023, vol. 14, no. 3(29), pp. 486–507 DOI: https://doi.org/10.15388/omee.2023.14.2
Entrepreneurial Climate in India, China and the USA
Mahalakshmi S
School of Commerce and Business Management, Central University of Tamil Nadu, India
mahalakshmi.s03@gmail.com
Thiyagarajan S
School of Management, Pondicherry University, India
sthiyags@yahoo.com
Ranbir Singh Sodhi
Goa Institute of Management, India
ranbir@gim.ac.in
Naresh G (corresponding author)
Indian Institute of Management Tiruchirappalli, India
naresh@iimtrichy.ac.in
Abstract. Entrepreneurship plays a vital role in the process of wealth creation and improving the standard of living of the people through large-scale employment generation. So this study aims to identify the critical factors among the entrepreneurial framework conditions (EFC) and entrepreneurial behaviour and attitudes (EBAA) in enhancing the entrepreneurship climate in the United States of America (USA), China and India. The data for the study is collected from GEM (Global Entrepreneurship Monitor) on EBAA and EFC. Exploratory factor analysis was attempted initially to reduce the EBAA and EFC data into manageable factors. Further, confirmatory factor analysis was attempted to cross-validate the results.
Key Points: • The results unveil that the Public conditions and Business Promotions (EFC) in the USA are superior to India and China. At the same time, India lags behind both the USA and China. • Indian entrepreneurs are more optimistic and audacious than their Chinese counterparts. • The future of entrepreneurship in India depends on what measures the Government adopts today to strengthen the entrepreneurship framework conditions.
Keywords: entrepreneurship, Global Entrepreneurship Monitor, public environment, business promotions, entrepreneurial behavior, entrepreneurial attitude
Received: 7/1/2023. Accepted: 10/10/2023
Copyright © 2023 Mahalakshmi S, Thiyagarajan S, Ranbir Singh Sodhi, Naresh G. Published by Vilnius University Press. This is an Open Access article distributed under the terms of the Creative Commons Attribution Licence, which permits unrestricted use, distribution, and reproduction in any medium, provided the original author and source are credited.
Introduction
Entrepreneurship is considered a vital force in industrialization and economic growth through capital formation, exploitation of local resources, and employment generation. By nature, startups can be characterized as transformation catalysts as they create novel concepts or reimagine existing ones. Engines of innovation, these entities initiate projects from their inception, hence creating value and fostering opportunities. Startups spur regional and national economic development and enable economic recovery, responsible development, and societal transformation. Startups not only generate employment opportunities within their organizations, but the most prosperous ones also instill optimism, foster a sense of community, and contribute to shaping the future. The dependence on foreign goods would be substituted by indigenous products using locally available resources. Primarily, entrepreneurs of micro, small, and medium enterprises (MSMEs), play an important role in the progress and development of society by generating employment opportunities at a large scale (Rajeevan et al., 2015). The governments also recognize their contribution and have been making policy changes to spur economies. Since the 1980s, it has been accepted that entrepreneurship contributes to economic development by creating jobs, bringing in innovation and increasing competition.
Startups come in all shapes and sizes. Subsistence entrepreneurs are individuals who initiate business ventures to generate sufficient money to meet their basic needs and sustain their livelihoods. Transformational entrepreneurs are persons who possess the objective of establishing substantial and dynamic enterprises to generate employment opportunities and money for others. This is often achieved by the introduction of innovative goods or services or by entering areas that were previously unexplored or underserved.
Entrepreneurs not only create jobs but also ensure self-reliance. Mainly, entrepreneurs of MSMEs play a significant role in reducing poverty in developing nations. Entrepreneurial behaviour helps to provide solutions to complex, evolving societal problems. A lot of unrest has been created due to the unavailability of jobs or unemployment in many countries (Galea & Abdalla, 2020). The role of entrepreneurs is not just restricted as a contributing factor to the country's GDP, but also to address the (United Nations) Sustainable Development Goals.
Entrepreneurs can solve many societal problems, as many innovations could be attributed to them. Entrepreneurship is considered the critical accelerator of economic growth and social well-being as it creates an environment for innovation. Raising competitiveness has increased the potential of entrepreneurs to develop innovative ideas which could be converted into marketable products. However, such innovations accelerate economic growth and help the nation attain sustainable development goals (SDGs). Especially in many nations, the role of start-ups / incubators is remarkable in contributing towards attaining 17 SDGs (Surana et al., 2020). Using their creativity in developing innovative business models, products, and processes, start-ups can solve many societal and economic problems. They look at the issues differently and analyze the viability of potentially transformational ideas and work on the minimum viable project. The role of start-ups is crucial in entrepreneurship development mainly due to innovations, employment generation, and enhancing competition (Subrahmanya, 2015).
Technology startups serve as accelerators for economic growth and development. They serve as the primary driving force for economic expansion. They effectively handle issues other industries overlook by applying novel concepts, thus driving societal progress. Simultaneously, they generate employment opportunities, foster economic growth, and attract foreign capital. Startup funding in 2021 exceeded $600 billion, shattering funding records, and the value they produce is almost on par with the GDP of a G7 economy. Digital age entrepreneurs apart from their intention and confidence need to be prepared for the technology adoption with which they can bring in innovation and performance (Biclesanu et al., 2023).
However, the entrepreneurship climate of a nation plays an important role in many start-ups and new entrants. Many start-ups such as Amazon, Facebook, Apple, Uber, Stripe, Ola cabs, Bytedance, Postman, Zerodha, Zomato, etc., have turned into Unicorns within a short period and few have even disturbed large MNCs by reaching billion-dollar valuations. Such a giant leap is possible only with an improvement-driven entrepreneurship climate, and the major nations fostering an improvement-driven entrepreneurship environment are the USA, China, and India. It is substantiated by the study of Prof. Tellis, Director of the Center for Global Innovation, at the USC Marshall School of Business on Start-up index for nations (2016). The study has revealed that the USA is in the first position in generating billion-dollar start-ups with a 65% share of Unicorn start-ups followed by China, which is in the second position with a 14% share, and India is in the third position with a 4% share of Unicorn start-ups (Tellis, 2016).
The global startup economy value in 2019 was USD 3 trillion, and 74% came from startups in just ten cities globally. Another study in 2023 found that three-fourths of the global unicorns1 are from three countries – the USA (54%), China (14.4%), and India (5.9%). One fourth of the global unicorns are in four cities – San Francisco (169), Beijing (62), London (36), and Bengaluru (30). (A study of this type can be useful to government/policymakers). Almost two thirds of the unicorns were related to five emerging areas – Fintech (21%), internet software and services (19%), e-commerce (9%), health (8%), and AI (7.3%).
China’s startup – Unicorn success stories are largely based on the support and initiatives of the Chinese government. According to the December 2022 report by StrideOne, the Indian startup ecosystem has the capacity to make a significant contribution of 4–5% to the country's gross domestic product (GDP) within the next three to five years.
The entrepreneurial ecosystem is well matured in the USA compared with any other country. The US government promotes entrepreneurship by providing funding opportunities, market access, and encouraging innovations. Moreover, the active and passive policy initiatives of the US Government, namely, subsidies, tax breaks, legal protection, property rights, start-up assistance, and access to capital markets contribute to the entrepreneurial ontogenesis. Besides, the US Governments’ global SPARK initiatives to promote entrepreneurship have created an overall entrepreneurship-friendly environment within and outside the nation (Richter et al., 2018). Similarly, the Chinese government’s strategy of mass entrepreneurship and innovation, by creating a conducive eco-system for start-ups has transformed the Chinese economy towards a qualitative growth model which addresses the unemployment problem. The innovative eco-system for start-ups in China was built carefully by connecting the Government policies, corporations’ initiatives, the role of research institutions and universities, venture capital, and government funding. However, the success stories of Alibaba, Baidu, Tencent, etc. have created a positive perception and encouraged small start-ups to discover new business opportunities. Moreover, specialized schools for start-up and systematic entrepreneurial education have developed entrepreneurial skills, creative thinking and enhanced the practical ability of the young and new entrepreneurs in China (Rozell et al., 2011).
However, of late, entrepreneurship has also been getting big support from the Government of India in the name of the Make in India Scheme. The government is very particular in making the environment and climate friendlier and more conducive for the growth and development of entrepreneurship (Jainani, 2019). In this aspect, the Indian government and the Ministry of Finance have given start-ups tax holidays and made finance more affordable and readily available. Specifically, the Indian government has infused liquidity in the MSME sector and NBFCs to protect the entrepreneurs from the unprecedented challenges posed by the COVID 19 pandemic. However, are these moves and measures sufficient for a country like India, aiming to become a Global Economy and reduce poverty?
Indeed, India was the third largest economy in 2018 based on GDP (Purchasing Power Parity) and is projected to have a reasonable growth rate despite a slowdown in the global economy. It is essential to know how it fares against the leaders to identify the specific areas in which policy decisions, if necessary, could be considered. Based on an IMF report, the top three countries in terms of GDP (PPP) are the United States of America (USA), China and India. How is India in the entrepreneurship framework conditions, and how are the attitudes and behaviors of entrepreneurship in India compared to a developed country like the US and a rapidly growing economy like China?
The paper is presented as follows: Section 2 explores the background of the study, and Section 3 explains the methodology to study the effect of entrepreneurial framework conditions and behaviour on selected developed and developing countries. Section 4 examines the results and interprets the effect of selected variables and its implications. Section 5 concludes the effect of entrepreneurial framework conditions and behaviour on the selected countries, and Section 6 explores the limitations and future scope of the study.
1. Background of the Study
Entrepreneurial decisions and success come with the preparedness in terms of financial resources, experience and social network (Vuong et al., 2016). In all the economies, including less developed, developing and developed, there is a need for a proper entrepreneurial framework based on their level of economic development. On measuring the overall relationship between the level of growth and the rate of entrepreneurial activity, the entrepreneurial activities of developed economies show a positive effect. The developing economies show a negative effect on their economic growth, even though different types of activities may have a different impact (Sternberg & Wennekers, 2005). Thereby, the less developed or underdeveloped economies need to strengthen the small and medium businesses by providing conducive regulatory policies, necessary funding and skill sets for the individuals. Developing economies need to focus on established companies with proper regulatory guidelines, infrastructure, efficient financial markets and required labour skills. Likewise, developed economies need to look at the development of technology, innovation and commercialization. However, educational qualifications of the secondary level to university level are required for carrying out entrepreneurial activities based on the needs of the respective economy (Acs, 2006). Institutional Theory (Scott, 2008) determines the rate and type of entrepreneurial activity in an economy by measuring the same regulatory, normative, and cognitive dimensions. To create high-impact entrepreneurship, knowledge spillovers and adequate capital are more required than the regulatory setups (Stenholm et al., 2013).
2. Entrepreneurship Globally
The entrepreneurial readiness of the Bottom of the Pyramid community in Malaysia reveals that the training support provided the community with entrepreneurial preparedness. However, there was a lack of information provided to the entrepreneurs on various entrepreneurial readiness in Malaysia (Halim et al., 2017). In New Zealand, indicators that influence entrepreneurial activities include national policies, social and cultural norms, education, training and financial support. However, entrepreneurial spirit among the individuals persists despite the conditions that prevail (Reihana et al., 2007). In European countries, indicators like governmental policies, social-cultural norms, and infrastructure play a crucial role in constituting EFC (Gabor, 2018). Latin American countries need more entrepreneurial framework conditions. Chile experts also claim that entrepreneurial opportunities in the peripheral regions are worse than the core regions in terms of both financing and infrastructure. However, entrepreneurs in the peripheral regions are highly inspired by the government policies irrespective of the poor supportive regional policies (Amoros et al., 2013). In Small Island Developing States, factors like culture, education, entrepreneurial support influences total entrepreneurial activity and established business ownership within the regions (Pounder & Gopal, 2021).
The entrepreneurial intentions and dispositions among the students from America, Asia and Europe exhibit differences basically because of their country differences. They also show different levels of sensitivity to motivational factors and barriers among them (Giacomin et al., 2011). Immigrant entrepreneurs from India and China in the US use their communities to accumulate social capital and manage ethnicity. The dissimilarities arising from establishing the start-ups, the practices of human resources and their terminations are only due to their respective country’s cultural practices (Chand & Ghorbani, 2011). In contrast, there may not be any changes in the aspects of legal issues. That is, in the respective countries, the regulations guiding entrepreneurial activity are widely different.
Nevertheless, both governments recognized the importance of entrepreneurship. In China entrepreneurship has been promoted as a supplement for balancing their economy; meanwhile, in India MSMEs are facilitating the country to hail as a giant economy (Dana et al., 2004). The government makes efforts for the entrepreneurial development and motivations in MSME sectors (Tiwari & Tiwari, 2007). Both these economies do face challenges due to regional disparities and increased inequality in income, which can only be controlled by the appropriate government policies to improve economic development (Srinivasan, 2003). On comparing India and China, the latter provides a more conducive regulatory environment than the former. The relationship between bureaucracy and entrepreneurship may be similar at the national level, whereas at the regional level, India outperforms China. Overall, China provided a more supportive environment for the businesses to operate and grow than India (Kshetri & Dholakia, 2011). Therefore for China, entrepreneurship is the primary factor for its emergence as a dominant economic power globally. It showed consistent growth in the past three decades (Ahlstom & Ding, 2014). The property rights have an impact on the investments in individual as well as financial capital towards entrepreneurship. In addition, it also affects the forms of entrepreneurship in China (Sahasranamam & Raman, 2018). The government focuses not only on urban but also on rural entrepreneurial development with institutionalized environments and small business development (Li & Matlay, 2006). In China, the emphasis is more on innovation in entrepreneurship with the country’s economic development and internationalization (Ahlstrom, 2018). The internationalization of firms smoothens their exporting process as compared to the indigenous firms in China due to adverse economic conditions (Naudé & Rossouw, 2010). Moreover, China’s previous GEM surveys indicate the high rate of entrepreneurship with a focus on internalization. But entrepreneurship is still considered a double-edged sword concerning economic, social & environmental concerns (Huang, 2016).
Moreover, China’s entrepreneurship is stronger than that of India in terms of economic and cultural perspective, whereas social entrepreneurship is more dominant in India than China (Ramesh, 2020). However, on comparing the experience of China and India concerning the contribution of exports by the entrepreneurs across different sectors, the software and information technology reveals that India is ideal. These sectors led to the formulation of policy guidelines for other industries and against China, where the manufacturing industry takes a lead. The experience in these sectors suggests that eventually, an export-driven economy contributes to the higher growth rates to the economy (Contractor & Kundu, 2004).
In the USA, with respect to the entrepreneurial activities in the manufacturing sector, there is a very little role for culture or demographics. In contrast, local costs and natural advantages play a crucial role for entrepreneurship. Apart from this, the ‘Chinitz view’ prevails as well, i.e., the small suppliers are precarious for entrepreneurship, which reflects small local entrepreneurs (Glaeser & Kerr, 2009).
In India, the startups with innovation have become among the largest in the world. The entrepreneurial ecosystem integrates globally in all aspects including technology, financing, human capital and administration (Bhagavatuka, 2019). Women entrepreneurs in India have played a significant role in both industrial developments as well as establishing good organizations apart from being good citizens (Swetha & Rao, 2013).
Entrepreneurial spirit across the countries was found to be speculative as people in the industrial economy prefer to be self-employed as it gives higher job satisfaction; however, this decreases with their age factor (Blanchflower, 2001). Meanwhile, there has been extensive entrepreneurial research in China and the USA regions with both the early stage and development stage (Jing, 2014), however, the present study intends to look at India with respect to the two regions in terms of entrepreneurship development. In developed countries like the USA, a diverse culture encourages exchanging ideas and views, leading to greater entrepreneurial initiatives (Sobel, 2010). The GEM report on entrepreneurship and economics in the USA reveals a strong relationship leading to growth and development which thrives to satisfy their nation’s improved living conditions and wealth (Manuel, 2006).
Any entrepreneurial environment requires entrepreneurial framework conditions as one of the key ingredients to sustain. EFC inspires the opportunities, capacity and preferences leading to business growth. Cultural and the respective conditions of the economy in many nations help in predicting the entrepreneurial conditions including entrepreneurial finance, policy burdens, legal issues and labour tractability (Baughn, 2003). The GEM entrepreneurial framework conditions have been reviewed for 53 countries over a short period, and the results show different frameworks like openness in commercial, technology and regulatory conditions (Valliere, 2010). In India, infrastructure and education play a crucial role, apart from the labour laws and financial access to the households concerning entrepreneurship in manufacturing and service sectors. Global Entrepreneurship Monitor helps provide the academicians, investors, and policymakers with an understanding of the level of entrepreneurship and its effect on economic development. GEM data also exhibits the various global economic conditions under which the factor-driven, efficiency-driven and innovation-driven cope up with their economic development (Bosma & Levie, 2010).
The three superpowers – the USA, China and India – belong to different income level economies. India is a low income one, China is a middle income economy, and the USA is a high-income economy. As GEM is based on a robust framework and can be used to compare countries, this paper has the GEM conceptual framework as the base. The article aims to identify the factors among the entrepreneurship framework and entrepreneurial behavior and attitudes. This paper compares the Indian Entrepreneurship climate and conditions with those of the USA and China; it also aims to identify any gaps and ways to improve the situation. Global Entrepreneurship Monitor (GEM) has been collecting information related to entrepreneurship. The GEM has been conducting survey since 1999 and as of 2019–2020, GEM had collected data over three million respondents spread across the global economies.
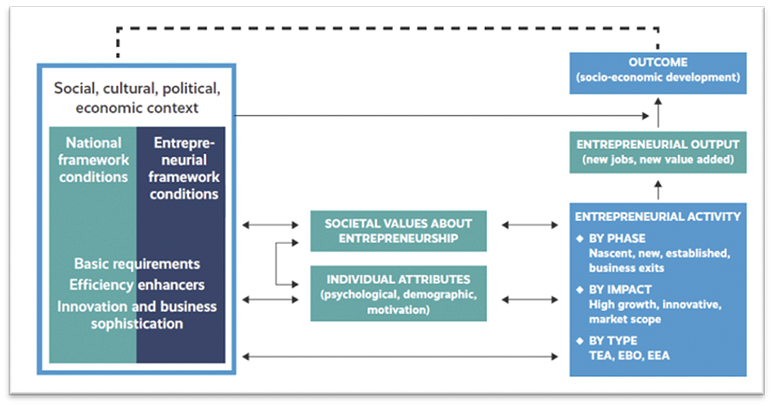
The GEM conceptual framework recognizes that entrepreneurship is part of a complex feedback system and that there are relationships between societal values, personal attributes and various forms of entrepreneurial activities. The GEM framework examines the impact of entrepreneurship in influencing the economic development of nations.
An economic activity’s likelihood depends on the individual’s perception of an opportunity and how they assess their chances of realizing that opportunity in the country's social, cultural, political and economic background. The national framework conditions and the entrepreneurial framework conditions that form the social, cultural, political and economic context also affect the entrepreneurial activity and vice versa.
The entrepreneurial activities generate additional value and employment. Both the Adult Population Survey (APS) and National Expert Survey (NES) have collected the information that helps to build the GEM model (shown in Figure 1) categorizing those elements that impact entrepreneurial activity.
GEM collects a very wide range of data which gauge different aspects of entrepreneurship. GEM reports have illustrated that entrepreneurship has different forms. They vary across the countries. The tool developed by GEM helps people responsible for making policies to look at the various indicators that impact the entrepreneurial ecosystem. These could be used to compare cities, regions or countries. Based on the collected data, a comprehensive study of entrepreneurship profiles of countries could be investigated. GEM not only tracks societal attitudes and perceptions but also measures the different phases of the entrepreneurial process. The focus is on people, exploring attitudes and perceptions to entrepreneurship rather than looking at the organization level. GEM believes that a nation’s growth depends on individuals at different stages of the entrepreneurial process – those who have been there for some time, those who are starting and those who intend to start, and the GEM data capture this information.
Figure 1
The GEM Conceptual Framework/ Model
Given this, the present paper looks into the effect of countries on entrepreneurial framework conditions and behaviour.
3. Methodology
The paper aims to understand how entrepreneurial framework conditions and entrepreneurial behaviour and attitude differ in a developed and a developing country, in a free democratic economy and a controlled economy.
The countries studied are the United States of America, India and China. These countries were selected because they fit well into the aim of the study. One is a developed economy and democracy (USA), another is a developing economy and democracy (India), and the last is not a democracy and a developed economy (China).
The data on EFCs (Entrepreneurial Framework Conditions) and EBA (Entrepreneurial Behavior and Attitudes) for the study was collected from GEM (Global Entrepreneurship Monitor). GEM follows a rigorous methodology of primary data collection, referred to as the Adult Population Survey (APS) across countries. National teams collect data, but the collection teams are supervised so that the data could be used to compare countries. An advantage of the national teams is that they bring the knowledge of the country, entrepreneurship and the insights relating to the findings on the table. Unlike many who capture data of registered businesses, GEM captures both the formal and informal activity. EFC from the National Expert Survey (NES) focuses on creating the business and looks into how EFC is at any given time. EBA is taken from the Adult Population Survey (APS), from a sample of at least 2000 respondents from each country. It looks at an individual role in the entrepreneurial life cycle. It focuses on what motivates an individual to enter entrepreneurship and the attitude needed to run and sustain the business. APS has proven reliable and consistent in providing longitudinal data with national relevance. In many countries, registered businesses are just a tiny reflection of the business. The representatives of GEM also collect qualitative feedback of the various factors from experts in those respective countries, referred to as the National Expert Survey (NES). The data is collected from at least 36 experts on entrepreneurship from each country. EFC is measured based on 12 parameters, and EBA is measured by 15 parameters.
Exploratory Factor Analysis (EFA) was attempted on EFC and EBA data to reduce them to manageable factors for further analysis and easy understanding of EFC and EBA. To cross validate the EFA loading of EFC and EBA, Confirmatory Factor Analysis was attempted with some additional datapoint. CFA was run on Smart PLS, while the preferred software was AMOS. The reason for choosing SmartPLS over AMOS was the smaller data size and assumption of AMOS. Analysis of variance was administered on the factors to see whether they differ across countries by testing the following hypotheses.
EFC
H01a: The public environment for entrepreneurship is consistent across nations.
H01b: There is no variation between countries regarding business promotion elements.
EBAA
H02a: The entrepreneurs' individualistic behaviour exhibits no variation among countries.
H02b: The societal behaviour of entrepreneurs does not vary across countries.
H02c: The behaviour of early movers entrepreneurs is consistent across countries.
H02d: Entrepreneurs' fear levels are the same across nations.
This would help us understand whether entrepreneurship behaviour and framework differ among countries.
4. Results and Discussion
Table 1 shows the Factor Analysis results of Entrepreneurial Framework Conditions consisting of rotated factor loading, explained variance, KMO and Bartlett's test. The results indicate that EFC data are fit for factor analysis as the KMO value is more than 0.5, and Bartlett's significance is less than 0.05. EFC measures are grouped into 2 factors. Factor 1 (Governmental Support and Policies, Taxes and Bureaucracy, Governmental Programs, Basic School Entrepreneurial Education and Training, Post School Entrepreneurial, Education and Training, R&D Transfer, Internal Market Openness, Physical and Services Infrastructure) explains 47.29% of the EFC, and Factor 2 (Financing for Entrepreneurs, Commercial and Professional Infrastructure, Internal Market Dynamics, Cultural and Social Norms) explains 26.79% of the EFC. The two factors put together explain 74.07% of the overall measure of EFC, which is termed as good enough quantification. Factor loading clearly shows that out of the twelve measures, eight are grouped under Factor 1 and four are grouped under Factor 2. Due to the nature of the measures under Factor 1, it is named as Public Environment, and Factor 2 is categorized as Business Promotion.
Table 1
EFC Factor Loading
|
EFC Measures |
Factor 1 |
Factor 2 |
|
Financing for Entrepreneurs |
0.051 |
0.724 |
|
Governmental Support and Policies |
0.792 |
-0.322 |
|
Taxes and Bureaucracy |
0.822 |
0.051 |
|
Governmental Programs |
0.897 |
0.072 |
|
Basic School Entrepreneurial Education and Training |
0.808 |
0.447 |
|
Post School Entrepreneurial Education and Training |
0.716 |
0.437 |
|
R&D Transfer |
0.875 |
0.227 |
|
Commercial and Professional Infrastructure |
0.454 |
0.796 |
|
Internal Market Dynamics |
0.107 |
-0.854 |
|
Internal Market Openness |
0.776 |
0.459 |
|
Physical and Services Infrastructure |
0.751 |
0.205 |
|
Cultural and Social Norms |
0.499 |
0.721 |
|
Explained Variance Percentage |
47.29% |
26.79% |
|
Cumulative Percentage |
47.29% |
74.07% |
|
Kaiser-Meyer-Olkin Measure of Sampling Adequacy |
0.816 |
|
|
Bartlett‘s Test of Sphericity |
422.659 |
0.000 |
The Factor Analysis results of Entrepreneurial Behavior and Attitudes with rotated factor loading, explained variance, KMO and Bartlett's test are shown in Table 2. As can be seen from Table 2, EBA data are fit for factor analysis as the KMO value is more than 0.5 and Bartlett's significance is less than 0.05. EBA measures are grouped into 4 Factors: Factor 1 explains 31.45 % of the EBA, Factor 2 explains 26.40 % of the EBA, Factor 3 explains 15.94% of the EBA measure, and Factor 4 explains 11.58% of the EBA measure. All the four factors together explain 85.47 % of the overall measure of EBA, which is considered a very good quantification. Factor loading clearly shows that out of the 15 indicators, 5 indicators (Perceived Opportunities, Perceived Capabilities, Entrepreneurial Employee Activity, Motivational Index, Business Services Sector) are grouped under Factor 1; 3 indicators (High Job Creation Expectation, High Status of Successful Entrepreneurs, Entrepreneurship as a Good Career Choice) are grouped under Factor 2; 5 indicators (Total Early-Stage Entrepreneurial Activity (TEA), Established Business Ownership, Female/Male, F/M opportunity-driven, Innovation) are grouped under Factor 3, and 2 indicators (Fear of Failure Rate, Entrepreneurial Intentions) are grouped under Factor 4. Due to the nature of the grouping of the indicators, Factor 1 is named as Individualistic Behavior, Factor 2 is named as Societal Behavior, Factor 3 is named as Early Mover Behavior, and Factor 4 is named as Fear Behavior.
Table 2
EBA Factor Loading
|
EBA Measures |
Factor 1 |
Factor 2 |
Factor 3 |
Factor 4 |
|
Perceived Opportunities |
0.930 |
0.003 |
0.039 |
-0.112 |
|
Perceived Capabilities |
0.944 |
-0.178 |
0.145 |
-0.059 |
|
Fear of Failure Rate |
-0.400 |
-0.206 |
-0.130 |
0.820 |
|
Entrepreneurial Intentions |
-0.207 |
0.500 |
0.152 |
0.740 |
|
Total Early-Stage Entrepreneurial Activity (TEA) |
0.457 |
0.465 |
0.492 |
0.016 |
|
Established Business Ownership |
0.272 |
0.260 |
0.755 |
0.091 |
|
Entrepreneurial Employee Activity |
0.856 |
0.352 |
-0.020 |
-0.315 |
|
Motivational Index |
0.865 |
0.309 |
-0.010 |
-0.330 |
|
Female/Male (TEA) |
-0.333 |
0.482 |
0.620 |
-0.114 |
|
Female/Male Opportunity-Driven (TEA) |
-0.044 |
0.252 |
-0.854 |
-0.020 |
|
High Job Creation Expectation |
0.387 |
0.848 |
-0.034 |
-0.228 |
|
Innovation |
0.470 |
-0.452 |
-0.586 |
0.203 |
|
Business Services Sector |
0.708 |
0.513 |
-0.081 |
-0.379 |
|
High Status to Successful Entrepreneurs |
0.154 |
0.938 |
0.075 |
0.007 |
|
Entrepreneurship as a Good Career Choice |
-0.018 |
0.878 |
0.216 |
0.187 |
|
Explained Variance Percentage |
31.45% |
26.40% |
15.94% |
11.58% |
|
Cumulative Percentage |
31.45% |
57.95% |
73.89% |
85.47% |
|
Kaiser-Meyer-Olkin Measure of Sampling Adequacy |
0.856 |
|||
|
Bartlett‘s Test of Sphericity |
478.316 |
0.000 |
||
CFA results for EFC and EBAA are included in Figure A1 and Table A1. The model fit numbers are good for EBA, with RMSEA being 0 and chi-square test being significant, signalling that the baseline model is better. Moving on to individual loading, it can be seen that out of the 15 indicators, 11 have a significant loading at 10%, of which 10 indicators are significant at 5%, and the rest are insignificant. Even though the third factor (Early Mover) has three insignificant loadings, the average loading of it is close to 0.5. Similarly, the average loading of other 3 factors is also close to or above 0.5 (Hair et al., 2018). None of the correlations (6) between factors (4) are significant (5%), which proves that the factors are independent of each other and can be termed as independent constructs to quantify EBA.
The model fit numbers for EFC are much better, and the RMSEA is with the upper and lower bound numbers and it is also significant (5%). All the 12 individual statements have a significant (5%) loading to their respective factors, and the average loading of the factors is above 0.5.
CFA results have validated the EFA results with more than 85% of the loading justified and all factors having the average variance of 0.5 and more.
Table 3
Country-Wise Difference of EFC
|
Factors |
Countries |
N |
Mean |
Std. |
F |
Sig |
Post Hoc (5%) |
|
Factor 1 |
USA |
18 |
23.78 |
2.579 |
3.395 |
0.043 |
No Difference (USA & CHINA) |
|
CHINA |
13 |
22.54 |
1.330 |
No Difference (China & India) |
|||
|
INDIA |
12 |
21.58 |
2.644 |
Difference (India & USA) |
|||
|
Total |
43 |
22.79 |
2.426 |
|
|||
|
Factor 2 |
USA |
18 |
13.78 |
1.555 |
4.256 |
0.021 |
Difference (USA & China) |
|
CHINA |
13 |
12.54 |
1.050 |
No Difference (China & India) |
|||
|
INDIA |
12 |
12.42 |
1.621 |
Difference (India & USA) |
|||
|
Total |
43 |
13.02 |
1.551 |
|
Table 3 presents the ANOVA test of mean difference between countries and pair wise group difference, Post Hoc Analysis, on 2 Factors of Entrepreneurial Framework Conditions. Table 3 shows that the factors of the entrepreneurial framework conditions, namely the public environment and business promotion (private conditions), vary between the USA, China, and India. In the case of both the public environment and business promotion factors, the significant F-statistics of ANOVA indicates that the null hypotheses, H01a and H01b, can be rejected at the 5% level. The results of the ANOVA thus reveal a considerable difference between these economies in terms of both EFC factors. This may be on expected lines for many. Still, probing the results further via Post Hoc analysis makes it clear how the EFC factors vary bilaterally between the countries. The findings show that public environment and business promotion are comparable in China and India. However, there are significant differences between India and the USA in the public environment and business promotion. The findings are intriguing because they demonstrate that, despite there being no differences between China and the USA's public environments, there are differences in how businesses are promoted. India remains last on the list in terms of entrepreneurial framework conditions, whereas the USA tops the list with the best public environment and business promotion. The results demonstrate that while China's public environment is comparable to that of the USA and India, the private environment for business promotion in China and the USA differs. This indicates that, in terms of both public environment and business promotion, China is in the middle of the heap; it is neither far ahead of India nor substantially behind the United States.
China offers a better public climate and business promotion for entrepreneurial activity than India. The dynamic character of institution building has emerged from China's gradually advancing economic reforms, which has in turn stimulated entrepreneurship culture. However, the rigidity and lax institutional restraints limit entrepreneurial activities in India (Ramesh, 2020). The US is far ahead of India in terms of the entrepreneurial framework conditions and surpasses China in business promotion. It is because of this we get to see more start-ups in the US and most of the billionaires are from USA (Jeff Bezos to Mark Zuckerberg).
Table 4
Country-Wise Difference of EBA
|
Factors |
Countries |
N |
Mean |
Std. |
F |
Sig |
Post Hoc (5%) |
|
Factor 1 |
USA |
18 |
131.0133 |
20.65415 |
33.252 |
0.000 |
Difference (US and China) |
|
CHINA |
15 |
75.4727 |
12.48532 |
Difference (China and India) |
|||
|
INDIA |
11 |
102.3236 |
24.87107 |
Difference (India and US) |
|||
|
Total |
44 |
104.9066 |
30.86241 |
|
|||
|
Factor 2 |
USA |
18 |
115.7078 |
64.67124 |
3.088 |
0.066 |
Difference (US and China) |
|
CHINA |
15 |
155.7493 |
38.33179 |
Difference (China and India) |
|||
|
INDIA |
11 |
108.4691 |
55.55480 |
No Difference |
|||
|
Total |
44 |
127.5486 |
57.26142 |
|
|||
|
Factor 3 |
USA |
18 |
35.1044 |
20.97575 |
0.242 |
0.786 |
No Difference |
|
CHINA |
15 |
38.6460 |
10.34294 |
No Difference |
|||
|
INDIA |
11 |
39.0927 |
19.18599 |
No Difference |
|||
|
Total |
44 |
37.3089 |
17.25842 |
|
|||
|
Factor 4 |
USA |
18 |
36.8761 |
7.67095 |
23.535 |
0.000 |
Difference (USA and China) |
|
CHINA |
15 |
59.9947 |
6.99771 |
No Difference |
|||
|
INDIA |
11 |
59.7355 |
17.94220 |
Difference (India and US) |
|||
|
Total |
44 |
50.4723 |
15.65361 |
|
Table 4 consists of mean difference test ANOVA between countries with reference to 4 Factors of Entrepreneurial Behavior and Attitudes, and group difference (Post Hoc Test). The differences in entrepreneurial behavior and attitude (EBA) between people in the USA, China, and India have been examined using the four factors: Individualistic, Societal, Early Mover, and Fear behaviors (Table 4). The results of ANOVA (Table 4) clearly state a significant difference in only two of the EBA factors: Individualistic and Fear Behaviour. The other Two Factors (Societal and Early Mover) do not exhibit any difference between the USA, China and India. It is evident from the significant F statistics of ANOVA. Thus, the null hypotheses H02a and H02d can be rejected, and H02b and H02c cannot be rejected at a 5% level. Among the two behavioural factors that showed a statistical difference between the counties, USA topped in both Individualistic and Fear Behaviour, while India had the least score in both behaviour factors. This may be on the expected lines for many but when we look deeper into the results with the aid of the Post Hoc test, it becomes evident that the differences between the USA and China and the USA and India are statistically significant (5%) for each of the factors. However, China and India demonstrated a significant difference in individualistic behaviour but did not statistically differ regarding fear behaviour. The USA is way ahead of China and India in these factors. India is behind the USA on both factors, but the interesting finding is that it is ahead of China. Chinese entrepreneurs exhibit less individualistic behavior than Indian entrepreneurs since the latter are thought to have a tradition of adopting collectivism (Wang, 2012).
The staggering number of new start-ups, enterprises, and billionaires demonstrates that the US has far superior entrepreneurial framework conditions as well as entrepreneurial behavior and attitude as compared to China and India (Bygrave & Reynolds, 2006). Moreover, the training and skills provided by the US educational institutions are superior to those in India and China. Education on innovation and entrepreneurship is well-supported in the USA. The American entrepreneurial education has a complete infrastructure and atmosphere and takes a bottom-up approach to interactions with a robust system of curriculum and pedagogy (Yu, 2018). Availing finance in the US to start new businesses and high-potential risky ventures is quite easy and less cumbersome through venture capital funds. Several organizations in the US like SBA (Small Business Administration), SBDCs (Small Business Development Centres), MBDA (Minority Business Development Agency), and SCORE (Service Corps of Retired Executives) aid entrepreneurs in several ways including how to avail grants, small loans, government contracts, etc., especially for new business organizations (Heriotet al., 2017). However, the EFC in China is not better than in the US, as government approvals and getting licenses in doing business is more complex in China than in the US. China’s EFC is better than in India mainly due to infrastructure development, innovation-oriented entrepreneurship education, efficiency-driven business environment, the progress of science and technology, skill orientation, student-oriented training programmes, more financial support for start-ups, etc. (He et al., 2019). Although China’s EFC is better than in India, the confidence levels of Chinese entrepreneurs are lower than the Indian counterparts due to the risk-taking behaviour of the workforce in a protectionist economy (Fitzsimmons & Douglas, 2005). Many youngsters in China intend to engage in a job rather than start a business because the average wage rate in China had tripled between the periods 2005 to 2016 and in many Chinese cities, the average monthly wage is around $1400, which is much higher than many emerging economies. Moreover, the employers cannot terminate any employee in general without any valid reason, the terms and conditions on employment, employer’s compensation, and termination/revocation procedure are also stringent and specifically provided by the law. Such a strict legal environment has raised the level of fear of Chinese entrepreneurs (Konget al., 2020).
Conversely, India is not so good and has to go a long way in the entrepreneurship framework and control due to several issues such as bureaucracy, red-tapism and widespread corruption in getting approvals even at the initial stage of starting a business. Moreover, non-availability of the skilled workforce, lack of entrepreneurial and managerial skills, lack of technical know-how due to the major gap in the education system and the industrial requirements, inadequate training facilities, lack of training centers, technical obsolescence, deficient market linkages and poor technical assistance, in general, affect the public environment for entrepreneurship. Besides, the challenges in raising capital, availing grants and credit facilities discourage the entrepreneurs, particularly, the difficulty in approaching the officials for availing the loan. The prolonged loan approval process, lengthy sanction period, cumbersome procedures, collateral and indemnity requirements, delay in loan disbursement and the high-interest rate on credit dampen business promotion (Chowdhury et.al., 2018). However, the perception of widespread corruption may have a detrimental impact on entrepreneurial behavior, and such widespread corruption may compel entrepreneurs to get engaged in some form of rent-seeking activity, which has a significant negative economic impact on the country (Collins et al., 2016). However, the entrepreneurial behaviour and attitude in India has seen some improvement in recent years even though the framework has to improve a lot as a whole in India with more policy initiatives from the government. Although the framework is not so good, the attitude and behaviour is good in India, thanks to measures taken by the Government (Make in India, Atmanirbhar Bharat, Start-up India & Stand up India initiatives, Atal Innovation Mission, Aspire, Credit Guarantee Scheme for Start-ups, NewGen Innovation and Development Centre, etc.). This is a good start and a healthy trend with the society seeing a surge in entrepreneurship culture. If the Government can take advantage and work out substantive measures to sustain this trend, India can see a speedy recovery of the economy.
5. Implications
The results unveil that Indian entrepreneurs are more optimistic and audacious than their Chinese counterparts. Thus, the future of entrepreneurship in India depends on what measures the Government adopts today to strengthen the entrepreneurship framework conditions considering the potential of Indian entrepreneurs. The entrepreneurship landscape must be improved to attain sustainable growth. It is possible through addressing the policy gaps that have an impact on business sustainability. Micro, small, and medium-sized business owners need to be encouraged and supported in order to have the best possible entrepreneurial climate. Further, to create a stronger entrepreneurship atmosphere, it is necessary to address the financial and policy issues, geographic disadvantages, infrastructure and technology problems, and procedural bottlenecks promptly. Thus, strengthening the entrepreneurial policy framework through substantive measures will help the nation to achieve its self-reliant and sustainable goals.
6. Conclusion
Entrepreneurship has the potential to change the fate of any nation. The landscape of entrepreneurship changed dramatically during the 21st century, and in turn, it has transformed the global economy through technological and financial innovations. Globally, entrepreneurship is considered as a key economic activity that generates massive employment opportunities. So the policymakers across nations are trying to build a favourable business climate to encourage entrepreneurs. In many countries, the assessment mechanism of entrepreneurial activity has significantly contributed to shaping economic policies. Specifically, the assessment of the GEM (Global Entrepreneurship Monitor) research project in diverse economies has influenced the business policies of many developed and developing countries. Thus, the study has considered the GEM conceptual framework to assess the factors influencing EFC (Entrepreneurship Framework Conditions) and EBA (Entrepreneurial Behaviour and Attitudes) of three diverse nations: India, China, and the United States.
The outcomes of the paper indicate that both the Public conditions and Business Promotions (EFC) in the US are superior to those in India and China, while India lags behind both US and China. However, the results do not exhibit any difference in the societal and early mover behaviour (EBA) between the nations, whereas the US entrepreneurs’ individualistic behaviour is way ahead, and their level of fear is quite lesser than both Indian and Chinese entrepreneurs. Although China's entrepreneurial framework conditions are far superior to those of India's, Chinese entrepreneurs tend to be less individualistic than their Indian counterparts because it is believed that the Chinese have a history of adopting collectivism. However, the individualistic behavior of Chinese entrepreneurs can be enhanced through value creation, entrepreneurship education and innovative pedagogy that may support learning and foster entrepreneurial behavior and attitude. Despite the individualistic behavior of Indian entrepreneurs being significantly better than that of Chinese, the public and private environments, or the entrepreneurial framework conditions, are not favorable. Therefore, to improve India's entrepreneurial framework conditions, it is necessary to strengthen institutions and infrastructure, provide adequate funding for start-ups and small and medium-sized businesses, improve the effectiveness of the labor and goods markets, provide technological support, address corruption, red-tapism and procedural delays, and provide value-added entrepreneurial education and training.
7. Limitations and Future Scope
The paper is limited to the GEM framework of entrepreneurial behaviour and attitude and entrepreneurial framework conditions, whose data was collected through harmonized surveys of experts. No single indicator can adequately represent the entrepreneurial environment of a nation since it is a multidimensional and intricate phenomenon. In order to examine entrepreneurship comprehensively, a wide range of metrics must be used to describe all facets of a nation's entrepreneurial environment. Future research must include both economic and non-economic variables by using a longitudinal approach because the current GEM framework depends on an individual opinion, which is subject to change over time.
References
Acs, Z. (2006). How Is Entrepreneurship Good for Economic Growth? Innovations: Technology, Governance, Globalization, 1(1), 97–107.
Ahlstrom, D., & Ding, Z. (2014). Entrepreneurship in China: An overview. International Small Business Journal, 32(6), 610–618.
Ahlstrom, D., Yang, X., Wang, L., & Wu, C. (2018). A global perspective of entrepreneurship and innovation in China. Multinational Business Review, 26(4), 302–318.
Amorós, J. E., Felzensztein, C., & Gimmon, E. (2013). Entrepreneurial opportunities in peripheral versus core regions in Chile. Small Business Economics, 40(1), 119–139.
Baughn, C. C., & Neupert, K. E. (2003). Culture and National Conditions Facilitating Entrepreneurial Start-Ups. Journal of International Entrepreneurship, 1(3), 313–330.
Bhagavatula, S., Mudambi, R., & Murmann, J. P. (2019). Innovation and Entrepreneurship in India: An Overview. Management and Organization Review, 15(3), 467–493.
Biclesanu, I., Savastano, M., Chinie, C., & Anagnoste, S. (2023). The Role of Business Students’ Entrepreneurial Intention and Technology Preparedness in the Digital Age. Administrative Sciences, 13(8), 177.
Blanchflower, D. G., Oswald, A., & Stutzer, A. (2001). Latent Entrepreneurship Across Nations. European Economic Review, 45(4–6), 680–691.
Bosma, N. S., & Levie, J. (2010). Global Entrepreneurship Monitor (GEM) 2009 Executive Report.
Bygrave, W. D., & Reynolds, P. D. (2006). Who Finances Startups in the USA. A Comprehensive Study of Informal Investors, 1999–2003). Babson Kauffman Entrepreneurship Research Conference (BKERC), 2002-2006. Available at SSRN: https://ssrn.com/abstract=1768163
Chand, M., & Ghorbani, M. (2011). National Culture, Networks and Ethnic Entrepreneurship: A Comparison of the Indian and Chinese Immigrants in the US. International Business Review, 20(6), 593–606.
Chowdhury, F., Desai, S., Audretsch, D. B., Chowdhury, F., Desai, S., & Audretsch, D. B. (2018). Corruption, Entrepreneurship, and Social Welfare. In Corruption, Entrepreneurship, and Social Welfare (pp. 67-94). Springer International Publishing.
Collins, J. D., McMullen, J. S., & Reutzel, C. R. (2016). Distributive justice, corruption, and entrepreneurial behavior. Small Business Economics, 47(4), 981–1006.
Contractor, F. J., & Kundu, S. (2004). The role of export-driven entrepreneurship in economic development: A comparison of software exports from India, China, and Taiwan. Technological Forecasting and Social Change, 71(8), 799–822.
Dana, L. P., Mueller, J., & Pio, E. (2004). Contours of entrepreneurship: the impact of government policy in China and India. Journal of Asia Entrepreneurship and Sustainability, 4(2), 74-96.
Fitzsimmons, J. R., & Douglas, E. J. (2005). Entrepreneurial Attitudes and Entrepreneurial Intentions: A Cross-Cultural Study of Potential Entrepreneurs in India, China, Thailand and Australia. [Paper presentation]. Babson-Kauffman Entrepreneurial Research Conference, Wellesley, MA (Vol. 47).
Gabor, M. R. (2018). Entrepreneurial Framework Conditions and Sustainable Growth in Europe. A Multimethod Analysis. Annals of “Dunarea de Jos” University of Galati Fascicle I. Economics and Applied Informatics, 1(1), 154–161.
Galea, S., & Abdalla, S. M. (2020). COVID-19 Pandemic, Unemployment, and Civil Unrest: Underlying Deep Racial and Socioeconomic Divides. Jama, 324(3), 227–228.
Giacomin, O., Janssen, F., Pruett, M., Shinnar, R. S., Llopis, F., & Toney, B. (2011). Entrepreneurial Intentions, Motivations and Barriers: Differences Among American, Asian and European Students. International Entrepreneurship and Management Journal, 7(2), 219–238.
Glaeser, E. L., & Kerr, W. R. (2009). Local Industrial Conditions and Entrepreneurship: How Much of the Spatial Distribution Can We Explain?. Journal of Economics & Management Strategy, 18(3), 623–663.
Glinka, B., & Thatchenkery, T. (2013). A comparative study of perceptions towards entrepreneurship in India, Poland, and the USA. International Journal of Human Resources Development and Management, 13(2-3), 119–135.
Hair, J. F., Black, W. C., Babin, B. J., & Anderson, R. E. (2018). Multivariate Data Analysis (7th ed.). New York: Pearson.
Halim, H. A., Ahmad, N. H., Ramayah, T., & Hanifah, H. M. (2017). Entrepreneurial Readiness Towards Venture Creation Among Bop Community. International Journal of Entrepreneurship, 21(2).
He, C., Lu, J., & Qian, H. (2019). Entrepreneurship in China. Small Business Economics, 52, 563–572.
Heriot, K. C., Dickes, L. A., & Jauregui, A. (2017). Boots2Business: An Early View of an SBA Entrepreneurship Outreach Program. Small Business Institute Journal, 13(1), 1–15.
Huang, Q., Liu, X., & Li, J. (2016). Entrepreneurship in China. Entrepreneurship & Regional Development: An International Journal, 28(9), 817–8019.
Jainani, K. (2019). Visionary Entrepreneurship in India in the Digital Era: A Predicated Factors-Based Study. IUP Journal of Entrepreneurship Development, 16(2), 21–22.
Jing, S., Qinghua, Z., & Landström, H. (2015). Entrepreneurship research in three regions-the USA, Europe and China. International Entrepreneurship and Management Journal, 11(4), 861–890.
Kong, F., Zhao, L., & Tsai, C. H. (2020). The Relationship Between Entrepreneurial Intention and Action: The Effects of Fear of Failure and Role Model. Frontiers in Psychology, 11, 229.
Kshetri, N., & Dholakia, N. (2011). Regulative institutions supporting entrepreneurship in emerging economies: A comparison of China and India. Journal of International Entrepreneurship, 9(2), 110–132.
Li, J., & Matlay, H. (2006). Chinese Entrepreneurship and Small Business Development: An Overview and Research Agenda. Journal of Small Business and Enterprise Development, 13(2), 248–262.
Manuel, E. G. (2006). Entrepreneurship and Economics. Available at SSRN 912762.
Naudé, W., & Rossouw, S. (2010). Early international entrepreneurship in China: Extent and determinants. Journal of International Entrepreneurship, 8(1), 87–111.
Pounder, P., & Gopal, N. (2021). Entrepreneurship and Small Island Economies. Organizations and Markets in Emerging Economies, 12(2), 415–439.
Rajeevan, N., Sulphey, M. M., & Rajasekar, S. (2015). The Critical Role of Micro, Small & Medium Enterprises in Employment Generation: An Indian Experience. Asian Social Science, 11(24), 258.
Ramesh, S. (2020). Entrepreneurship in China and India. Journal of the Knowledge Economy, 11(1), 321–355.
Reihana, F., Sisley, M., & Modlik, H. (2007). Maori entrepreneurial activity in Aotearoa New Zealand. International Journal of Entrepreneurship and Small Business, 4(5), 636–653.
Richter, N., Jackson, P., & Schildhauer, T. (2018). Entrepreneurial Behaviour and Startups: The Case of Germany and the USA. In Entrepreneurial Innovation and Leadership (pp. 1–14). Palgrave Pivot, Cham.
Rozell, E. J., Meyer, K. E., Scroggins, W. A., & Guo, A. (2011). Perceptions of the Characteristics of Successful Entrepreneurs: An Empirical Study in China. International Journal of Management, 28(4), 60.
Sahasranamam, S., & Raman, G. V. (2018). Individual Resources, Property Rights and Entrepreneurship in China. International Journal of Emerging Markets.
Sobel, R. S., Dutta, N., & Roy, S. (2010). Does cultural diversity increase the rate of entrepreneurship?. The Review of Austrian Economics, 23(3), 269–286.
Srinivasan, T. (2003). China and India: Economic Performance, Competition and Cooperation: An Update. (Stanford King Center on Global Development, Working Paper 199).
Stenholm, P., Acs, Z. J., & Wuebker, R. (2013). Exploring country-level institutional arrangements on the rate and type of entrepreneurial activity. Journal of Business Venturing, 28(1), 176–193.
Scott, W. R. (2008). Institutions and Organizations: Ideas and Interests. Sage.
Sternberg, R., & Wennekers, S. (2005). Determinants and Effects of New Business Creation Using Global Entrepreneurship Monitor Data. Small Business Economics, 24(3), 193–203.
Subrahmanya, M. B. (2015). New Generation Start-ups in India: What Lessons Can We Learn from the Past?. Economic and Political Weekly, 56–63.
Surana, K., Singh, A., & Sagar, A. D. (2020). Strengthening science, technology, and innovation-based incubators to help achieve Sustainable Development Goals: Lessons from India. Technological Forecasting and Social Change, 157, 120057.
Swetha, T., & Rao, K. V. (2013). Entrepreneurship in India. International Journal of Social Science & Interdisciplinary Research, 2(7), 1–13.
Tellis, G. J. (2016). 2016 Start-up Index of Nations (USC Marshall School of Business Report). Unicorn-Index-Report-GT17.pdf
Tiwari, S. & Tiwari, A. (2007). Entrepreneurship Development in India. Sarup & Sons, New Delhi.
Valliere, D. (2010). Reconceptualizing entrepreneurial framework conditions. International Entrepreneurship and Management Journal, 6(1), 97–112.
Vuong, Q. H., Do, T. H., & Vuong, T. T. (2016). Resources, experience, and perseverance in entrepreneurs’ perceived likelihood of success in an emerging economy. Journal of Innovation and Entrepreneurship, 5(1), 1–24.
Wang, R. (2012). Chinese Culture and its Potential Influence on Entrepreneurship. International Business Research, 5(10), 76.
Yu, C. W. (2018). Understanding the Ecosystems of Chinese and American Entrepreneurship Education. Journal of Entrepreneurship Education, 21(2), 1–18.
Appendix
Figure A1
The CFA Model
|
EFC |
EBA |
|
|
|
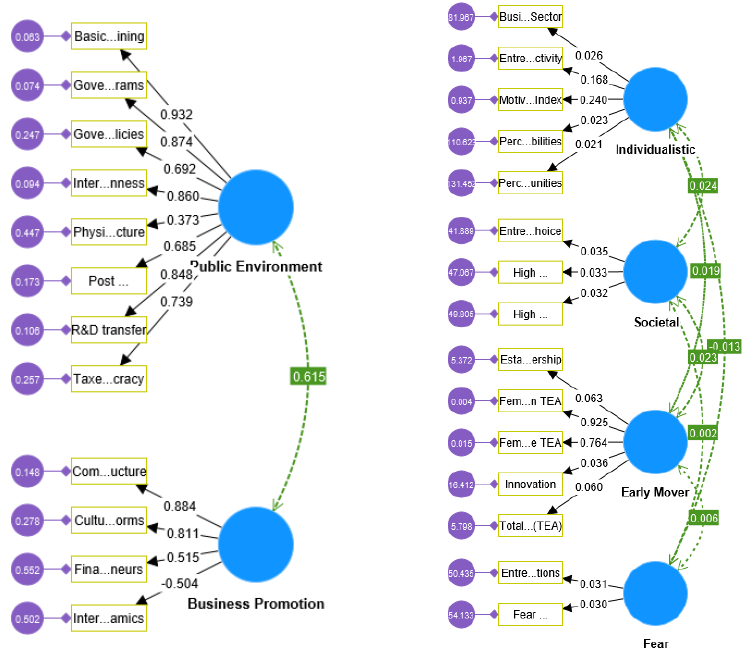
Table A1
EFC and EBA Model Estimation
|
Estimated model |
|
|
Chi-square |
241.091 |
|
Number of model parameters |
25.000 |
|
Number of observations |
53.000 |
|
Degrees of freedom |
53.000 |
|
P value |
0.000 |
|
ChiSqr/df |
4.549 |
|
RMSEA |
0.259 |
|
RMSEA LOW 90% CI |
0.226 |
|
RMSEA HIGH 90% CI |
0.292 |
|
GFI |
0.600 |
|
AGFI |
0.412 |
|
PGFI |
0.408 |
|
SRMR |
0.166 |
|
NFI |
0.604 |
|
TLI |
0.569 |
|
CFI |
0.654 |
|
AIC |
291.091 |
|
BIC |
340.348 |
|
Estimated model |
|
|
Chi-square |
832.245 |
|
Number of model parameters |
36.000 |
|
Number of observations |
54.000 |
|
Degrees of freedom |
84.000 |
|
P value |
0.000 |
|
ChiSqr/df |
9.908 |
|
RMSEA |
0.406 |
|
RMSEA LOW 90% CI |
0.381 |
|
RMSEA HIGH 90% CI |
0.431 |
|
GFI |
0.313 |
|
AGFI |
0.019 |
|
PGFI |
0.219 |
|
SRMR |
0.339 |
|
NFI |
-0.444 |
|
TLI |
-0.985 |
|
CFI |
0.000 |
|
AIC |
904.245 |
|
BIC |
975.848 |
1 A unicorn is a startup valued at more than USD one billion.