Organizations and Markets in Emerging Economies ISSN 2029-4581 eISSN 2345-0037
2023, vol. 14, no. 3(29), pp. 644–669 DOI: https://doi.org/10.15388/omee.2023.14.9
Long-Term Asymmetric Impact of VAT on Domestic Investment in Nigeria
Nurudeen Abu (corresponding author)
Baba-Ahmed University, Nigeria
abu.nurudeen@yahoo.com
https://orcid.org/0000-0002-9843-977X
Blessing Izuagie
Umaru Musa Yar’adua University, Nigeria
igbaofoesther@gmail.com
Onyewuchi Amaechi Ben-Obi
Central Bank of Nigeria, Nigeria
benobioa@gmail.com
https://orcid.org/0009-0008-4481-2242
Abstract. We employ a non-linear ARDL (NARDL) technique to explore long-term asymmetric influence of value added tax (VAT) on domestic investment using quarterly data for Nigeria from 1994 to 2021. A long-term relation was found between domestic investment and VAT (alongside lending and inflation rates, credit to private sector, exchange rate, openness and households’ consumption expenditure) based on the bounds test to cointegration. We uncovered a long-term asymmetric association between domestic investment and VAT. The results show that a positive shock (an increase) in VAT has a long-term decrease and significant influence on domestic investment, while a negative shock (a decrease) in VAT has an insignificant positive influence on investment during the long-term. Other significant long-term drivers of domestic investment are credit to private sector, inflation and lending rates, openness, exchange rate and households’ consumption expenditure. Some recommendations have been offered based on the empirical outcomes.
Keywords: domestic investment, VAT, non-linear ARDL, Nigeria
Received: 4/5/2023. Accepted: 3/10/2023
Copyright © 2023 Nurudeen Abu, Blessing Izuagie, Onyewuchi Amaechi Ben-Obi. Published by Vilnius University Press. This is an Open Access article distributed under the terms of the Creative Commons Attribution Licence, which permits unrestricted use, distribution, and reproduction in any medium, provided the original author and source are credited.
1. Introduction
One of the critical roles of government across the world is the provision of socio-economic infrastructures (like roads, electricity, educational and healthcare services, defence, etc.), required to boost productivity and ensure attainment of high economic growth rates including raising living standards of their populace. To make public goods available in substantial amounts, huge resources (revenues) have to be mobilized and expended. In a modern society, tax collection forms a significant portion of government revenue. Moreover, tax imposition has remained an important tool deployed by governments to promote optimal resource allocation, ensuring stable prices, addressing cyclical fluctuations, correcting regional disparities and income inequality, and raising investment and saving levels, among others (Asogwa & Nkolika, 2013; Uchime & Anichibe, 2019).
Although Nigeria’s tax system has evolved over time with the fiscal authority implementing both direct and indirect forms of taxation, it was bedevilled by inefficiency, lack of transparency and corruption (Abu et al., 2022b; Fjeldstad, 2003; Micha et al., 2012; Momoh, 2018; Salami, 2011). Coupled with these was the authority’s inability to generate substantial (tax) revenue to meet government’s obligation of providing basic necessities of life (Abu et al., 2022b).
To address the shortcomings of the existing structure at that time, Nigeria introduced the value added tax (VAT) in 1993 as a replacement of the sales tax. The rationale for adopting VAT included its efficiency, expediency, administration and cost-effectiveness, and potential for high revenue generation (Muzurura & Sikwila, 2018; Njuru et al., 2013; Toder & Rosenberg, 2010).
Prior to its adoption in Nigeria, VAT had become the most significant form of domestic tax in many transitional and developing nations including advanced economies (Acharya, 2016; Acosta-Ormaechea & Morozumi, 2021; Aizenman & Jinjarak, 2005; Alavuotunki et al., 2019; Alm & El-Ganainy, 2012; Bird, 2005; Ebrill et al., 2001, 2002). This followed the success which had been recorded (with respect to cost-effectiveness, efficiency, administration and revenue mobilization) in member-states of the European Union (EU), non-EU members, the Organization for Economic Cooperation and Development nations (Acharya, 2016; Lee et al., 2013), and the International Monetary Fund’s continued suggestion on its adoption to raise revenue (Bird, 2010; Ufier, 2014).
VAT is primarily a consumption tax, it varies in dimensions from the traditional sales and turnover taxes (Ahlerup et al., 2015; Bird & Gendron, 2006), and differs across nations in terms of its elasticity in government revenue mobilization. In evaluating VAT performance, countries have adopted one of efficiency ratios, c-efficiency ratio or aggregate/gross VAT collection (Acharya, 2016). Besides, VAT revenues contribute to one-fourth of global tax revenue (Acharya, 2016; Aizenman & Jinjarak, 2005).
Compared to other types of taxes, more revenue is generated from VAT, it is more difficult to evade, it is easier to implement and it can be designed to be compatible with foreign trade (Alavuotuni et al., 2019). However, there is a serious concern about VAT effectiveness particularly in developing nations with a huge informal sector (Emran & Stiglitz, 2005). In addition, imposing tax can distort economic activity and impede output growth, all of which hurt the overall economy (Mureșan et al., 2014; Smart & Bird, 2009; Toder & Rosenberg, 2010).
VAT in Nigeria, governed by the VAT Act Cap of 2004 (as amended), is a multi-stage tax borne by final consumers, and is paid on goods bought including services rendered. The uniform rate charged for VAT was 5% until the year 2020 when it was raised to 7.5% by the Finance Act 2019 that came into effect in February 2020. VAT is imposed/levied on every good and service whether imported or produced in Nigeria, excluding those exempted by the Act establishing it. Three (3) categories of tax-payers are required to deduct VAT at the source and remit the same to the tax body directly. The first group includes companies engaging in VATable transactions with non-resident businesses in Nigeria. The second consists of government ministries, agencies and statutory bodies, while the third category consists of companies that operate in the gas and oil sector (Federal Inland Revenue Service [FIRS], 2022).
Since its introduction, VAT has continued to be among the major sources of revenue for Nigeria’s government (Asogwa & Nkolika, 2013). Revenue generated from VAT increased during the period 1994–2021, except for a few years. For instance, from N5.02 billion in 1994, VAT collected increased to N65.01 billion in 2001, N186.48billion in 2006 and further to N333.98 billion in 2008. Thereafter, VAT revenue increased sharply to N656.84 billion in 2013, before declining to N655.71 billion and N642.91 billion in 2014 and 2015, respectively. The revenue collected from VAT resumed a rising trend to 669.55 billion in 2016, N959.56 billion in 2019 and further to N1,634.69 billion in 2021 (Figure 1).
Figure 1
Plots of Value Added Tax Revenue in Nigeria
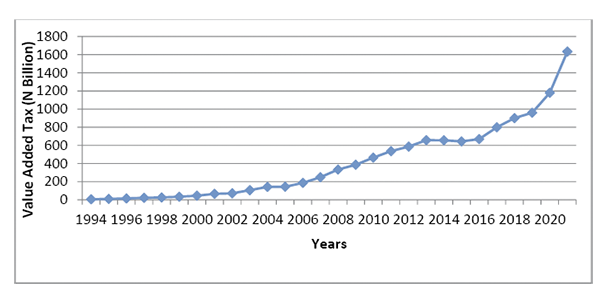
Source: Authors’ computation based on data collected from the Central Bank of Nigeria Bulletin (2022).
In terms of its share (or percentage) in total revenue, VAT contribution exhibited some fluctuations, rising in some years and declining in others during the period 1994–2021. The share of totally collected VAT rose from 2.48% in 1994 to 2.91% in 2001, 3.12% in 2006, and 4.24% in 2008. Whereas the contribution of VAT to total revenue increased to 6.73% in 2013, it declined to 6.51% in 2014 before rising to 9.30% in 2015. Although the share of VAT rose to 11.92% in 2016, it fell to 9.35% in 2019 before increasing to 15.19% in 2021 (Figure 2).
Figure 2
Plots of Value Added Tax Revenue Share in Total Revenue (%)
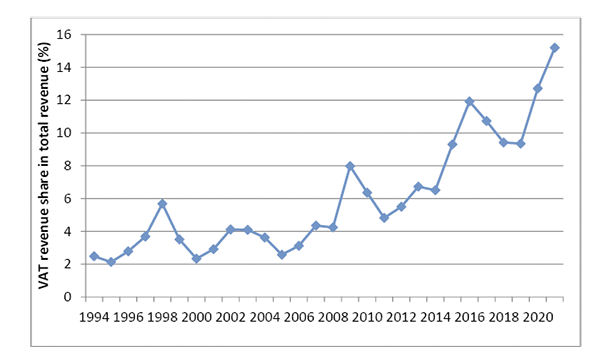
Note. Authors’ computation based on data collected from the Central Bank of Nigeria Bulletin (2022) and Federal Inland Revenue Service (2022).
The reform in the tax system and subsequent introduction of VAT in Nigeria has attracted the authors’ interest in empirically evaluating its impact on the economy. One variable whose response to VAT has been extensively studied is economic growth. Interestingly, most of the studies on the VAT-economic growth relation reported mixed outcomes. Some research found a negative influence of VAT on economic growth (Adefolake & Omodero, 2022; Bank-Ola, 2021; John & Dickson, 2020), while others established a positive effect of VAT on growth in Nigeria (Adebisi et al., 2020; Adejare, 2015; Adeusi et al., 2020; Etim et al., 2021).
Expectedly, revenue generated via VAT should be invested in a nation’s socio-economic infrastructures to raise productivity level, and consequently boost economic growth (Edame & Okoi, 2014; Muzurura & Sikwila, 2018). Thus, investment spending will rise. However, VAT may be a disincentive for investment if not properly handled (Njuru et al., 2013; Norgah, 1998). VAT is considered a deterrent to investment demand particularly if it raises the price of factor inputs like capital or machineries (Mureșan et al., 2014; Njuru et al., 2013; Toder & Rosenberg, 2010). The increased cost of these items translates to high production cost, which ultimately lowers domestic investment.
Whereas efforts have gone into research on VAT-domestic investment relation in Nigeria (Asogwa & Nkolika, 2013; Edame & Okoi, 2014; Uchime & Sunday, 2019), some of the studies have methodological problems inherent in them. For instance, the works of Asogwa and Nkolika (2013) and Uchime and Sunday (2019) used annual data less than thirty years (i.e., observations). This falls short of the minimum requirement for times series analysis. Also, Asogwa and Nkolika (2013) applied the OLS method even though the variables were a mixture of I(0) and I(1), while Edame and Okoi (2014) and Uchime and Sunday (2019) did not conduct stationarity test on the variables used in their research. Although the research by Yusuf and Mohd (2021) adopted a linear ARDL method, the non-linear ARDL (NARDL) is a more appropriate method as macroeconomic variables tend to have non-linear relations between them (Abu et al., 2022b). Besides, the conflicting empirical outcomes (from past studies on Nigeria) suggest that the VAT-domestic investment relation may be non-linear. Applying NARDL reveals how the dependent variable (domestic investment) responds to both positive shocks (increases) and negative shocks (decreases) in the explanatory variable of interest (i.e., VAT).
Thus, the primary goal of this research is to unravel the non-linear (asymmetric) influence of VAT on Nigeria’s domestic investment over the long-term. Following the introduction, the second part consists of literature review, and the third part is a theoretical framework alongside model specification. The fourth part is data and econometric methods, and the fifth part is results discussion. The last part concludes the study.
2. Literature Review
Tax is an essential tool governments employ in ensuring optimum resource allocation, checking inflationary pressure, correcting cyclical fluctuations, lowering income inequality, and boosting national savings and investment (Asogwa & Nkolika, 2013; Uchime & Anichibe, 2019). In the case of VAT, there are different opinions on its precise role in domestic investment. For instance, increasing VAT in an attempt to raise government revenue can result in increases in input prices, leading to higher production costs. The increased costs lower firms’ production capacity and result in less investment (Njuru et al., 2013). Like other forms of taxes, high VAT may result in rising commodity prices and declining purchasing power, and consequently less aggregate demand (Alesina & Ardagna, 1998; Alm & El-Ganainy, 2012). This in turn causes production to fall, leading to lower investment spending. However, if the revenue collected from VAT is deployed to provide socio-economic infrastructures that support production, it will boost domestic investment (Edame & Okoi, 2014; Muzurura & Sikwila, 2018).
Empirical research on VAT focuses more on its effect on the economy. Some studies evaluated the influence of VAT on growth at multi-country level. Acosta-Ormaechea and Morozumi (2021) reported that revenue-neutral increases in the VAT boost economic growth if raised via increase in c-efficiency, but it doesn’t if increased via increases in the standard rate in OECD countries. Alavuotunki et al. (2019) confirmed that VAT did not have a positive influence on government revenue, while VAT raised income-based inequality. Ahlerup et al. (2015) found that VAT introduction did not lead to increased revenues in African economies. Lee et al. (2013) established that VAT rarely affected government size in OECD nations. Ufier (2014) confirmed that VAT adoption lowered government expenditure and inflation, but raised both investment and growth across countries. Alm and El-Ganainy (2012) found that VAT dampens aggregate consumption in EU countries during the short-run and causes even greater reduction in the long-term. At a country specific level, Ayoub and Mukherjee (2019) established that VAT promotes economic growth in the Chinese economy.
Existing literature indicates that not much has been done to unravel domestic investment and VAT relation in Nigeria, while the few studies reported mixed findings. For example, Asogwa and Nkolika (2013) applied the OLS regression to explore VAT and domestic investment connection in Nigeria using short-span data and reported a strong positive relation between them. Using the ARDL to analyze yearly data over the period 1980–2010, Yusuf and Mohd (2021) submitted that indirect tax promotes domestic investment.
However, Edame and Okoi (2014) studied tax and domestic investment nexus from 1980 to 2010 using the OLS estimator and showed that domestic investment is a decreasing function of tax in Nigeria. In addition, using the OLS technique, Uchime and Sunday (2019) found an insignificant relation between VAT and domestic investment in Nigeria from 1995 to 2017. Elsewhere, studies have reported a positive connection between tax and domestic investment. In Zimbabwe, Muzurura and Sikwila (2018) indicated a positive relation between tax and domestic investment from 1998 to 2015 using the OLS method. Also, Tsehayu and Berhe (2020) discovered a strong positive relation between tax and domestic investment in the Ethiopian economy by applying an ARDL method to data covering the period 1982–2019. Table 1 reports a summary of related research.
Whereas the few studies on Nigeria deserve commendation, they have certain problems which the present research attempts to correct. First, existing studies (Asogwa & Nkolika, 2013; Uchime & Sunday, 2019) used inadequate data (less than thirty years/observations) in their analysis, and fell short of the basic requirement for time series analysis. In addition, they (Asogwa & Nkolika, 2013; Edame & Okoi, 2014; Uchime & Sunday, 2019) didn’t conduct relevant pre-estimation tests like unit root test and/or applied inappropriate methods. Moreover, the related studies on Nigeria focused on the period prior to 2021. Thus, our research adopts a more appropriate technique (i.e., NARDL) to estimate a long-term asymmetric (positive and negative shocks) impact of VAT on Nigeria’s domestic investment including performing pre-and-post estimation tests like unit root, stability and diagnostic tests. In addition, this research extends the studied period to 2021.
Table 1
Summary of Related Studies
|
Author(s) |
Country(ies)/ |
Method/ |
Findings |
|
Asogwa and Nkolika (2013) |
Nigeria (Not indicated) |
OLS |
VAT significantly and positively affects domestic investment. |
|
Adejare and Akande (2017) |
Nigeria (1994–2015) |
OLS |
VAT has a positive impact on domestic investment. |
|
Njuru et al. (2013) |
Kenya (1964–2010) |
VAR |
VAT has negative influence on domestic private investment. |
|
Edame and Okoi (2014) |
Nigeria (1980–2010) |
OLS |
Tax negatively influences domestic investment. |
|
Alawneh et al. (2015) |
Jordan (2000–2011) |
Regression analysis |
Tax has a negative effect on domestic investment. |
|
Muzurura and Sikwila (2018) |
Zimbabwe (1998–2015) |
OLS |
Tax collection has a strong positive impact on domestic investment. |
|
Tsehayu and Berhe (2020) |
Ethiopia (1982–2019) |
ARDL |
Tax incentive stimulates domestic investment. |
|
Uchime and Sunday (2019) |
Nigeria (1995–2017) |
OLS |
VAT has an insignificant positive influence on domestic investment. |
|
Yusuf and Mohd (2021) |
Nigeria (1980–2017) |
ARDL |
Indirect tax has a positive impact on domestic private investment. |
|
Yan and Lu (2013) |
China (2007–2011) |
Regression |
VAT expanded the scale of investment. |
Note. ARDL=Autoregressive Distributed Lag; OLS=Ordinary Least Squares; VAR=Vector Autoregression.
3. Methodology
3.1 Theoretical Framework
Economic theory suggests that if tax imposition results in affecting price of factor inputs (like raw materials, machineries or equipments), it will distort economic activity and impede output growth, all of which hurt overall economy (Mureșan et al., 2014; Smart & Bird, 2009; Toder & Rosenberg, 2010). Raising VAT to generate more revenue may increase the price (cost) of factor inputs and firms’ production cost. This in turn reduces producers’ capacity to maintain production level, and results in lower investment spending (Arene & Ndomadu, 1997; Njuru et al., 2013). Also, high VAT can put upward pressure on prices of goods and services, and lower domestic consumption via a decline in purchasing power of consumers (Alesina & Ardagna, 1998; Alm & El-Ganainy, 2012). The reduction in demand in turn forces firms to cut down production, leading to falling domestic investment.
However, some authors contended that increased revenue generated from VAT can be deployed to provision of more infrastructures which support production (Edame & Okoi, 2014; Muzurura & Sikwila, 2018), leading to higher domestic investment spending. Also, VAT collection can promote national savings, which in turn contributes to domestic investment (Dahri et al., 2019). These differing opinions suggest that changing VAT can either promote or discourage domestic investment. Thus, the domestic investment (INV) and value added tax (VAT) model is:
 (1)
(1)
Beside VAT, other potential drivers of domestic investment found in literature are credit to private sector (Ajide & Lawanson, 2012; Dang et al., 2020; Nurudeen, 2009), inflation rate (Aigheyisi, 2017; Clement & Achim, 2021; Tsehayu & Berhe, 2020), trade openness (Aigheyisi, 2017; Asogwa & Nkolika, 2013; Nurudeen, 2009), exchange rate (Ashraf & Herzer, 2014; Nurudeen, 2009; Wang, 2010; Yahia et al., 2018), lending rate (Ashraf & Herzer, 2014; Asogwa & Nkolika, 2013; Jude, 2018; Ngeendepi & Phiri, 2021; Nurudeen, 2009; Tsehayu & Berhe, 2020; Wang, 2010; Yahia et al., 2018), and households’ consumption expenditure.
For instance, at high lending rate (RATE), firms have to bear a high cost of borrowing to access funds for investment purposes. This in turn adds to production costs, leading to declining domestic investment.
Inflation rate (INF) can also affect domestic investment. Rising prices of inputs discourage investment demand and spending because it raises the cost of production. But mild inflation can be an incentive for businesses to invest more as they attempt to benefit from high prices which raise their profitability (Aigheyisi, 2017).
Moreover, exchange rate (EXCH) influences the level of domestic investment. An appreciation of the local currency raises demand for imported (foreign) products and consequently reduces consumption of locally produced products, leading to a reduction in domestic investment. But depreciation causes imports to be relatively expensive, prompting a decline in consumption of foreign products. Thus, demand for goods produced locally increases, pushing up investment spending as domestic firms make efforts to meet the increased demand for their goods.
Also, trade openness (TOP) can influence investment spending. For instance, favourable policies that lower barriers/restrictions to foreign trade encourage domestic investors to engage in production activities in the tradable sector due to increased access to international markets (Aigheyisi, 2017), while significant restrictions deter prospective investors and ultimately dampen domestic investment.
In addition, credit to private sector (CPS) can impact domestic investment. Increased access to credit raises firms’ capacity to acquire inputs and promote investment spending (Ajide & Lawanson, 2012; Dang et al., 2020). But reduced access to credit lessens producers’ ability to raise funds for investment purposes. Lastly, rising households’ consumption expenditure (HEXP) encourages firms to expand production, leading to a higher domestic investment. However, a decline in households’ consumption expenditure may force firms to cut production, resulting in lower domestic investment level.
Taking the variables highlighted above into account, the investment model is re-specified as:
 (2)
(2)
L is logarithm taken to reduce skewness including absolute values of variables to identical scale.
3.2 Data and Econometric Methods
Annual data were employed to estimate a long-term asymmetric relation between Nigeria’s VAT and domestic investment from 1994 to 2021. The period was chosen because the data on VAT is available from 1994 only. Thus the series (1994–2021) falls short of the basic requirement for time series analysis, which is thirty years (or observations). Moreover, having a large sample tends to give better representation of what is measured. To resolve this issue, a series of all variables were converted from yearly to quarterly data via the interpolation procedure (Gandolfo, 1981). The method requires that the starting and last year series (i.e., 1994 and 2021) are eliminated, leaving us with larger observations (1995:1–2020:4 or n=104) for analysis. Gandolfo’s technique is increasingly being employed in studies constrained by insufficient data (Abu et al., 2019, 2022a, 2022b; Baharumshah et al., 2006; Baharumshah & Rashid, 1999). Interestingly, the authors have echoed Smith’s (1998) suggestion that interpolated series rarely lead to any bias in estimates of cointegrating vectors with finite samples.
The data have been gathered from different sources. The data on credit to the private sector, lending and inflation rates, domestic investment, and households’ consumption expenditure were sourced from WDI (i.e., World Development Indicators). For VAT, exchange rate and openness, the data were sourced from the CBN (i.e., Nigeria’s Central Bank).
INV is proxied by gross fixed capital formation share in real GDP; TOP is the sum of exports and imports share in real GDP; CPS is domestic credit to private sector share in GDP; RATE is the lending rate at which commercial banks advance loans to businesses expressed in percentage; INF is the inflation rate, which measures changes in general price level expressed in percentage; VAT is the value added tax collected by federal, states and local governments; and HEXP is households’ consumption expenditure expressed in local currency. EXCH is the official exchange rate of the local currency, i.e., the Naira against the US dollars.
3.3 Unit Root Test
Prior to estimating VAT-domestic investment relation, a unit root (stationarity) test was done to guide against generating results that are meaningless. ADF (Augmented Dicker-Fuller) and PP (Phillips-Perron) tests were applied in ascertaining the unit root property of the series. The Dickey and Fuller (1979) equation is represented as:

yt denotes the series, and μt the disturbance term. The equation used to test the H0 (null hypothesis) is:
H0 : ρ = 0 (i.e., the series is non-stationary or has unit root).
The Phillips and Perron (1988) test serves as a complement to the ADF test. The H0 is not rejected where these tests’ statistic is smaller than any critical value (1%, 5% or 10%), while H0 is rejected if the statistic is larger than any critical value.
3.4 Non-ARDL Bounds Test Technique
The literature suggests that changes in VAT can either promote or discourage domestic investment in an economy. The few empirical studies on the connection between the variables in Nigeria reported mixed findings, suggesting the possibility of a non-linear relation between them. In evaluating the long-term asymmetric influence of VAT on domestic investment, the non-linear ARDL (NARDL) approach of Shin et al. (2014) is adopted. NARDL is the asymmetric extension of the linear ARDL model of Pesaran and Shin (1999) and Pesaran et al. (2001). Borrowing from Shin et al. (2014), we specify the asymmetric (non-linear) cointegrating relation between VAT (LVAT) and domestic investment (INV) alongside control variables as:
 (3)
(3)
β+ and β– denote associated long-term parameters, and LVATt is k×1 vector of regressor decomposed as:
 (4)
(4)
LVAT+t and LVAT–t denote partial sum that corresponds to positive and negative change/shock in LVATt generated via computing:
 (5)
(5)
 (6)
(6)
Thus, associating Equation 3 with the linear ARDL(p, q) model, the corresponding NARDL(p, q) model that expresses an asymmetric VAT and domestic investment relation is:

where θ+ = – ρβ+ and θ– = – ρβ– .
The execution of the NARDL procedure has three steps. It starts with estimating the NARDL(p, q) model in Equation 7 via standard OLS. Next step is testing the asymmetric (non-linear) cointegrating relation among INVt, LVATt+, LVATt–, RATEt, INFt, CPSt, EXCHt, TOPt and LHEXPt. The joint H0 of non existence of cointegration: ρ = θ+ = θ– = 0 in Equation 7 is subject to test via the bounds test of Pesaran et al. (2001) or Shin et al. (2014) based on a modified F-test. It has two critical bounds namely–upper bound [I(1)] and lower bound [I(0)], which are compared with the calculated F-statistic. The H0 is rejected if computed F-statistic is greater than the I(1), indicating presence of a long-term relation between these variables.
However, the H0 is accepted if F-statistic is smaller than the I(0), implying the absence of cointegration. In addition, the inference is adjudged inconclusive should the computed F-statistic lie between the upper bound and lower bound (Abu & Karim, 2021; Athanasenas et al., 2014). Moreover, the test of the existence of a long-term and/or short-term asymmetric relation is conducted via the standard Wald test. The H0 for a long-term asymmetry tested is –θ+ / ρ = –θ– / ρ. In the case of short-term asymmetry, the H0 tested is  .
.
3.5 Diagnostic and Stability Tests
Diagnostic and stability (i.e., post-estimation) tests are conducted to assess the validity of the results. Thus, the Breusch-Godfrey’s serial-correlation test was done to assess if residuals are correlated, and Breusch-Pagan-Godfrey’s heteroscedasticity test to check whether error terms are homoscedastic or not. The Ramsey RESET was done to evaluate if the estimated model has been specified correctly.
The stability test was done by applying the cumulative sum of recursive residuals (CUSUM) and the cumulative sum of squares of recursive residuals (CUSUMS) tests. Should CUSUMS plots break outside the lower or upper bound, the estimated model and parameters are considered not stable over the long term (Greene, 2003).
4. Discussion of Results
4.1 Results of Unit Root Tests
Unit root test results (Table 2) reveal that variables including INV, LVAT, RATE, CPS, EXCH, TOP, and LHEXP are non-stationary, but become stationary after they are differenced to order one [I(1)]. However, INF is stationary at level [I(1)].
Table 2
Results of Unit Root Test
|
|
ADF |
PP |
||
|
Variable |
Level |
1st diff. |
Level |
1st diff. |
|
INV |
-1.4343 |
-3.2957** |
-1.5556 |
-4.5343*** |
|
LVAT |
-2.4050 |
-3.4165** |
-2.6822 |
-4.6499*** |
|
RATE |
-1.3941 |
-4.5496*** |
-1.1709 |
-4.9374*** |
|
INF |
-4.5889*** |
- |
-6.2197*** |
- |
|
CPS |
-2.7330 |
-3.9984*** |
-2.0111 |
-4.3601*** |
|
EXCH |
-0.4104 |
-3.9177*** |
-0.9982 |
-4.4867*** |
|
TOP |
-0.8903 |
-4.4703*** |
-0.9623 |
-4.8325*** |
|
LHEXP |
-1.2443 |
-4.1573*** |
-1.6673 |
-5.4913*** |
Note. ** and *** indicate a rejection of the null hypothesis of no unit root at the 5% level and 1% level, respectively.
Having found the series to be a mixture of I(0) and I(1), there is justification for performing bounds tests to cointegration to ascertain the presence (or otherwise) of a long-term relation among VAT, domestic investment and the control variables.
4.2 NARDL Bounds Test to Cointegration and Asymmetric Test Results
The NARDL bounds test to cointegration result (Table 3) suggests that the calculated F-statistic (3.8519) is larger than the upper critical bound (3.77) at 1%.
Thus, it can be concluded that a long-term relation exists among the variables under consideration. In addition, the asymmetric test result signals that a long-term asymmetric relation exists between VAT and domestic investment.
Table 3
Results of NARDL Bounds Test to Cointegration and Asymmetric Test
|
Bounds test: |
||||
|
|
Critical values bounds |
|||
|
F-stat. = 3.8519*** |
|
I(0) |
I(1) |
|
|
|
10% |
1.85 |
2.85 |
|
|
|
5% |
2.11 |
3.15 |
|
|
|
1% |
2.62 |
3.77 |
|
|
Long-run asymmetric test |
||||
|
χ2 |
24.8791*** |
|||
Note. *** denotes statistical significance at the 1% level and a rejection of the null hypothesis of no cointegration and/or a long-run asymmetry.
4.3 Results of NARDL Estimation
The results (Table 4) show that the optimum lag length of the NARDL model is: 3,0,0,0,3,3,1,3,1. A positive change (an increase) in VAT causes domestic investment to decrease by 0.47% in the long-term at 1%, while a negative change (a decrease) in VAT has an insignificant influence on domestic investment in the long term. The significant negative relation between VAT and domestic investment is consistent with studies on Nigeria (Edame & Okoi, 2014). A similar finding has been reported by Njuru et al. (2013) in a developing nation like Kenya.
In addition, increasing lending rate (RATE) by 1% in the long term reduces domestic investment by 1.03% at 1%. The significant negative impact of lending rate on domestic investment is in line with research by Asogwa and Nkolika (2013), who reported a decreasing effect of interest rate on domestic investment in Nigeria. Similarly, Clement and Achim (2021) found that a rising lending rate discourages investment spending.
Moreover, raising the inflation rate by 1% causes domestic investment to decline by 0.21% at 1% in the long term. This outcome supports the study of Aigheyisi (2017) that domestic investment reduces following an increase in inflation rate in Nigeria. Also, Clement and Achim (2021) indicated that domestic investment falls with rising inflation.
Furthermore, boosting credit to the private sector (CPS) by 1% leads to 0.67% increase in domestic investment at 1% in the long term. This outcome aligns with the research of David et al. (2020) on Nigeria. Other studies that found similar results include Dang et al. (2020).
In addition, an increase in the exchange rate (depreciation in the local currency) by 1% leads to a 0.10% increase in domestic investment at 1% in the long term. The positive and significant relation between depreciation and domestic investment supports the study of Nurudeen (2009), Asogwa and Nkolika (2013), and Adejare and Akande (2017) on Nigeria.
Furthermore, increasing trade openness (TOP) by 1% raises domestic investment by 0.38% at 1% in the long term. The positive and significant influence of TOP on domestic investment lends support to research on Nigeria (Asogwa & Nkolika, 2013). Similarly, Nyinawumuntu et al. (2022) established a significant positive impact of trade openness on domestic investment in Sub-Saharan Africa. Also, boosting household consumption expenditure (LHEXP) by 1% increases domestic investment by 0.34% at 1%. The short-run results (although not the focus of this research) indicate that inflation has an insignificant negative relation with domestic investment, while credit to the private sector has a strong positive influence on domestic investment. Moreover, raising private sector credit causes domestic investment to increase by 0.43% in the short term. The coefficient of ECT-1 (i.e., error correction term) lagged by one period is -0.17 and significant at the 1% level. This demonstrates that 17% of deviation due to shock is corrected in the fourth quarter.
Table 4
Results of the NARDL Model Estimation (D.V = ΔINV)
|
Short-run coefficients |
Long-run coefficients |
||||
|
Regressor |
Coeff./Se |
ρ-value |
Regressor |
Coeff./Se |
ρ-value |
|
ΔINV-1 |
0.4303*** (0.0880) |
0.0000 |
Constant |
-95.0448** (38.2998) |
0.0152 |
|
ΔINV-2 |
0.2262** (0.0876) |
0.0117 |
LVAT+ |
-47.2256*** (6.2919) |
0.0000 |
|
ΔINF |
-0.0382 (0.0233) |
0.1052 |
LV– |
41.4016 (47.9713) |
0.3908 |
|
ΔINF-1 |
0.0461* (0.0269) |
0.0915 |
RATE |
-1.0345*** (0.3109) |
0.0013 |
|
ΔINF-2 |
0.0525** (0.0245) |
0.0356 |
INF |
-0.2137*** (0.0665) |
0.0019 |
|
ΔCPS |
0.4324*** (0.1210) |
0.0006 |
CPS |
0.6794*** (0.2151) |
0.0023 |
|
ΔCPS-1 |
-0.2921** (0.1367) |
0.0358 |
EXCH |
0.1063*** (0.0147) |
0.0000 |
|
ΔCPS-2 |
-0.2698** (0.1228) |
0.0311 |
TOP |
0.3867*** |
0.0002 |
|
ΔEXCH |
-0.0068 (0.0072) |
0.3485 |
LHEXP |
34.5049*** (11.9806) |
0.0051 |
|
ΔTOP |
-0.0424 (0.0390) |
0.2810 |
|
|
|
|
ΔTOP-1 |
-0.0466 (0.0443) |
0.2967 |
|
|
|
|
ΔTOP-2 |
-0.0628 (0.0403) |
0.1232 |
|
|
|
|
ΔLHEXP |
-1.7960 (2.6760) |
0.5041 |
|
|
|
|
ECT-1 |
-0.1745*** (0.0266) |
0.0000 |
|
|
|
|
|
|||||
|
Diagnostic tests results |
|||||
|
Test |
Results |
||||
|
Serial-correlation: χ2 |
2.7944(0.4244) |
||||
|
Heteroscedasticity: χ2 |
25.5976(0.2694) |
||||
|
Specification: Ramsey RESET |
0.2107(0.6474) |
||||
Note. *, **, and *** indicate statistical significance at 1%, 5% and 1% levels, respectively. Δ is the first difference operator. Values in parentheses are standard errors.
Figure 3
Plots of CUSUM
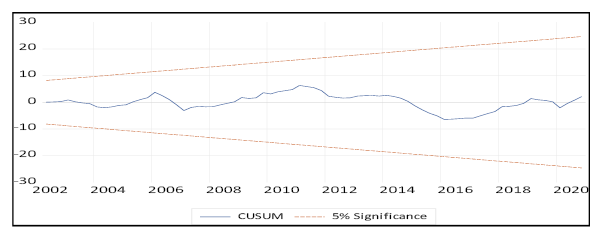
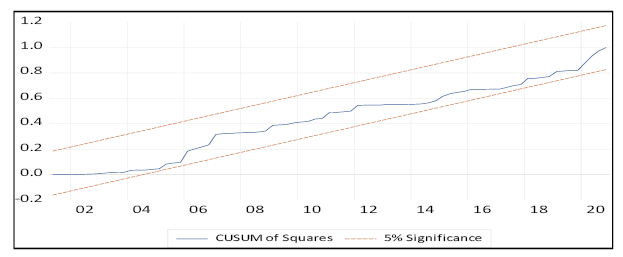
Figure 4
Plots of CUSUMS
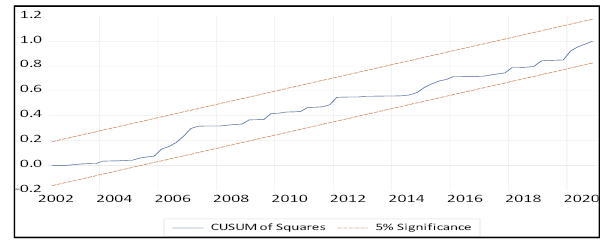
The results of diagnostics or post-estimation tests imply that serial correlation is not a problem in the estimates because the test statistic is 2.65 with a corresponding probability of 0.26. Similarly, the residuals are homoscedastic since the test statistic is 25.49 with a corresponding probability of 0.26. Also, the Ramsey specification error test statistic is 0.21 with a probability of 0.64, indicating an absence of specification error. The results of the CUSUM and CUSUMS tests (Figure 3 and Figure 4) imply that the plots fall within the boundaries. Thus, the model and estimated parameters are stable over the long term.
4.4 Results of the ARDL Bounds Test to Cointegration Test
In an attempt to check for robustness of the results of the NARDL model, we estimated the linear relation between VAT and domestic investment using the linear ARDL method. The bounds test to cointegration result (Table 5) suggests that the calculated F-statistic (3.0956) is larger than the upper critical bound (2.89) at 10%.
Table 5
Results of ARDL Bounds Test to Cointegration Test
|
Bounds test: Function = f(INV ⁄ LVAT, RATE, INF, CPS, TOP, EXCH, LHEXP) |
|||
|
|
Critical values bounds |
||
|
F-stat. = 3.0956*** |
|
I(0) |
I(1) |
|
|
10% |
1.92 |
2.89 |
|
|
5% |
2.17 |
3.21 |
|
|
1% |
2.73 |
3.90 |
Note. *** denotes statistical significance at the 1% level and a rejection of the null hypothesis of no cointegration.
4.5 Results of ARDL Estimation
The ARDL results (Table 6) show that the optimum lag length of the ARDL model is: 3,0,0,2,2,1,1,1. The long-term results portray that an increase in VAT by 1% reduces domestic investment by 0.45% at 1%. Also, raising lending rate by 1% reduces long-term domestic investment by 0.80% to 10%. Furthermore, if credit to private sector increases by 1%, it will raise long-term domestic investment by 0.57% to 5%. Moreover, depreciation in the local currency by 1% causes long-term domestic investment to increase by 0.10% to 1%. Besides, increasing trade openness (TOP) by 1% increases long-term domestic investment by 0.32% to 5%.
The results of diagnostics tests show that the serial correlation test statistic is 1.31 with a corresponding probability of 0.51. Also, the homoscedasticity test statistic is 20.80 with a corresponding probability of 0.23. These findings suggest the absence of serial correlation and heteroscedasticity problems in the estimates. The Ramsey specification error test statistic is 1.81 with a probability of 0.27, implying an absence of specification error. The results of the CUSUM and CUSUMS tests (Figure 5 and Figure 6) show that plots fall within the boundaries. Thus, the model and its estimated parameters are stable during the long term.
Table 6
Results of the ARDL Model Estimation (D.V = Δ INV)
|
Short-run coefficients |
Long-run coefficients |
||||
|
Regressor |
Coeff./Se |
ρ-value |
Regressor |
Coeff./Se |
ρ-value |
|
ΔINV-1 |
0.4691*** (0.0894) |
0.0000 |
Constant |
-48.9859*** (46.5993) |
0.2962 |
|
ΔINV-2 |
0.1635* (0.0883) |
0.0678 |
LVAT |
-45.1967*** (9.0283) |
0.0000 |
|
ΔINF |
-0.0156 (0.0238) |
0.5155 |
RATE |
-0.8081* (0.4091) |
0.0516 |
|
ΔINF-1 |
0.0455* (0.0242) |
0.0637 |
INF |
-0.1547 (0.0957) |
0.1101 |
|
ΔCPS |
0.3384*** (0.1228) |
0.0072 |
CPS |
0.5705** (0.2820) |
0.0463 |
|
ΔCPS-1 |
-0.3332*** (0.1209) |
0.0072 |
EXCH |
0.1067*** (0.0211) |
0.0000 |
|
ΔEXCH |
-0.0091 (0.0074) |
0.2253 |
TOP |
0.3238** (0.1353) |
0.0190 |
|
ΔTOP |
-0.0763** (0.0351) |
0.0326 |
LHEXP |
23.1328 (15.1148) |
0.1297 |
|
ΔLHEXP |
-3.3354 (2.7307) |
0.2254 |
|
|
|
|
ECT-1 |
-0.1187*** (0.0214) |
0.0000 |
|
|
|
|
Diagnostic tests results |
|||||
|
Test |
Results |
||||
|
Serial-correlation: χ2 |
1.3164(0.5178) |
||||
|
Heteroscedasticity: χ2 |
20.8018(0.2353) |
||||
|
Specification: Ramsey RESET |
1.1878(0.2790) |
||||
Note. *, **, and *** indicate statistical significance at 1%, 5% and 1% levels, respectively. Δ is the first difference operator. Values in parentheses are standard errors.
Figure 5
Plots of CUSUM
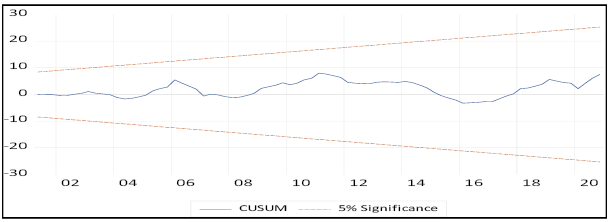
Figure 6
Plots of CUSUMS
Comparing both non-linear ARDL (NARDL) and linear ARDL models, the coefficient of the interest variable (i.e., VAT) –47.22 (–0.47%) and –45.19 (–0.45%), respectively. This suggests consistency and robustness of the results. Moreover, all six control variables in the NARDL model turn out significant with expected signs compared to four in the ARDL model.
Some implications can be drawn from these findings. The negative relation between VAT and domestic investment implies that if prices of factor inputs like machineries rise due to VAT imposition, it will translate to increased production cost, which forces firms to cut or lower production. The decline in output leads to a reduction in domestic investment. Also, the negative influence of rising inflation and lending rates implies that domestic investment level will fall because increases in both rates contribute to high production cost, which in turn pushes down output level and ultimately domestic investment spending.
The positive relation between credit to the private sector and domestic investment suggests that increased access of businesses to loans or finance raises their capacity to acquire more production inputs, resulting in higher domestic investment. In addition, the positive influence of depreciation of the local currency on domestic investment demonstrates that the decline in demand for foreign products and consequent increase in demand for locally produced goods (due to depreciation and lower purchasing power) encourages domestic production and investment spending.
Furthermore, the positive impact of openness on domestic investment illustrates that fewer restrictions (and favourable trade policies) increase local producers’ access in the tradable sector of an economy to foreign markets, thus boosting domestic investment. More so, the positive relation between households’ consumption expenditure and domestic investment implies that increases in households’ consumption spending raises demand for goods and services. To meet the increased demand, firms have to expand production, which in turn boosts domestic investment.
5. Conclusion
The primary goal of this research is to explore the long-term asymmetric influence of VAT on domestic investment in Nigeria using the NARDL method to analyze quarterly data for the period 1994–2021. Long-term and asymmetric relations were found between the variables. The estimates reveal that a positive shock (an increase) in VAT lessens long-term domestic investment, while a negative shock has an insignificant impact on domestic investment level in the long term. This outcome supports the view that increasing revenue collection via VAT can put upward pressure on prices of production inputs. This in turn will raise production costs, which reduces the capacity of domestic firms to maintain their output level, leading to lower investment spending. The finding also aligns with the argument that VAT can reduce consumption and aggregate demand. Consequently, firms’ output level will decline, leading to falling domestic investment. In addition, factors including inflation and lending rates have a long-term dampening impact on domestic investment, while credit to private sector, openness to trade, exchange rate depreciation, and households’ consumption expenditure have a long-term positive influence on domestic investment. Given the empirical outcomes, the following recommendations have been proffered.
First, since VAT has a negative influence on domestic investment, government and policy makers are advised to ensure that VAT imposition and/or collection is carried out in a manner that does not discourage both existing and prospective investors. There is no doubt that tax collection is at the core of revenue generation for governments in most advanced societies, but in developing countries like Nigeria where standard of living is very low, imposing tax and/or raising tax rate remains an unpopular government policy. Therefore, the government needs to devise an efficient and effective means of collecting tax without necessarily impacting investment negatively.
Second, the monetary authorities should take steps in checking rising inflation and lending rates, which have hindered growth of domestic investment over the years.
Third, whereas further depreciation will worsen Nigeria’s economic crisis, ensuring exchange rate stability will lessen uncertainty surrounding the business environment, leading to higher domestic investment.
Fourth, the government should put in place policies that promote foreign trade in order to increase the access of domestic producers to foreign markets. This will encourage local production and consequently lead to higher domestic investment.
Fifth, efforts should be directed towards boosting households’ consumption. The improved demand by consumers for goods and services will result in high investment spending by producers who attempt to match the households’ demand.
Although this research has provided insight on the impact of VAT on domestic investment in a developing economy like Nigeria, future studies can improve on ours by examining the effect of VAT on macroeconomic variables such as savings, inflation, and inequality, amongst others. In addition, future research should employ different estimation methods to check for consistency and robustness in generated results.
References
Abu, N., Kadandani, B., Obi, B., & Modibbo, M. (2019). How Does Pensions Affect Savings in Nigeria? Evidence from Quarterly Data. Scientific Annals of Economics and Business, 66(4), 541–558. DOI: 10.2478/saeb-2019-0038
Abu, N., David , J., Sakanko, M. A., & Amaechi, B-O. O. (2022a). Oil Price and Public Expenditure Relationship in Nigeria: Does the Level of Corruption Matter? Economic Studies (Ikonomicheski Izsledvania), 31(3), 59–80.
Abu, N., & Karim M. Z. A. (2021). Is the Relationship between Corruption and Domestic Investment Non-linear in Nigeria? Empirical Evidence from Quarterly Data. Estudios de Economia Aplicada, 39(3), 1–18. DOI: http://dx.doi.org/10.25115/eea.v39i3.3953
Abu, N., Karim, M. Z. A., David, J., Sakanko, M. A., Ben-Obi, O. A., & Gamal, A. A. M. (2022b). The Behaviour of Tax Revenue amid Corruption in Nigeria: Evidence from the Non-linear ARDL Approach. Economic Studies (Ikonomicheski Izsledvania), 31(4), 55–76.
Acharya, S. (2016). Reforming Value Added Tax System in Developing World: The Case of Nepal. Business and Management Studies, 2(2), 44–63.doi:10.11114/bms.v2i2.1616
Acosta-Ormaechea, S., & Morozumi, A. (2021). The Value-Added Tax and Growth: Design Matters. International Tax and Public Finance, 28, 1211–1241. https://doi.org/10.1007/s10797-021-09681-2
Adebisi, J. F., Ibrahim, M., & Abdullahi, N. A. (2020). Company Income Tax, Value Added Tax, Personal Income Tax and Economic Growth in Nigeria. Journal of Taxation and Economic Development, 19(1), 1–14.
Adefolake, A. O., & Omodero, C. O. (2022). Tax Revenue and Economic Growth in Nigeria. Cogent Business & Management, 9(1), 2115282. DOI: 10.1080/23311975.2022.2115282
Adejare, T. (2015). The Analysis of the Effect of Corporate Income Tax (CIT) on Revenue Profile in Nigeria. American Journal of Economics, Finance and Management, 1(4), 312–319.
Adejare, A. T., & Akande, S. S. (2017). The Impact of Value Added Tax on Private Investment in Nigeria. Account and Financial Management Journal, 2(4), 644–651. DOI: 10.18535/afmj/v2i4.03
Adeusi, A. S., Uniamikogbo, E., Erah, O. D., & Aggreh, M. (2020). Non-oil Revenue and Economic Growth in Nigeria. Research Journal of Finance and Accounting, 11(8), 95–106. https://doi.org/10.7176/ RJFA/11-8-10
Aigheyisi, O. S. (2017). The Effect of Foreign Direct Investment on Domestic Investment in Nigeria: Any Role for Financial Development and Human Capital? Amity Journal of Economics, 2(2), 1–20.
Aigheyisi, O. S. (2022). Foreign Direct Investment, Trade Openness and Industrial Sector Employment in Nigeria. DBN Journal of Economics and Sustainable Growth, 5(1), 1–24.
Aizenman, J., & Jinjarak, Y. (2005). The Collection Efficiency of the Value Added Tax: Theory and International Evidence. (NBER Working Paper, 11539). https://www.nber.org/papers/w11539
Ahlerup, P., Baskaran, T., & Bigsten, A. (2015). Tax Innovations and Public Revenues in Sub-Saharan Africa. Journal of Development Studies, 51(6), 689–706. doi:10.1080/00220388.2014.997223
Ajide, K. B., & Lawanson, O. (2012). Modelling the Long Run Determinants of Domestic Private Investment in Nigeria. Asian Social Science, 8(13), 139–152. doi:10.5539/ass.v8n13p139
Alavuotunki, K., Haapanen, M., & Pirttilä, J. (2019). The Effects of the Value-Added Tax on Revenue and Inequality. Journal of Development Studies, 55(4), 490–508. DOI:10.1080/00220388.2017.1400015
Alesina, A., & Ardagna, S. (1998). Tales of Fiscal Adjustment. Economic Policy, 13(27), 489–585. http://dx.doi.org/10.1111/1468-0327.00039
Alm, J., & El-Ganainy, A. (2012). Value-Added Taxation and Consumption. (Working Papers, 1203). Tulane University, Department of Economics.
Alwahneh, A. M., Al-Fawwaz, T. M., & Shawaqfeh, G. N. (2015). The Impact of the Fiscal and Quantitative Monetary Policies on the Domestic and Foreign Direct Investment in Jordan: An Empirical Study. International Journal of Academic Research in Accounting, Finance and Management Sciences, 5(4), 1–10.
Arene, C. J., & Ndomadu, S. O. (1997). Impact of Value-Added Tax on the Capital Structure and Profitability of Premier Breweries Plc, Nigeria. Vikalpa, 22(3), 71–77. https://doi.org/10.1177/0256090919970307
Ashraf, A., & Herzer, D. (2014). The Effects of Greenfield Investment and M&As on Domestic Investment in Developing Countries. Applied Economics Letters, 21(14), 997–1000. DOI:10.1080/13504851.2014.904482
Asogwa, F. O., & Nkolika, O. M. (2013). Value Added Tax and Investment Growth in Nigeria: Time Series Analysis. IOSR Journal of Humanities and Social Science, 18(1), 28–31.
Athanasenas, A., Katrakilidis, C., & Trachanas, E. (2014). Government Spending and Revenues in the Greek Economy: Evidence from Nonlinear Cointegration. Empirica, 41(2), 365–376. DOI 10.1007/s10663-013-9221-3
Ayoub, Z., & Mukherjee, S. (2019). Value Added Tax and Economic Growth: An Empirical Study of China Perspective. Signifikan: Jurnal Ilmu Ekonomi, 8(2), 235–242.
Baharumshah, A. Z., Lau, E., & Khalid, A. M. (2006). Testing Twin Deficits Hypothesis Using VARs and Variance Decomposition. Journal of the Asia Pacific Economy, 11(3), 331–354.
Baharumshah, A. Z., & Rashid, S. (1999). Export, Imports and Economic Growth in Malaysia: Empirical Evidence Based on Multivariate Time Series. Asian Economic Journal, 13(4), 389–406.
Bank-Ola, R. F. (2021). Value Added Tax Administration and Economic Growth in Nigeria. Global Journal of Education, Humanities and Management Sciences, 3(1), 88–106.
Bird, R. D. (2005). Value-Added Taxes in Developing and Transitional Countries: Lessons and Questions. Paper prepared for the first global international tax dialogue conference on VAT, Rome, March 15th-16th, 2005.
Bird, R. M. (2010). Taxation and Development. Washington, DC: World Bank.
Bird, R. M., & Gendron, P.-P. (2007). The VAT in Developing and Transitional Countries. New York, NY: Cambridge University Press.
Clement, S., & Achim, M. V. (2021). Selected Factors Influencing Domestic Investment in the European Union. 21st RSEP International Economics, Finance & Business Conference- Virtual/Online 19–20 May 2021, HCC. St. Moritz Hotel, Barcelona, Spain, 31–38.
Dahri, S. H., Shaikh, N. A., & Shah, P. (2019). Pak-Japan Comparative Study of Consumption Tax (Value Added Tax) and its Effects on Economic Growth Rate and Gross Savings. Journal of Economics and Political Economy, 6(3), 295–303.
Dang, T. T., Pham A. D., & Tran, D. N. (2020). Impact of Monetary Policy on Private Investment: Evidence from Vietnam’s Provincial Data. Economies, 8(70), 1–15. doi:10.3390/economies8030070
David, J., Sakanko, M. A., & Obilikwu, J. (2020). The Determinants of Domestic Investment in Nigeria: A New Evidence from the Non Linear Autoregressive Distributed Lag (NARDL) Model. Economics and Management, XVІІ(2), 1–25.
Dickey, D. A., & Fuller, W. A. (1979). Distribution of the Estimators for Autoregressive Time Series with a Unit Root. Journal of the American Statistical Association, 74(366a), 427–431.
Edame, G. E., & Okoi, W. W. (2014). The Impact of Taxation on Investment and Economic Development in Nigeria. Academic Journal of Interdisciplinary Studies, 3(4), 209–218. Doi:10.5901/ajis.2014.v3n4p209
Emran, M. S., & Stiglitz, J. E. (2005). On Selective Indirect Tax Reform in Developing Countries. Journal of Public Economics, 89, 599–623. doi:10.1016/j.jpubeco.2004.04.007
Etim, O. E., Nsima, J. U., Austin, U. N., Samuel, S. C., & Anselem, M. U. (2021). Comparative Analysis of the Effect of Direct and Indirect Taxation Revenue on Economic Growth of Nigeria. Account and Financial Management Journal, 6(7), 2403–2418. https://doi. org/10.47191/afmj/v6i7.05
Federal Inland Revenue Service (2022). Value Added Tax. https://www.firs.gov.ng/value-added-tax-vat/ (Accessed on the 28th July, 2022).
Fjeldstad, O. H. (2003). Fighting Fiscal Corruption: Lessons from the Tanzania Revenue Authority. International Journal of Management Research and Practice, 23(2), 165–175.
Gandolfo, G. (1981). Quantitative Analysis and Econometric Estimation of Continuous Time Dynamic Models. Amsterdam: North-Holland.
Greene, W. (2003). Econometric Analysis (5th ed.). New Jersey: Prentice Hall.
John, O. A., & Dickson, O. E. (2020). Tax Revenue and Economic Growth in Nigeria. Journal of Taxation and Economic Development, 19(1), 15–34.
Jude, C. (2018). Does FDI Crowd Out Domestic Investment in Transition Countries? Economics of Transition, 0(0), 1–38. DOI: 10.1111/ecot.12184
Lee, D., Kim, D., & Borcherding, T. E. (2013). Tax Structure and Government Spending: Does the Value-Added Tax Increase the Size of Government?. National Tax Journal, 66, 541–570. doi:10.17310/ntj.2013.3.02
Micah, L. C., Ebere, C., & Umobong, A. A. (2012). Tax System in Nigeria –Challenges and the Way Forward. Research Journal of Finance and Accounting, 3(5), 9–15.
Momoh, Z. (2018). Federal Inland Revenue Service (FIRS) and Tax Compliance in Nigeria: Challenges and Prospects. International Journal of Multidisciplinary Research and Publications, 1(4), 18–22.
Mureșan, M., David, D., Ladislau, E. L. E. K., & Dumiter, F. (2014). Value Added Tax Impact on Economic Activity: Importance, Implication and Assessment–The Romanian Experience. Transylvanian Review of Administrative Sciences, 10(SI), 131–151.
Muzurura, J., & Sikwila, N. (2018). Taxation, Private Fixed Domestic Investment Behaviour and Zimbabwe’s Economic Growth. American Journal of Humanities and Social Sciences Research, 2(5), 26–39. https://ajhssr.com/wp-content/uploads/2018/05/D18252639.pdf.
Ngeendepi, E., & Phiri, A. (2021). Do FDI and Public Investment Crowd In/Out Domestic Private Investment in the SADC Region? Managing Global Transitions, 19(1), 3–25.
Njuru S. G., Ombuki, C., Wawire, N., & Okeri, S. (2013). Taxation and Private Investment: Evidence for Kenya. International Journal of Economics and Management Sciences, 2(11), 78–93.
Norgah, J. H. (1998). Tax policy and foreign direct investment in Ghana. MBA Long essay, University of Ghana, Legon.
Nurudeen, A. (2009). Modeling the Long-Run Determinants of Private Investment in Nigeria. IUP Journal of Financial Economics, 7(3&4), 48–63.
Nyinawumuntu, E., Makala, U. E., & Han, F. (2022). Impact of Trade Openness on Domestic Investment in Sub-Saharan Africa. Open Access Library Journal, 9, e9171. DOI: 10.4236/oalib.1109171
Pesaran, M. H., & Shin, Y. (1999). An Autoregressive Distributed Lag Modeling Approach to Cointegration Analysis. In S. Strom (Ed.), Econometrics and Economic Theory in the 20th Century (pp. 371–413). The Ragnar Frisch centennial symposium econometric society monographs (No. 31). Cambridge: Cambridge University Press.
Pesaran, M. H., Shin, Y., & Smith, R. (2001). Bound Testing Approaches to the Analysis of Level Relationship. Journal of Applied Econometrics, 16(3), 289–326.
Phillips, P. C., & Perron, P. (1988). Testing for a Unit Root in Time Series Regression. Biometrika, 75(2), 335–346.
Salami, A. (2011). Taxation, Revenue Allocation and Fiscal Federalism in Nigeria: Issues, Challenges and Policy Options. Economic Annals, 56(189), 27–50.
Shin, Y., Yu, B., & Greenwood-Nimmo, M. (2014). Modelling Asymmetric Cointegration and Dynamic Multipliers in a Nonlinear ARDL Framework. Festschrift in honor of Peter Schmidt. Springer, New York, NY, рр. 281–314.
Smart, M., & Bird, R. M. (2009). The Impact on Investment of Replacing a Retail Sales Tax by a Value-Added Tax: Evidence from Canadian Experience. National Tax Journal, 62(4), 591–609.
Smith, S. F. (1998). Cointegration Tests When Data Are Linearly Interpolated. (Unpublished Paper), State University of New York at Albany.
Toder, E., & Rosenberg, J. (2010). Effects of Imposing a Value-added Tax to Replace Payroll Taxes or Corporate Taxes.(Report). Tax Policy Center: Urban Institute and Brookings Institution.
Tsehayu, G. T., & Berhe, W. T. (2020). The Effect of Tax Incentive on Domestic Investment in Ethiopia: ARDL Approach. Research Journal of Finance and Accounting, 11(5), 70–80.
Uchime, H. N., & Sunday, A. A. (2019). Effect of Taxation on Domestic Investment in Nigeria. International Journal of Economics, Business and Management Studies, 6(1), 96–104. DOI: 10.20448/802.61.96.104
Ufier, A. (2014). Quasi-Experimental Analysis on the Effects of Adoption of a Value Added Tax. Economic Inquiry, 52, 1364–1379. doi:10.1111/ecin.12099
Wang, M. (2010). Foreign Direct Investment and Domestic Investment in the Host Country: Evidence from Panel Study. Applied Economics, 42(29), 3711–3721. DOI: 10.1080/00036840802314580
Yahia, Y. E., Haiyun, L., Khan, M. A., Shah, S. S. H., & Islam, M. A. (2018). The Impact of Foreign Direct Investment on Domestic Investment: Evidence from Sudan. International Journal of Economics and Financial Issues, 8(6), 1–10. DOI: 10.32479/ijefi.6895
Yan, J., & Lu, Q. (2013). Theoretical Analysis and Empirical Analysis of the Effect of Transformation of VAT on Fixed Assets Investment Based on the Data of Jiang-Su Listed Companies. Asian Journal of Business Management, 5(4), 358–361.
Yusuf, A., & Mohd, S. (2020). The Impact of Fiscal Policy Variables on Private Investment in Nigeria. https://doi.org/10.21203/rs.3.rs-98376/v1
Appendix
Quarterly Data Used
|
YR |
INV |
LVAT |
RATE |
INF |
CPS |
EXCH |
TOP |
LHEXP |
|
1995 |
9.591754 |
0.225348 |
5.0875 |
19.04645 |
1.723829 |
5.471525 |
1.719924 |
3.267388 |
|
1995 |
9.354098 |
0.241665 |
5.069583 |
19.10651 |
1.646954 |
5.471525 |
2.033418 |
3.269609 |
|
1995 |
9.182655 |
0.256131 |
5.049375 |
18.23891 |
1.58874 |
5.471525 |
2.251981 |
3.272738 |
|
1995 |
9.077426 |
0.268747 |
5.026875 |
16.44363 |
1.549188 |
5.471525 |
2.375615 |
3.276776 |
|
1996 |
9.107659 |
0.275048 |
5.060612 |
10.50975 |
1.528448 |
5.471525 |
2.156038 |
3.28764 |
|
1996 |
9.107156 |
0.285749 |
5.010117 |
8.143499 |
1.526157 |
5.471525 |
2.189124 |
3.291125 |
|
1996 |
9.145166 |
0.296386 |
4.933919 |
6.133948 |
1.542465 |
5.471525 |
2.226592 |
3.29315 |
|
1996 |
9.22169 |
0.306958 |
4.832018 |
4.481097 |
1.577374 |
5.471525 |
2.268443 |
3.293716 |
|
1997 |
9.42166 |
0.320397 |
4.545202 |
3.209316 |
1.687825 |
5.471525 |
2.450763 |
3.288669 |
|
1997 |
9.541237 |
0.329667 |
4.455579 |
2.260116 |
1.737157 |
5.471525 |
2.446943 |
3.287975 |
|
1997 |
9.665354 |
0.337702 |
4.403939 |
1.657869 |
1.782314 |
5.471525 |
2.393072 |
3.287483 |
|
1997 |
9.79401 |
0.344499 |
4.39028 |
1.402574 |
1.823294 |
5.471525 |
2.289148 |
3.287191 |
|
1998 |
10.11069 |
0.346485 |
4.4425 |
2.550848 |
1.8512 |
2.705615 |
1.834823 |
3.28906 |
|
1998 |
10.17503 |
0.352239 |
4.493646 |
2.566809 |
1.887387 |
3.811979 |
1.750934 |
3.288387 |
|
1998 |
10.17052 |
0.358186 |
4.571615 |
2.507075 |
1.922956 |
6.024707 |
1.737132 |
3.28713 |
|
1998 |
10.09716 |
0.364326 |
4.676406 |
2.371645 |
1.957908 |
9.343799 |
1.793417 |
3.28529 |
|
1999 |
9.85912 |
0.370169 |
4.918893 |
1.827026 |
2.009027 |
18.93343 |
2.047666 |
3.279598 |
|
1999 |
9.686387 |
0.376893 |
5.032982 |
1.673603 |
2.036031 |
22.39958 |
2.192975 |
3.2779 |
|
1999 |
9.483134 |
0.384007 |
5.129544 |
1.577882 |
2.055704 |
24.90643 |
2.357219 |
3.276927 |
|
1999 |
9.24936 |
0.39151 |
5.208581 |
1.539862 |
2.068046 |
26.45397 |
2.5404 |
3.276678 |
|
2000 |
8.900272 |
0.398899 |
5.180182 |
1.249681 |
1.994119 |
24.62729 |
2.900721 |
3.271354 |
|
2000 |
8.639374 |
0.407384 |
5.26013 |
1.451011 |
2.023375 |
25.22219 |
3.058493 |
3.274875 |
|
2000 |
8.381872 |
0.41646 |
5.358516 |
1.833988 |
2.076875 |
25.82375 |
3.171919 |
3.281439 |
|
2000 |
8.127767 |
0.426128 |
5.475339 |
2.398613 |
2.154619 |
26.43197 |
3.241 |
3.291048 |
|
2001 |
7.856563 |
0.442698 |
5.68918 |
4.299684 |
2.451136 |
27.09519 |
3.229741 |
3.316817 |
|
2001 |
7.617448 |
0.451024 |
5.811445 |
4.765684 |
2.499558 |
27.6974 |
3.224529 |
3.327269 |
|
2001 |
7.389929 |
0.457417 |
5.920716 |
4.951412 |
2.494413 |
28.28693 |
3.189368 |
3.335519 |
|
2001 |
7.174004 |
0.461877 |
6.016992 |
4.856867 |
2.435701 |
28.86378 |
3.12426 |
3.341566 |
|
2002 |
6.808366 |
0.454513 |
6.278301 |
3.501984 |
2.087098 |
29.4213 |
2.697605 |
3.340576 |
|
2002 |
6.680153 |
0.459063 |
6.277376 |
3.238922 |
2.015781 |
29.97547 |
2.70524 |
3.344154 |
|
2002 |
6.628058 |
0.465638 |
6.192246 |
3.087614 |
1.985428 |
30.51964 |
2.815567 |
3.347465 |
|
2002 |
6.65208 |
0.474236 |
6.02291 |
3.04806 |
1.996036 |
31.05379 |
3.028586 |
3.350508 |
|
2003 |
7.095244 |
0.4915 |
5.460286 |
3.407027 |
2.199739 |
31.71863 |
3.699959 |
3.354312 |
|
2003 |
7.134292 |
0.501489 |
5.246172 |
3.476274 |
2.231421 |
32.17648 |
3.976096 |
3.356409 |
|
2003 |
7.112248 |
0.510845 |
5.071484 |
3.54257 |
2.243212 |
32.56805 |
4.21266 |
3.357828 |
|
2003 |
7.029112 |
0.519568 |
4.936224 |
3.605913 |
2.235113 |
32.89333 |
4.40965 |
3.358568 |
|
2004 |
6.684869 |
0.531005 |
4.927207 |
3.584735 |
2.140944 |
33.20135 |
4.254255 |
3.354935 |
|
2004 |
6.559556 |
0.537123 |
4.836074 |
3.6748 |
2.119537 |
33.37445 |
4.497223 |
3.355796 |
|
2004 |
6.453157 |
0.541269 |
4.749642 |
3.794541 |
2.104713 |
33.46165 |
4.825741 |
3.357456 |
|
2004 |
6.365672 |
0.543443 |
4.66791 |
3.943957 |
2.09647 |
33.46296 |
5.23981 |
3.359914 |
|
2005 |
6.254641 |
0.534366 |
4.595697 |
4.685664 |
2.122521 |
33.2473 |
6.293892 |
3.369709 |
|
2005 |
6.221969 |
0.536308 |
4.521439 |
4.669384 |
2.116358 |
33.12925 |
6.657278 |
3.371151 |
|
2005 |
6.225195 |
0.53999 |
4.449954 |
4.457734 |
2.105692 |
32.97772 |
6.884432 |
3.370778 |
|
2005 |
6.26432 |
0.545411 |
4.381243 |
4.050712 |
2.090524 |
32.79273 |
6.975351 |
3.368589 |
|
2006 |
6.709826 |
0.55646 |
4.279238 |
2.694227 |
1.825558 |
32.46415 |
6.46785 |
3.352504 |
|
2006 |
6.672555 |
0.563805 |
4.230501 |
2.198102 |
1.899502 |
32.25627 |
6.471178 |
3.351516 |
|
2006 |
6.52299 |
0.571335 |
4.198965 |
1.808243 |
2.067062 |
32.05896 |
6.523147 |
3.353544 |
|
2006 |
6.26113 |
0.579049 |
4.184629 |
1.52465 |
2.328238 |
31.87222 |
6.623757 |
3.35859 |
|
2007 |
5.423967 |
0.587395 |
4.302728 |
1.260245 |
2.949906 |
31.89625 |
6.743457 |
3.382185 |
|
2007 |
5.122722 |
0.595299 |
4.276699 |
1.224018 |
3.291562 |
31.6506 |
6.953172 |
3.387051 |
|
2007 |
4.894387 |
0.603208 |
4.221777 |
1.328888 |
3.620082 |
31.33545 |
7.223348 |
3.388719 |
|
2007 |
4.738961 |
0.611121 |
4.137962 |
1.574857 |
3.935467 |
30.95081 |
7.553987 |
3.38719 |
|
2008 |
4.699031 |
0.621516 |
3.731992 |
2.518543 |
4.355012 |
28.85498 |
8.593663 |
3.368106 |
|
2008 |
4.672389 |
0.62845 |
3.707695 |
2.82406 |
4.597209 |
28.98802 |
8.785796 |
3.365927 |
|
2008 |
4.701621 |
0.634398 |
3.77181 |
3.048027 |
4.779352 |
29.70825 |
8.778962 |
3.366295 |
|
2008 |
4.786727 |
0.639361 |
3.924336 |
3.190445 |
4.901442 |
31.01565 |
8.57316 |
3.369209 |
|
2009 |
5.323492 |
0.640246 |
4.591803 |
3.039964 |
5.091761 |
35.50691 |
7.078624 |
3.384155 |
|
2009 |
5.362033 |
0.644477 |
4.75054 |
3.103821 |
5.042432 |
36.95 |
6.910793 |
3.388367 |
|
2009 |
5.298134 |
0.648959 |
4.827077 |
3.170669 |
4.881736 |
37.94159 |
6.979903 |
3.391332 |
|
2009 |
5.131796 |
0.653694 |
4.821413 |
3.240507 |
4.609673 |
38.4817 |
7.285951 |
3.393048 |
|
2010 |
4.483414 |
0.659999 |
4.534264 |
3.478833 |
3.803776 |
37.35776 |
8.421985 |
3.391215 |
|
2010 |
4.264039 |
0.664711 |
4.443913 |
3.488451 |
3.477969 |
37.4799 |
8.964694 |
3.391356 |
|
2010 |
4.094066 |
0.669148 |
4.351074 |
3.434859 |
3.209782 |
37.63557 |
9.507124 |
3.391168 |
|
2010 |
3.973495 |
0.673309 |
4.255749 |
3.318058 |
2.999216 |
37.82477 |
10.04927 |
3.390654 |
|
2011 |
4.038584 |
0.677424 |
4.060443 |
2.813698 |
2.911879 |
38.12841 |
11.08751 |
3.388464 |
|
2011 |
3.962314 |
0.680943 |
3.999141 |
2.700217 |
2.790313 |
38.3523 |
11.43056 |
3.387833 |
|
2011 |
3.880943 |
0.684097 |
3.974349 |
2.653267 |
2.700124 |
38.57734 |
11.57478 |
3.387412 |
|
2011 |
3.794469 |
0.686883 |
3.986068 |
2.672846 |
2.641313 |
38.80355 |
11.52019 |
3.387203 |
|
2012 |
3.634564 |
0.687971 |
4.158418 |
3.12527 |
2.63891 |
39.18326 |
10.70842 |
3.38449 |
|
2012 |
3.56522 |
0.690558 |
4.193509 |
3.131384 |
2.632843 |
39.35084 |
10.47952 |
3.385788 |
|
2012 |
3.518108 |
0.693311 |
4.215462 |
3.057503 |
2.648143 |
39.45864 |
10.27514 |
3.388383 |
|
2012 |
3.493228 |
0.696232 |
4.224277 |
2.903626 |
2.684808 |
39.50666 |
10.09529 |
3.392275 |
|
2013 |
3.508765 |
0.701694 |
4.191211 |
2.339741 |
2.763628 |
39.2896 |
10.06341 |
3.403845 |
|
2013 |
3.521072 |
0.703998 |
4.185247 |
2.157879 |
2.834711 |
39.30018 |
9.883211 |
3.407778 |
|
2013 |
3.548335 |
0.705518 |
4.177643 |
2.028026 |
2.918845 |
39.33309 |
9.678144 |
3.410455 |
|
2013 |
3.590554 |
0.706254 |
4.168398 |
1.950182 |
3.016031 |
39.38834 |
9.448212 |
3.411877 |
|
2014 |
3.730869 |
0.704554 |
4.134857 |
2.001238 |
3.236322 |
38.21375 |
9.211648 |
3.408763 |
|
2014 |
3.769745 |
0.704385 |
4.131393 |
1.996658 |
3.315589 |
38.81455 |
8.924693 |
3.408986 |
|
2014 |
3.790321 |
0.704094 |
4.135352 |
2.013331 |
3.363885 |
39.93855 |
8.605579 |
3.409264 |
|
2014 |
3.792598 |
0.703681 |
4.146732 |
2.051259 |
3.38121 |
41.58575 |
8.254307 |
3.4096 |
|
2015 |
3.724806 |
0.701817 |
4.195104 |
1.940174 |
3.22187 |
44.06861 |
7.625008 |
3.411378 |
|
2015 |
3.711192 |
0.701691 |
4.2095 |
2.088716 |
3.235533 |
46.63725 |
7.307766 |
3.411271 |
|
2015 |
3.699987 |
0.701975 |
4.21949 |
2.326618 |
3.276502 |
49.60412 |
7.056713 |
3.410666 |
|
2015 |
3.69119 |
0.702668 |
4.225074 |
2.653879 |
3.34478 |
52.96921 |
6.871848 |
3.409563 |
|
2016 |
3.687194 |
0.702486 |
4.189203 |
3.521158 |
3.636967 |
58.03729 |
6.483677 |
3.405877 |
|
2016 |
3.682256 |
0.704512 |
4.200795 |
3.846878 |
3.681218 |
61.67693 |
6.538989 |
3.404611 |
|
2016 |
3.67877 |
0.70746 |
4.2228 |
4.081695 |
3.674135 |
65.1929 |
6.768288 |
3.40368 |
|
2016 |
3.676735 |
0.711331 |
4.255219 |
4.22561 |
3.615718 |
68.58519 |
7.171575 |
3.403085 |
|
2017 |
3.511338 |
0.719406 |
4.376224 |
4.257499 |
3.410815 |
73.57616 |
8.159228 |
3.402638 |
|
2017 |
3.578131 |
0.72381 |
4.3982 |
4.228059 |
3.287791 |
76.03215 |
8.746337 |
3.402789 |
|
2017 |
3.712301 |
0.727825 |
4.399322 |
4.116165 |
3.151496 |
77.67552 |
9.343283 |
3.403349 |
|
2017 |
3.913847 |
0.73145 |
4.379587 |
3.921817 |
3.001928 |
78.50627 |
9.950063 |
3.40432 |
|
2018 |
4.300271 |
0.734647 |
4.321151 |
3.293146 |
2.668546 |
76.47136 |
10.56769 |
3.408003 |
|
2018 |
4.58957 |
0.737508 |
4.266844 |
3.074641 |
2.560649 |
76.49809 |
11.19374 |
3.408874 |
|
2018 |
4.899246 |
0.739995 |
4.198821 |
2.91443 |
2.507697 |
76.53341 |
11.82922 |
3.409235 |
|
2018 |
5.229297 |
0.742108 |
4.117081 |
2.812514 |
2.509689 |
76.57734 |
12.47414 |
3.409087 |
|
2019 |
5.766912 |
0.740499 |
3.995428 |
2.815132 |
2.701512 |
74.65723 |
13.87032 |
3.406667 |
|
2019 |
6.062842 |
0.743202 |
3.896733 |
2.81131 |
2.759437 |
75.50741 |
14.23737 |
3.406203 |
|
2019 |
6.304274 |
0.74687 |
3.794799 |
2.847288 |
2.818352 |
77.15524 |
14.31712 |
3.405933 |
|
2019 |
6.491207 |
0.751503 |
3.689627 |
2.923065 |
2.878256 |
79.60072 |
14.10957 |
3.405858 |
|
2020 |
6.321608 |
0.757472 |
3.589696 |
3.065578 |
2.891254 |
85.25742 |
12.51924 |
3.402668 |
|
2020 |
6.520359 |
0.763886 |
3.474656 |
3.21018 |
2.972295 |
88.33279 |
12.17527 |
3.404306 |
|
2020 |
6.785425 |
0.771116 |
3.352985 |
3.383807 |
3.073483 |
91.24038 |
11.9822 |
3.407461 |
|
2020 |
7.116807 |
0.779162 |
3.224685 |
3.586458 |
3.194818 |
93.98021 |
11.94001 |
3.412135 |