Organizations and Markets in Emerging Economies ISSN 2029-4581 eISSN 2345-0037
2023, vol. 14, no. 3(29), pp. 562–582 DOI: https://doi.org/10.15388/omee.2023.14.5
The Importance of Portfolio Composition and Home Ownership in Wealth Distribution in Europe
Karolis Bielskis
Bank of Lithuania
Vilnius university, Lithuania
karolis.bielskis@gmail.com
https://orcid.org/my-orcid?orcid=0000-0002-9947-4462
Abstract. The paper analyzes household portfolio dynamics in Europe, focusing on the period from 2010 to 2017 using data from the European Central Bank’s Household Finance and Consumption Survey (HFCS). The study examines the evolution of household portfolios after the 2008 financial crisis, with housing assets found to be one of the key drivers. On the aggregate level, the household portfolio remained stable between 2010 and 2017. Housing importance remained crucial during all the time and drove the majority of portfolio performance for households in 40–99 percentiles of the wealth distribution. With the evolution of household portfolios, age cohorts 45–54, 65 and older strengthen their positions by increasing the share of their owned assets in comparison to other age cohorts, which lost part of their shares. I conclude the paper with some stylized facts showing the relationship between home ownership, the share of portfolio in housing assets and wealth inequality between countries. The stylized facts provide evidence that household portfolios significantly concentrated in housing assets during the analyzed decade. Furthermore, the transition of households from renters to home owners contributed significantly to the changes in wealth inequality that occurred after the 2008 financial crisis.
Keywords: portfolio composition, economic mobility, home ownership, wealth inequality
Received: 3/8/2023. Accepted: 7/11/2023
Copyright © 2023 Karolis Bielskis. Published by Vilnius University Press. This is an Open Access article distributed under the terms of the Creative Commons Attribution Licence, which permits unrestricted use, distribution, and reproduction in any medium, provided the original author and source are credited.
1. Introduction
Understanding the composition and distribution of household balance sheets, as well as their evolution over time, is crucial for economic policies. The allocation of assets and debts affects household abilities to react and manage unexpected economic shocks (Mian et al., 2013). Research exposes existing disparities in wealth and income; it shows the future trajectory of it (Piketty, 2013; Garbinti et al., 2017; Moore et al., 2016) and explores societal readiness for future retirement (Volz et al., 2020). The fact that portfolio composition also has implications for the transmission of monetary and fiscal policy is of particular interest for policy makers (Mian et al., 2013; Benmelech et al., 2017; Poterba & Samwick, 2003; Lenza & Slacalek, 2018; Ampudia et al., 2018).
To react to the importance of household balance sheets, I use data from the European Central Bank’s Household Finance and Consumption Survey (HFCS) to explore how household asset portfolios in Europe evolved after the recent financial crisis. In real numbers, household assets slightly grew from the average 255 300 EUR per European household in 2010 (HFCS Network, 2013) to 259 400 EUR per household in 2017 (HFCS Network, 2020). On the aggregate level, household wealth and assets data in the HFCS remains consistent with the information from different macroeconomic data sources, which allows using HFCS to better understand the distribution of aggregate household assets1 in Europe.
In the 30 years leading up to the global financial crisis, housing and financial market assets were the main drivers which caused the household balance sheet evolution (Bricker et al., 2019). However, housing and financial markets were also the most affected asset classes during the 2008 financial crisis and caused significant changes in household balance sheets (Mian et al., 2013). As numerous households have suffered from declines in their balance sheets, it is crucial to assess whether housing and financial markets still represent the primary source of wealth for households or whether significant changes in household choices, leading them to other asset classes, have emerged.
The significance of my paper can be summarized as follows. First, the paper echoes a relatively small amount of literature summarizing household balance sheets in Europe (HFCS Network, 2013; Arrondel et al., 2014; HFCS Network, 2020). In addition, the paper gets more detailed in observing the asset distribution and differences between age cohorts. Second, the panel component of HFCS data is used to capture changes across individual households. Finally, household level changes are used to identify the relationship between the home ownership status, the portfolio composition and the household position in the wealth distribution. I conclude the paper by drawing some stylized facts between home ownership status and changes in the wealth distribution and open up a policy discussion about household economic mobility in Europe. The advantage of the paper is the micro level HFCS dataset, which allows me to identify and capture data-driven results on household mobility across the wealth quantiles in 2010–2017.
The rest of the paper is structured in the following manner. Section 2 discusses the HFCS dataset used in the study and the basic aggregate results of household portfolios. Section 3 examines the results across the asset distribution over the different time moments. Section 3 also reviews the portfolio results across the different age cohorts. Section 4 considers the importance of home ownership in household balance sheets and the relationship with the household mobility over the wealth distribution. Section 5 concludes.
2. Data
The present paper uses HFCS data, which is a cross-sectional survey that also includes the panel component for some of the households and is conducted every 3–4 years by the European Central Bank and delegated authorities in each country. The HFCS provides the most comprehensive and highest quality survey microdata on European household wealth. In HFCS, households respond to questions about their financial and nonfinancial assets, debts, employment status, income, consumption, and demographic characteristics. Additionally, many countries also complement their results with the detailed microlevel institutional data2. Finally, as comparisons between different waves of the survey are important, all results and values are adjusted to 2015 prices.
The HFCS is designed around a common set of methodological principles, which ensures the comparability of results between countries. All country-level HFCS datasets provide a set of core output variables based on a set of common definitions and descriptive features according to an output-oriented approach (HFCS Network, 2020). Additionally, household samples have been designed in each country to ensure representative results at both the euro area and national level. The paper focuses on the first three waves of HFCS (2010, 2014, and 2017), with more than 91 000 households participating in the last (2017) wave, with a different sample size across countries. Given the unequal distribution of household wealth, a random sample of families is unlikely to capture the small minority of families who hold the large majority of wealth (Bricker et al., 2019). Therefore, to capture financial instruments that are almost exclusively held (and in large quantities) by the wealthiest households, most countries apply different techniques to oversample the wealthy households. Since some studies (e.g., Tiefensee & Grabka, 2014) have compared the quality of HFCS data against other available sources, they have concluded that HFCS is now the best dataset for cross-country analysis and comparisons of the balance sheets, wealth and inequality.
2.1. Composition of Average Household Portfolios
Households can hold two major types of assets: financial, such as the assets held at depository institutions and brokerages, or non-financial, such as housing, business related wealth3, cars and others. In 2008, a significant collapse in various asset classes, including housing and stocks, was linked to the global financial crisis (Mian et al., 2013). However, the analysis of the post-crisis period between 2010 and 2017 shows that most families did not change their portfolio composition and remained owning assets of some kind (Figure 1). The ownership rate after the 2008 financial crisis was around 97 percent for financial and 91 percent for non-financial assets. Therefore, numbers remained quite similar over the later 7 years, reaching almost 98 percent for financial and the same 91 percent for non-financial assets in 2017.
Figure 1
Household Portfolio Composition in Europe, by Years
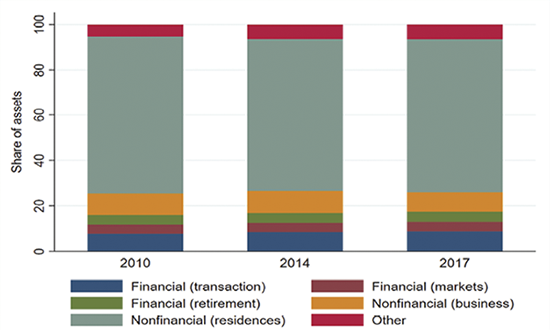
Median asset holdings in the early part of the sample (2010) were about 153 100 EUR and decreased to 141 600 EUR in 2017 (HFCS Network, 2013; Arrondel et al., 2014; HFCS Network, 2020). Over the same period, the median outstanding balance of household liabilities grew from 23 900 EUR in 2010 to 29 300 EUR in 2017. Financial assets, which were majorly concentrated in deposits, savings and retirement accounts, constituted 17.2% of total assets following the recent financial crisis. Over the following seven years, part of financial assets grew up to 19.1 percent of total assets, mainly driven by increase in deposits, savings, and mild changes in trading or retirement accounts. However, Figure 1 clearly indicates that the majority of total assets remained highly concentrated in the real assets side and particularly in housing. Housing-related share of assets shrank slightly over the time but remained responsible for more than 60 percent of total assets. All the results suggest that the huge drops in housing assets over the recent financial crisis did not change household behavior as the share of portfolio related to housing remained similar.
3. Portfolio of Household Assets
3.1 Portfolio over the Wealth Distribution
Though the average or median household asset portfolio is a combination of real and financial market assets, the main asset for most families in Europe is housing, with financial assets representing a relatively small portion of the portfolio (Arrondel et al. 2014; HFCS Network, 2020). In fact, because asset (especially financial) holdings are highly concentrated at the top of the asset distribution (Bricker et al., 2020), much of the change that appeared in the aggregate portfolio was driven by asset changes in the top 10 percent of the wealth distribution.
Figure 2 shows the asset composition of households at the various points of wealth distribution and the average asset composition in 2010. The most noticeable feature is how much asset portfolios vary across the distribution. Housing is the most common asset class for most households, except for households in the top 1 percent of the wealth distribution. They concentrate less of their share of wealth in housing and much higher in business-related wealth. Similar composition of assets was captured in the US (Bricker et al., 2019) and Sweden (Bach et al., 2016), where the wealthiest families invest in private equity, and families from 50th to 95th percentiles mainly concentrate their wealth in housing. Additionally, the leverage ratios decline as assets increase.
Figure 2
Portfolio Composition in Europe by Percentiles, 2010
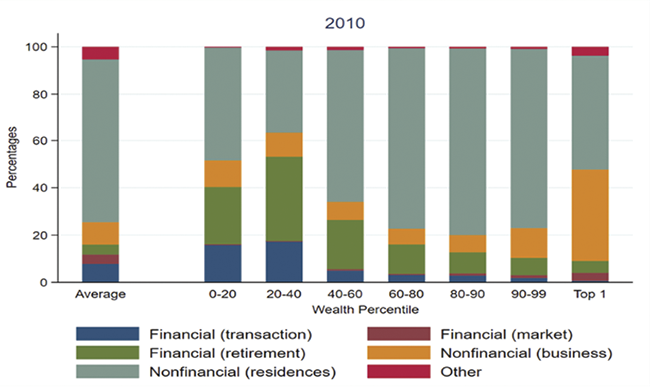
Note. Percentiles on the horizontal axis are based on wealth distribution derived from HFCS.
The main assets of households in the bottom 40 percent of the wealth distribution are housing and retirement accounts. Same households also concentrate a significantly high share of their assets (5) in deposits and savings. The asset portfolio of families within the median range (40th to 60th percentile) is becoming increasingly biased towards housing, reaching over 60 percent of the total asset portfolio. Meanwhile, the proportion of assets in retirement accounts, deposits and savings are shrinking. The bias towards housing becomes even more pronounced for households between the 60th and 99th percentiles. More than 70 percent of their total asset portfolio is concentrated in residential assets. However, the portfolio composition of families at the top 1 percent gets a different distribution from the rest of percentiles. For families in the top 1 percent of wealth distribution, housing-related share of assets decreases to 50 percent or even less. Oppositely to the rest of the distribution, the richest 1 percent of households concentrate about 40 percent of their asset portfolio in business-related wealth. They also own smaller parts of their assets in retirement and financial accounts. Consequently, the findings underscore the significance of home ownership assets for all households, particularly the “middle class” (between 40 and 99 per cent of the wealth distribution).
Figure 3
Portfolio Composition in Europe by Percentiles, 2017
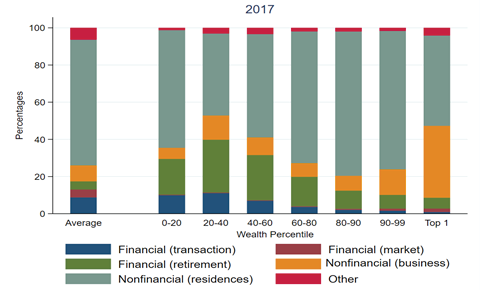
Note. Percentiles on the horizontal axis are based on the wealth distribution derived from HFCS.
From Figure 2, we can see the changes in household portfolio composition that occurred between 2010 and 2017. It also shows how household portfolios recovered in the medium/long term of 7 years after the shock of the recent financial crisis. Figure 3.2 demonstrates that families in the bottom 40 per cent of the wealth distribution increased their share of total assets in housing but experienced a significant decline in the share of deposits, savings and retirement accounts. The result suggests that households’ confidence in real estate recovered, while financial and more liquid instruments remained less attractive to them. The situation remained more stable for households between the 40th and 99th percentiles, for whom a small decline in the share of housing in their total asset portfolio was replaced by the increase in the share of their retirement account. Finally, the richest 1 per cent of families did not redistribute their wealth and kept their portfolio similar to 2010.
3.2 Portfolio over Age Cohorts
Life-cycle processes are important for understanding the evolution of wealth and its composition over time. The balance of wealth changes over the life cycle, as does the composition of wealth. Young people start their careers by building up their human capital and then take ownership of a primary residence (often in the form of a mortgage). Accordingly, housing dominates the balance sheet of young families. Thus, over the course of their lives, families accumulate assets and wealth that they will eventually draw on in retirement and possibly pass on to heirs in the form of bequests. Households tend not to spend down their wealth, with a significant number leaving inheritances to future generations. Previous research concludes that the bequest motive is powerful, accounting for between one-third and one-half of all savings (Atkinson & Bourguignon, 2014; Kopczuk & Lupton, 2007). Whether it is best to view bequests as a distinct motive for saving, separate from the life-cycle model (Kotlikoff & Summers, 1981) and one that can be incorporated into the standard model through extension, is beyond the scope of this paper. As a practical matter, we follow Dynan et al. (2002) in considering the motivation for saving at older ages (precautionary vs. bequest) as potentially impossible to disentangle. The focus of the paper is less on the precise motive for saving than on the use of the life-cycle process as a way of disentangling age effects from wealth trends. After all, financial assets, including equity holdings and employment-related pension plans, become increasingly important over time4. While such processes take place at the level of individual households, they also strongly influence the overall composition of wealth as society ages.
As the previous results have shown, the composition of assets varies considerably across the wealth distribution. Businesses and directly held financial assets account for a substantial proportion of the wealth of families at the top of the distribution, but only a small proportion of the wealth of households in the middle, and are almost absent from the wealth of families at the bottom level. Housing dominates the asset portfolios of households in the middle of the distribution, while housing and retirement related assets also account for the highest share of assets (more than 80 percent) for households at the bottom. As the portfolios of low, middle and high wealth families differ substantially, long-term trends may also influence the overall composition of wealth. In what follows, I look at how the various components of wealth have evolved over the life cycle for households at different levels of the normal income distribution and examine whether recent cohorts have followed patterns similar to households of previous cohorts.
Household savings decisions are certainly not only motivated by life-cycle considerations. The need to smooth consumption against adverse shocks—through precautionary saving—is pervasive. Previous research in the US based on the Survey of Consumer Finances suggests that precautionary savings account for a relatively small but important share of total savings, especially among younger households and business owners (Cagetti, 2003; Hurst et al., 2010). The following results therefore explore the similarities in life-cycle patterns across age cohorts in Europe in the aftermath of the recent financial crisis.
Figure 4 provides more detail on the composition of assets recorded in 2010. Figure 5 shows that the youngest cohorts (under 45 years old) tended to concentrate their assets in housing, business-related wealth and retirement accounts–around 60, 28 and 9 per cent of total assets, respectively. The situation is relatively similar for the age cohorts aged 45–65. In this case, households’ total assets are highly concentrated in housing and, compared to the youngest cohorts, a slightly smaller share of total assets is held in business related wealth or retirement accounts. Finally, for the oldest age cohorts, total assets are even more concentrated in housing.
Figure 4
Household Portfolio Composition Owned by Age Cohorts, 2010
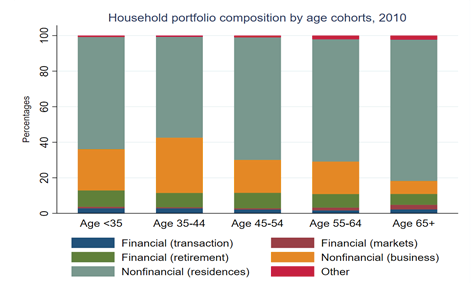
Note. Age cohorts are based on the age of the head of the household that was identified in the survey.
Around 80 per cent of their total assets are accumulated via housing, with only small shares left for alternative assets such as business-related wealth, retirement and investment accounts, deposits or savings. Overall, Figure 4 suggests that the 2008 financial crisis affected all age cohorts, as their portfolios were strongly concentrated and related to housing markets.
However, the situation changed between 2010 and 2017. In 2017, the youngest cohort under 35 years of age reduced their share of housing by more than 10 per cent (Figure 5). At the same time, they increased their share of deposits, savings and business-related wealth from 25 to 34 percent. Another significant change occurred in the 45–54 age group as the cohort increased its share of total assets in business-related wealth by 11 percent, while the share of housing in total assets decreased by the same percentage. The other three age cohorts — 35 to 44, 55 to 64, 65 and older — have not changed their portfolios and kept it similar to 2010.
Figure 5
Household Portfolio Composition Owned by Age Cohorts, 2017
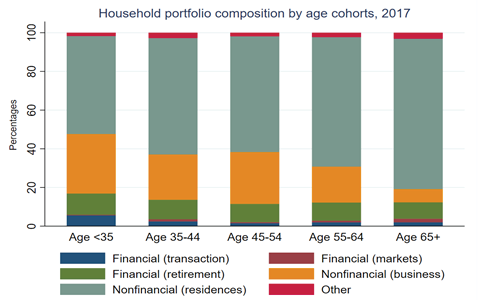
Note. Age cohorts are based on the age of the head of the household that was identified in the survey. Cohorts 35 to 44, 55 to 64, 65 and older made lower adjustments to their portfolios and kept them similar to 2010.
Overall, the results based on age cohorts show how household asset portfolios changed during the recovery period following the recent financial crisis. The youngest cohorts shifted part of their housing wealth towards the higher share of business-related wealth, deposits or savings. Middle-aged cohorts also reduced their share of the portfolio in housing and redistributed it mainly towards business-related wealth. The results support the findings of Bricker et al. (2019), who identified the post-financial crisis period as the one with a decrease in home ownership and an increase in equity. Results were partly related to the housing supply, which became a problem after the 2008 financial crisis, especially in the United States. A similar housing supply problem had emerged in some European countries and could push young households out of the housing market and into other ways of building wealth. However, such a question requires a different set of data to analyze. Finally, results showed that the oldest cohorts kept their portfolio more stable than other cohorts, with only a small decline in the share of housing related assets, which was replaced by an increase in assets related to retirement accounts.
3.3 The Youngest Cohorts
The special case of interest sheds light on the youngest age cohort, as the recent financial crisis was the first one they could really understand and face its impact on society. The 18–25 cohort was full of people taking their first steps on the labor market. At the same time, they faced one of the biggest waves of unemployment in many European countries, as well as a huge drop in the value of housing and financial assets. The results for 2010 show that the cohort aged 18–25 had a much larger share of their total assets in business-related wealth, private pension accounts, financial markets, deposits and savings than in housing (Figure 6). By comparison, in the same year the next age cohort, households aged 26 to 32 concentrated their portfolio more in housing and business-related wealth. Financial accounts, deposits and savings accounted for the minority of the total portfolio. However, the situation changed in the later 7 years. The next generation of 18–25 year olds changed their portfolio in such a way that the share of financial markets and financial accounts in total assets decreased. At the same time, they significantly increased the share of total assets related to the private pension account. Results suggest that preferences of the youngest cohorts could be shifted by increasing their spending in investment accounts instead of the retirement account. Significant differences are also recorded for the age cohort 26 to 32 (Figure 6). Compared with the 2010 results, the cohort of 26–32 reduced its share of the total wealth portfolio in housing in 2017 by increasing its share in business-related wealth.
Figure 6
Household Portfolio Composition Owned by Young Age Cohorts
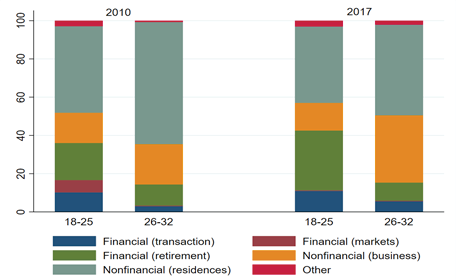
Note. Age cohorts are based on the age of the head of the household that was identified in the survey. For comparability reasons, the pool of countries includes only the countries which participated from the first wave of HFCS.
Overall, the results suggest that the youngest age cohorts had lost some of their previous faith in housing and financial markets and reduced their share of their portfolio in these markets. At the same time, they concentrated a higher share of their assets in business-related wealth and retirement accounts. Finally, the results also raise the idea that the new generation entering the labor market just after the global financial crisis had a quite different portfolio composition from previous generations. Instead of the most common wealth generator –housing–they tend to concentrate more of their total assets in business-related wealth.
4. The Role of Housing and Wealth Inequality
4.1 The Importance of Home Ownership
As previous results have shown, the share of housing in the household portfolio has been declining in recent years but remained crucial in describing total household wealth and assets. However, the results may be different if the home ownership status and the home ownership rate are taken into account. The following chapter looks at this issue in more detail and discusses the changes brought about by home ownership.
Figure 7 shows that the home ownership ratio varies a lot in Europe—from a bit more than 40 percent in Germany or Austria to as high as 90 percent in Slovakia or Lithuania. It is important to note that home ownership status can also be influenced by cultural and educational differences between countries, as well as different levels of trust in public insurance systems (Fleck & Monninger,2020). However, the factors do not influence the results of this paper as I compare households within the wealth distribution in different countries. Therefore, cultural, educational or trust in public insurance systems remain the same between households in the same country. The average ratio for the euro area remains at 60 percent. On the basis of the average ratio for the euro area, I have divided the countries into renters—countries below the euro area average—and home owners, i.e., countries above the average.
Figure 7
Home Ownership Rates in Europe in 2017
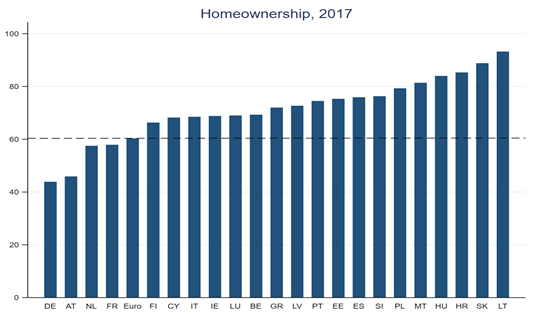
Notes. The dotted line highlights the result of average Euro area home ownership rate.
I start by looking at total asset portfolios based on different home ownership groups. Figure 8 shows that in 2010 (at the end of the recent financial crisis), households in owner-occupied countries had a high concentration of total assets in housing—around 80 percent of total assets. More than 15 percent of their total wealth was accumulated in business-related wealth, leaving only small shares for other asset classes. In the same years, a slightly opposite situation was recorded for tenant countries. In their case, housing remained crucial, but only 60 per cent of total wealth was accumulated through housing wealth. A further 20 percent of total wealth was accumulated through business-related wealth, and the remaining 15 percent of total wealth was concentrated in private pension accounts. From a time perspective, we can see that portfolios remained stable even years after the financial crisis. For owner–occupier countries, the share of business-related wealth in assets increased slightly between 2010 and 2017, replacing the similar negative change related to housing assets. For renter countries, the business-related wealth shares decreased between 2010 and 2017, while the similarly large increase occurred for other assets (cars, jewellery and other). Overall, the results in Figures 7 and 8 show that household portfolios did not change much over time but remained significantly different between renter and owner countries.
4.2 Relationship between Home Ownership and Wealth Inequality
The importance of housing and home ownership for the household portfolio has already been discussed in the previous chapter. Housing generates more than half of the total household portfolio in Europe, but also generates portfolio differences between homeowners and renters. Recent decades have been associated with an increasing wealth gap between poor and rich families. However, wealth inequality evolves differently across countries, and the question arises whether the share of housing in total wealth can partly explain the difference across European countries.
Figure 8
Portfolio Composition in Europe for Home Ownership Rate Based Subgroups
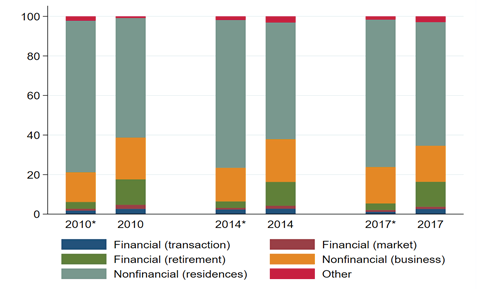
Note. Country groups are based on their home ownership rates. Countries without * include Austria, Germany, France and Netherlands (countries with home ownership rate below the Euro area average). The group of countries with * include countries which have their home ownership rates above the Euro area average.
To bring some stylized facts, I look at Figure 9, which plots countries by their home ownership rate and wealth Gini index in 2017. We can see that countries form a downward slope, signalling a negative relationship between home ownership ratio and wealth inequality. In other words, a high home ownership ratio signals lower wealth equality in society, as a higher share of families own their homes and accumulate a significant amount of wealth in housing. Figure 9 shows Slovakia, Lithuania or Poland as good examples of a similar situation. On the other hand, a low rate of home ownership is associated with higher wealth inequality, as the Gini index tends to increase with more families renting their homes. Austria, Germany or the Netherlands are the typical examples of it.
To support the relationship between housing, home ownership and wealth inequality, I perform the following exercise, tracking detailed changes at household level over the period between 2010 and 2017. The richness of the HFCS data allows me to examine the situation at a more granular level. Dataset allows me to examine how particular households reacted in situations where their tenure status changed from renter to homeowner, or vice versa, and more interestingly, how such households moved across the wealth distribution during the last years. To answer the questions, I use HFCS data at the household level and look at changes in variables for the same households between different waves of the survey. Specifically, I look at changes in wealth quantiles, income, home ownership status, the share of the household portfolio in financial assets, and the share of the household portfolio in housing-related assets.
Figure 9
Connection between Wealth Gini Index and Home Ownership Rates in Europe in 2017
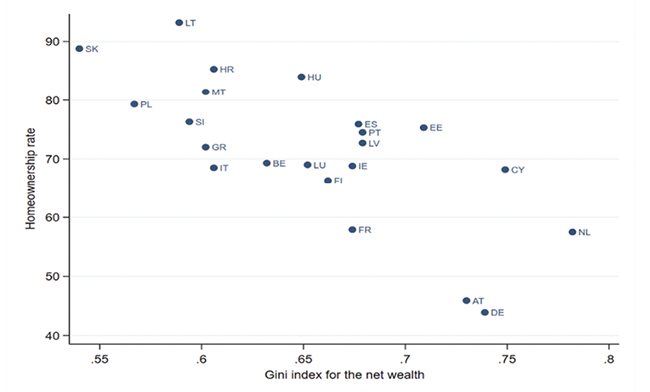
Note. Wealth Gini index and home ownership rates are based on calculations from HFCS data.
Table 1 represents the first set of results, showing the number of households that either changed their home ownership status or not, and how they moved in the wealth distribution between 2010 and 2014. For example, if the change in wealth quantile is -1, then the household has moved down by one quantile in the wealth distribution. A similar drop could be from the 5th to the 4th quantile, from the 4th to the 3rd quantile and so on. Positive numbers mean that the household moved up in wealth quantiles between 2010 and 2014. Table 1 shows that over the analysis period, 10640 households that repeatedly participated in the HFCS remained in the same tenure status, 363 households moved from owner to renter status, and 396 households moved from renter to owner position. What is more interesting is how the distributions look for each situation of tenure status. Table 1 shows that moving between wealth quantiles supports the normal distribution for the case where the home ownership status remains the same as at the beginning of the period (Column 2). When analyzing the scenario of home owners becoming renters (Column 1), the distribution of changes in wealth quantiles is skewed to the left. In practice, it means that the majority of households that moved from owner-occupation to renting tended to remain in the same wealth quantile or even moved down to lower quantiles. The opposite situation occurs in the scenario where renters became home owners (Column 3). In this case I capture the right-skewed distribution of changes in wealth quantiles. It means that households that move from being renters to home owners also tend to stay in the same wealth quantile as before or move up in the wealth distribution.
Table 1
Changes in Home Ownership Status between 2010 and 2014
|
|
Home ownership status |
||
|
Change in |
Owner →Renter |
No Change |
Renter → Owner |
|
-4 |
20 |
17 |
1 |
|
-3 |
44 |
56 |
3 |
|
-2 |
89 |
261 |
5 |
|
-1 |
98 |
1310 |
5 |
|
0 |
92 |
6750 |
95 |
|
1 |
17 |
1807 |
116 |
|
2 |
2 |
339 |
100 |
|
3 |
1 |
79 |
52 |
|
4 |
0 |
21 |
19 |
|
Total number |
363 |
10640 |
396 |
I follow the same procedure to check whether the results remain similar in the later period between 2014 and 2017. Table 2 shows that the results hold even with the higher number of observations (and countries) and the different period. Households that did not change their home ownership status between 2014 and 2017 mostly remained in the same quantile, supporting a normal distribution of wealth. Other households that changed their status from home owner to renter moved down the wealth distribution, while households that changed from renter to home owner mostly moved up to the higher wealth quantiles. Both Table 1 and Table 2 support the stylized fact that changes in home ownership status between 2010 and 2017 were associated with movements up and down the wealth distribution.
An alternative way of analyzing household behavior is by looking at the individual cases of changes in the wealth distribution. Instead of looking at how households moved across the wealth distribution through changes in their home ownership status, I look at how other factors—income, home ownership status, portfolio shares in financial and housing assets—change based on different scenarios. In this case, scenarios represent situations in which households move in terms of quantiles across the wealth distribution compared to their distributional positions in previous HFCS waves. Table 3 shows all the relevant statistics and changes that occurred between 2010 and 2014, suggesting that the majority of households did not change their position in the wealth distribution (Column 5 with value 0). Over the period, their average income increased slightly, their home ownership status did not change, the share of the portfolio in housing wealth decreased by 1 percent, while the share of the portfolio in financial wealth increased by 1 percent.
Table 2
Changes in Home Ownership Status between 2014 and 2017
|
|
Home ownership status |
||
|
Change in |
Owner → Renter |
No Change |
Renter → Owner |
|
-4 |
67 |
25 |
0 |
|
-3 |
152 |
105 |
3 |
|
-2 |
196 |
447 |
11 |
|
-1 |
190 |
2742 |
23 |
|
0 |
119 |
12663 |
220 |
|
1 |
29 |
2868 |
254 |
|
2 |
5 |
518 |
172 |
|
3 |
1 |
122 |
83 |
|
4 |
0 |
38 |
29 |
|
Total number of |
759 |
19528 |
795 |
Table 3 also shows that by moving in any direction from 0 (no change) of the wealth distribution, the average statistics of the variables start to change and show a clear trend. Moving to the left of the wealth distribution means analyzing households that have moved to the lower wealth quantiles compared to previous years (see columns 1–4 with values from -4 to -1). The results show that average income fell for households that moved down by 2 or more wealth quantiles. The tenure status of many households also changed from owner to renter. Finally, on average, households also experienced significant changes in their portfolio composition. The share of housing wealth in the portfolio fell by 17-29 percent on average, while the share of financial wealth in the portfolio rose by 8–19 percent. Results suggest that many households that moved from owner status to renting did not buy another property to replace the one they sold and used for renting. The results in Table 3 also suggest that the money received from the sale of the house is partly used to compensate for a fall in income, resulting in a lower overall level of wealth.
Table 3
Summary of Average Changes in Income, Homeownership and Portfolio between 2010 and 2014
|
|
Change in Wealth Quintiles |
||||||||
|
Summary statistics |
-4 |
-3 |
-2 |
-1 |
0 |
1 |
2 |
3 |
4 |
|
Change in income |
-0.19 |
-0.08 |
-0.09 |
-0.01 |
0.09 |
0.15 |
0.17 |
0.14 |
0.53 |
|
Change in home ownership |
-0.49 |
-0.39 |
-0.24 |
-0.07 |
0.00 |
0.05 |
0.22 |
0.39 |
0.48 |
|
Change in share of housing |
-21.28 |
-29.15 |
-17.36 |
-3.50 |
-1.01 |
1.85 |
14.76 |
36.57 |
26.67 |
|
Change in share of Fin Assets |
19.81 |
11.97 |
8.31 |
1.33 |
1.33 |
1.23 |
-4.55 |
-14.63 |
-20.35 |
|
Total number of observations |
37 |
103 |
356 |
1417 |
6933 |
1938 |
443 |
132 |
40 |
Note. The table shows how different households were moving over the wealth quantiles between 2010 and 2014. 0 means that in 2014 the household remained in the same wealth quantile as it was in 2010. Negative or positive values suggest how many quantiles households moved up or down in the wealth distribution between 2010 and 2014.
The opposite situation occurs when analyzing the other side of the wealth distribution. Columns 6–9 (with values from 1 to 4) of Table 3 show the households that moved up by 1, 2, 3 or 4 quantiles in the wealth distribution between 2010 and 2014. The aggregates of households show that their income increased over the period, while their tenure status also changed positively—many of such households became owners from renters. Unsurprisingly, the portfolio composition of households also changed in favor of housing. For households that moved up two or more quantiles in the wealth distribution, the share of the portfolio in housing wealth increased by 14–26 percent, while the share of the portfolio in financial wealth decreased by 4–20 percent.
To extend the analysis, Table 4 presents the results in the same way for the period between 2014 and 2017. As in the previous table, the majority of households did not change their home ownership status during the period of 2014–2017 (Column 5). Their income increased slightly, while the share of the portfolio in housing assets increased by 0.3 percent, and the share of the portfolio in financial assets increased by 0.5 percent on average.
Other results (columns 1–2) in Table 4 suggest that, since 2014, the average income of households that fell by 3 or 4 quantiles in the wealth distribution decreased significantly. Moreover, many households also changed their home ownership status and became renters. The portfolio also changed, as the share of housing assets decreased by 42–57 percent on average, while the share of financial assets increased by 27–33 percent. The opposite side of the results (columns 7–9) in Table 4 shows that average income increased for households that moved up by 2–4 quantiles in the wealth distribution since 2014. Finally, the share of housing wealth in the portfolio of households increased by 18–31 percent, while the share of financial wealth decreased even by 11–23 percent. It is important to note that the small number of observations (households) at the two tails of the wealth distribution introduces some limitations to the results. However, the general trends hold under different scenarios, although the actual changes for individual households could be different in magnitude.
Table 4
Summary of Average Changes in Income, Home Ownership and Portfolio between 2014 and 2017
|
|
Change in Wealth Quantiles |
||||||||
|
Summary statistics |
-4 |
-3 |
-2 |
-1 |
0 |
1 |
2 |
3 |
4 |
|
Change in income |
-0.50 |
-0.20 |
-0.05 |
0.05 |
0.10 |
0.17 |
0.29 |
0.22 |
0.13 |
|
Change in home ownership |
-0.73 |
-0.57 |
-0.28 |
-0.06 |
0.01 |
0.07 |
0.24 |
0.40 |
0.43 |
|
Change in share of housing |
-57.44 |
-42.01 |
-22.02 |
-2.95 |
0.28 |
4.25 |
18.63 |
30.89 |
30.99 |
|
Change in share of Fin assets |
33.39 |
27.02 |
14.75 |
1.91 |
0.54 |
-0.93 |
-11.15 |
-15.76 |
-23.19 |
|
Total number of observations |
92 |
260 |
654 |
2955 |
13002 |
3160 |
695 |
206 |
67 |
Note. The table shows how different households were moving over the wealth quantiles between 2014 and 2017. 0 means that in 2017 the household remained in the same wealth quantile as it was in 2014. Negative or positive values suggest by how many quantiles households moved up or down in the wealth distribution between 2014 and 2017.
In conclusion, the results highlight the importance of housing and home ownership in the analysis of household balance sheets. However, the analysis of wealth inequality and economic mobility (as a product of movement across the wealth distribution) still leaves some important factors (household composition, other socioeconomic characteristics) untouched. At the same time, the paper highlights the importance of housing and suggests some facts on how housing “helps” families to move across the wealth distribution. According to simple economic and accounting principles, a change in home ownership status should have no impact on net wealth, as only a redistribution between financial and real assets should happen. However, the stylized facts presented earlier suggest that in recent years, housing has generated a higher increase in wealth for homeowners than financial wealth for renters. Historically, low interest rates were one of the reasons for such a situation to happen during the analyzed period. Finally, the recent environment and the changing dynamics of interest rates and financial markets should be carefully monitored as they may change the overall picture. Given the stylized facts and differences in housing markets, more attention should be paid to the availability of housing. It is not only a matter of basic family needs, but also of economic equality and economic mobility in the country.
5. Conclusions
Understanding the evolution of household portfolios is more important than ever. To identify the causes and consequences of the increase in inequality in the distribution of wealth after the 2008 financial crisis and to monitor the economic behavior of households, it is crucial to understand the allocation of assets across asset types or age groups.
Using data from the Household Finance and Consumption Survey (HFCS), some key stylized facts can be derived. First, more than 60 percent of the average European household portfolio is concentrated in real estate. Between 2010 and 2017, the share of real estate in the portfolio fluctuated a little but remained crucial compared to other asset classes. Second, portfolio composition is distributed differently across wealth percentiles. The importance of the private pension account decreases over the wealth distribution, while the share of housing in the total portfolio is U-shaped. The importance of housing in the total portfolio decreases for the poorest two quantiles and for the top 1 per cent of households, while housing remains important for the remaining percentiles in between. The results hold for the whole period between 2010 and 2017.
Thirdly, I also found an uneven development of portfolios by age cohorts. Households in the 45–54 and over-65 age cohorts increased their share of the total pool, while other age cohorts lost their share of the total portfolio in the analyzed years. The household portfolio itself also differs between age cohorts. Around 80 percent of the total portfolio held by households aged 65 and over is concentrated in housing, while the share is falling for all younger cohorts. In line with the lower share in housing, the youngest cohorts increased their portfolio share in business-related wealth to 20–30 percent of the total portfolio. However, the key message remains that the share of housing wealth remains the highest and most important for any group of households in Europe.
Fourth, analyzing the data for the youngest cohorts, I find that their behavior changed after the 2008 financial crisis. In 2010, young people aged between 18 and 25 kept their wealth portfolio diversified across many asset classes. Seven years later, the new generation moved away from financial market-based assets and increased the share of their portfolio in retirement accounts. Furthermore, in 2017, the former youngsters moved to the age cohort of 26 to 32 years and changed the portfolio behavior of the cohort by reducing the share of housing and almost doubling the share of portfolio in business-related wealth.
Finally, I have tried to identify the relationships and trends between home ownership, the share of the portfolio concentrated in housing and wealth inequality in Europe. The home ownership rate divides countries into two groups and shows that housing plays an important role in the group of countries with a high home ownership rate. Conversely, housing is substituted by a higher share of retirement accounts in countries with lower home ownership rates. The results also provide the stylized fact that wealth inequality is lower in high home ownership countries. Additional analysis shows that over the period 2010–2017, home ownership status remains one of the most important factors in explaining wealth inequality between countries. Results suggest that countries with a higher share of portfolio concentrated in housing-related assets tend to have lower wealth inequality. The same idea holds when analyzing changes at the micro level. Over the period analyzed, an increase in the housing share of household portfolios was associated with a decrease in wealth inequality measures. The final piece of stylized facts also captured the movement of households from renters to owners and associated it with their positive chances of moving up in wealth distribution. In other words, the period following the recent financial crisis created an environment in which households that became home owners also moved up in terms of wealth distribution in most cases. The results strongly complement earlier findings by LeBlanc and Schmidt (2017), who found that households in Germany that own their primary residence save more than comparable renters. Therefore, differences in the behavior of renters and owners have implications for aggregate saving as well as for wealth inequality in general.
References
Ampudia, M., Georgarakos, D., Slacalek, J., Tristani, O., Vermeulen, P., & Violante, G. (2018). Monetary policy and household inequality (ECB working paper series).
Arrondel, L., Bartiloro, L., Fessler, P., Lindner, P., Mathä, T. Y., Rampazzi, C., Savignac, F., Schmidt, T., Schürz, M. & Vermeulen, P. (2016). How do households allocate their assets? Stylised facts from the Eurosystem Household Finance and Consumption Survey. International Journal of Central Banking.
Atkinson, A. B., &. Bourguignon, F. (2014). Handbook of Income Distribution, vol. 2, Elsevier.
Bach, L., Calvet, L. E., & Sodini, P. (2016). Rich Pickings? Risk, Return, and Skill in the Portfolios of the Wealthy (CEPR Discussion Paper).
Benmelech, E., Meisenzahl, R. R., & Ramcharan, R. (2017). The Real Effects of Liquidity During the Financial Crisis: Evidence from Automobiles The Quarterly Journal of Economics, 132(1), 317–365.
Bricker, J., Moore, K. B., & Thompson, J. (2019). Trends in Household Portfolio Composition. In Handbook of US Consumer Economics (pp. 53–96). Elsevier.
Bricker, J., Volz, A. H. (2020). Wealth concentration levels and growth: 1989–2016 (FEDS Notes). Board of Governors of the Federal Reserve System (US). https://doi.org/10.17016/2380-7172.2438
Cagetti, M. (2003). Wealth Accumulation Over the Life Cycle and Precautionary Savings. Journal of Business & Economic Statistics, 21(3), 339–353.
Dynan, K. E., Skinner, J., & Zeldes, S. P. (2002). The Importance of Bequests and Life-Cycle Saving in Capital Accumulation: A New Answer. American Economic Review, 92(2), 274–278.
Fleck, J., & Monninger, A. (2020). Culture and Portfolios: Trust, Precautionary Savings and Home Ownership (ECB Working Paper No. 20202457). Available at http://dx.doi.org/10.2139/ssrn.3676330
Garbinti, B., Goupille-Lebret, J., & Piketty, T. (2017). Accounting for Wealth Inequality Dynamics: Methods, Estimates and Simulations for France (1800–2014) (Banque de France Working Paper, No. WP 633).
HFCS Network, C. (2013). The Eurosystem Household Finance and Consumption Survey: Results from the First Wave (ECB Statistics Paper Series, 2).
——— (2020). The Household Finance and Consumption Survey: Results from the 2017 wave (ECB Statistics Paper, 36).
Hurst, E., Lusardi, A., Kennickell, A., & Torralba, F. (2010). The Importance of Business Owners in Assessing the Size of Precautionary Savings. The Review of Economics and Statistics, 92(1), 61–69.
Kopczuk, W., & Lupton, J. P. (2007). To Leave or Not to Leave: The Distribution of Bequest Motives. The Review of Economic Studies, 74(1), 207–235.
Kotlikoff, L. J., & Summers, L. H. (1981). The Role of Intergenerational Transfers in Aggregate Capital Accumulation. Journal of Political Economy, 89(4), 706–732.
LeBlanc, J., & Schmidt, T. (2017). Do Homeowners Save More? Evidence From the Panel on Household Finances (PHF). Reviewed Papers.
Lenza, M., & Slacalek, J. (2018). How does Monetary Policy Affect Income and Wealth Inequality? Evidence from Quantitative Easing in the Euro Area (ECB working paper 2190).
Mian, A., Rao,K., & Sufi, A. (2013). Household Balance Sheets, Consumption, and the Economic Slump. The Quarterly Journal of Economics, 128(4), 1687–1726.
Moore, K. B., Pack, S. J., & Sabelhaus, J. (2016). Taxing Income of Top Wealth Holders. National Tax Journal, 69(4), 965–979.
Piketty, T. (2013). Capital in the 21st Century. Cambridge, MA: President and Fellows, Harvard College.
Poterba, J. M., & Samwick, A. A. (2002). Taxation and Household Portfolio Composition: US Evidence from the 1980s and 1990s. Journal of Public Economics, 87, 5–38.
Tiefensee, A., & Grabka, M. (2014). Comparing Wealth-Data Quality of the HFCS (DIW Berlin Discussion Paper No 1427).
Volz, A. H., Jacobs, L., Llanes, E., Moore, K. B., & Thompson, J. P. (2020). Wealth Distribution and Retirement Preparation Among Early Savers (Federal Reserve Bank of Boston Research Department Working Papers No. 20–4). https://doi.org/10.29412/res.wp.2020.04
1 The HFCS captures the entire balance sheet, but in this paper I focus primarily on assets. I use “portfolio” to refer to all types of assets, both financial and non-financial.
2 More details about the sample of countries and other information of HFCS can be found in the following link: https://www.ecb.europa.eu/stats/ecb_surveys/hfcs/html/index.en.html
3 Business-related wealth is constructed from two types of wealth – 1) the value of households’ real estate that is used for self-employed business activities; 2) the value of self-employed business that is not publicly traded.
4 It is important to note that the importance and activity of private pension schemes varies between countries and is strongly influenced by the nature of the public pension systems in those countries. However, the scope of this paper is limited to changes in values and does not address the differences between the public pension systems.