Organizations and Markets in Emerging Economies ISSN 2029-4581 eISSN 2345-0037
2026, vol. 17, no. 1(34), pp. 33–60 DOI: https://doi.org/10.15388/omee.2026.17.2
Determinants of Real Earnings Management: A Case of an Emerging Economy
Farah Naz (corresponding author)
Kinnaird College for Women, Pakistan
farah.naz@kinnaird.edu.pk
Misbah Khan
Kinnaird College for Women, Pakistan
misbahkamalkhan@gmail.com
Abul Hassan
King Faisal University, Saudi Arabia
hassan@kfu.edu.sa
Veera Salman
Kinnaird College for Women, Pakistan
veerasalman242@gmail.com
Abstract. This study aims to determine the firm-specific factors that prompt earnings management within Pakistani manufacturing firms from 2013 to 2020. The proxy measure provided by Roychowdhury (2006a) is used to determine the firm’s value of managing earnings upward or downward using real techniques of earnings management. The results show that the leverage, return on assets, audit quality, dividend payout ratio, market competition, and size significantly drive earnings management. In contrast, the tax and market value of equity did not show signs of influencing this practice. The study also found that both downward and upward earnings management were driven by the same incentives, with an overall trend toward a contradictory relationship. Further, the abnormality denoting downward EM and the abnormality denoting upward EM have been segregated to make the research more conclusive on the trends and determinants of EM. It is suggested that in the future studies covering different sectors or stock markets should be conducted. Additionally, forecasting of EM using big data analysis and machine learning can be explored.
Keywords: real earnings management, earnings management, upward and downward earnings management, firm-specific determinants, the Roychowdhury model
Received: 16/4/2025. Accepted: 12/2/2026
Copyright © 2026 Farah Naz, Misbah Khan, Abul Hassan, Veera Salman. Published by Vilnius University Press. This is an Open Access article distributed under the terms of the Creative Commons Attribution Licence, which permits unrestricted use, distribution, and reproduction in any medium, provided the original author and source are credited.
1. Introduction
Earnings management (EM) has significance in every age of accounting research, especially in the last three decades (Habib et al., 2022), owing to its relevance to corporate governance issues, the adverse effect of earnings manipulations, and the innovative management techniques that business employs from time to time. EM is defined as a purposeful intervention in the formation of financial statements to attain some kind of advantage (Schipper, 1989). Matoussi and Chakib Kolsi (2006) have highlighted EM as one of the primary reasons behind some big financial scandals, such as those of Enron, Tyco, Xerox, WorldCom, Parmalat, and HealthSouth, which were all reduced to the phenomenon of earnings management (Goncharov, 2005). EM is not exactly forgery, as managers use legal accounting measures at their discretion to manipulate earnings. But it is still controversial as it results in providing a misleading image of the value of the company to stakeholders, opposing neutral accounting (Dechow & Skinner, 2000).
Earnings Management (EM) can be divided into Accrual-Based Earnings Management (AEM) and Real Earnings Management. AEM involves altering accounting estimates and judgments, like provisions and depreciation, within the accrual process without changing actual business activities (Dechow & Skinner, 2000; Jones, 1991). On the other hand, REM impacts actual cash flows and operational choices. This includes actions such as overproduction, cutting discretionary expenses, or giving excessive discounts to affect reported earnings (Roychowdhury, 2006a; Zang, 2012). While auditors and regulators can more easily detect AEM, REM is more challenging to spot since it involves genuine business actions (Bui, 2024). As a result, REM raises growing concerns for stakeholders and regulators.
Post the Sarbanes-Oxley Act (SOX), high-quality auditors have proven to be effective in eliminating accrual-EM through better corporate governance (Sajjad, 2017). However, real earnings management is still hard to detect (Ibrahim et al., 2023). For the EM practice involving the real techniques, most companies take advantage of the R&D costs, which are subject to uncertainty. In contrast to R&D, Roychowdhury (2006a) provided empirical evidence showing that abnormality in cash flows, production costs, and discretionary expenses is also used for such manipulations, especially in the case of developing countries like Pakistan, where the latter techniques are more aptly employed instead of R&D (Garanina et al., 2016).
Upward EM is practiced when prices in capital markets need to be presented in a certain way to win the investors’ confidence. Multiple researchers, such as Alareeni (2018) and Goncharov (2005) have observed the EM theory from various perspectives. It all sums up to the argument that upward or downward EM is employed by managers to present financial reports in a way that is favorable to the underlying conditions. These conditions are merely at the time of public offerings, when there is a risk of breach of covenants; when the manager intends to gain some regulatory benefit or avoid any losses; or when the manager has some personal interests.
Cohen and Zarowin (2010) and Zang (2012) pointed out that REM strategies do not help the growth and competitive characteristics of firms because of their long-term impact on overproduction, income manipulation, and discretionary cost reduction. Since manipulating real activities leads to adverse economic consequences, understanding how to reduce this opportunistic behavior is a critical issue, especially after the study by Graham et al. (2005). They discovered that REM activities are a common practice. Hence, the present research seeks to study several firm-specific determinants of REM in an emerging economy such as Pakistan.
In his research, Roychowdhury (2006a) suspected that the relationship between institutional ownership and REM is based on the judgment that managers have a significant stake in the business. Therefore, they avoid any unnecessary losses or any adverse image portrayal of the company to the public, especially during the economic downturn, to retain investors. He also signified that the presence of high debt, inventory stocks, and high levels of receivables or growth opportunities may have a strong impact on real activities manipulation. Firms with small profits and positive forecasts were more likely to be involved in managing their earnings. The present study builds on this research and extends it to Pakistan.
In Pakistan, research surrounding EM mostly takes accrual EM as a measure (Kamran & Shah, 2014; Sajjad, 2017). More recently, research concerning AEM and REM was conducted in Pakistan (Siyal et al., 2020). However, the present study differs from the existing studies based on the independent variables. While the previous literature measured the effect of factors related to corporate governance and board structure, the present research aims at several other firm-specific determinants. Furthermore, it purely studies the manufacturing industry instead of the manufacturing and services mix to further disseminate the effect on most of the manufacturing firms.
Regarding the measure for REM, previously, R&D was used as a proxy (Ge & Kim, 2014; Huang et al., 2017; Lazzem & Jilani, 2017; Roychowdhury, 2006a; Zamri et al., 2013). However, it is not an impactful measure in developing countries. To provide a better insight, we used different proxies including abnormal cash flow from operations, abnormal production cost, and abnormal discretionary expenses as a measure of EM. Another contribution of this study includes the segregation of EM into upward and downward EM to make the research more conclusive on the trends and determinants of EM. Section 2 presents the review of the literature, followed by the methodology explained in Section 3. After the results in Section 4, the study is concluded in Section 5.
2. Literature Review
2.1 Upward and Downward Earnings Management
To signal that the firm is less risky, firm managers seek to have smooth earnings, which they achieve either through upward or downward earnings management (Wagener, 2024). Graham et al. (2005) provided evidence that the owners of several firms showed a positive sign of being engaged in upward REM in the form of an alteration in the cash flow from operations to deliver earnings. Roychowdhury (2006a) concluded that an unnecessary inventory increase and any abnormal cash outflow decrease from the operation are associated with upward EM through real techniques. However, a study conducted with Chinese A-Share companies highlighted that when firms commit to improving performance, they tend to inflate their profits. But, such a move is not sustainable, rather resulting in performance reversal (Liu & Liang, 2024).
Gong et al. (2008) investigated the relationship between downward EM and open market repurchase announcements and found evidence for pre-repurchase downward EM in those firms that executed open market repurchases after announcing them. On the other hand, the firms that signaled it but did not repurchase later showed no such behavior. Moreover, as the number of shares increased, the managers deflated their earnings. Furthermore, the downward EM also evidenced an increase with a rise in equity holdings of the CEO in the firms. Geertsema et al. (2020) examined downward EM and found that in the year of CEO change in a firm, the firm is more likely to get involved in downward EM, so progress can be shown in later years. This stems from the managers’ attempt to intentionally reduce earnings in the first year and then manage them upwards later to show a better graphical representation of financial performance. However, the study by Silva et al. (2023) conducted in Brazil noted that this happens only when the company has been profitable.
Recent research continues to show the dual nature of earnings management (EM) strategies. Upward EM through manipulation of real activities is common in firms with high growth expectations, strong competition, and financial constraints (Madhogarhia et al., 2009). Firms may increase discretionary expenses or change production schedules to boost reported earnings. On the other hand, downward EM is often used to manage future expectations or indicate undervaluation, especially before share buybacks or CEO changes (Wells, 2002). Research from emerging markets also shows that downward EM can help with tax reduction or improve future performance projections (Alhadab & Clacher, 2018). Studies indicate a growing shift from accrual-based to real-based EM due to increased regulatory scrutiny (Garg, 2018). These findings highlight the specific contextual and strategic reasons behind both upward and downward EM. They call for more detailed sector and firm-level analyses in emerging economies such as Pakistan.
2.2 Income Smoothing/Principal-Agent Theory
The theoretical insight into the phenomenon of EM was brought by Hepworth (1953). He explained the need for it to eliminate any fluctuations shown on financial reports, as inconsistency raises questions and doubts. Nearly two decades later, (Ross, 1973) proposed the agency theory regarding principal-agent issues. Then, Dye (1988) explained that the need to manipulate earnings arises due to principal-agent problems, and later Stein (1989) integrated game-theoretic tools into EM. Bringing it all under one roof, Ronen (2008) came up with the phenomenon of real income smoothing and described it as a management tool employed to reduce inconsistency in the total value of the firm. It is like smoothing the statistics by eliminating all sharp outturns and deviations, whether trending upwards or downwards. Sweeney (1994) highlighted a trend that if a firm uses income-increasing methods, then it ends up using income-decreasing methods in the later years, linking it to legal contracts requiring earnings within a specific bracket. However, some unconditional informal kinds of self-enforced contracts may also encourage EM. These are usually used to build an image and gain confidence, especially in the case of a stock listing.
2.3 Audit Quality
Although it is expected that high-quality auditors would constrain REM activities to protect their reputational capital, in the case of REM, auditors may have limited capability to detect it. It is because distinguishing between the actual occurrence of costs/adjustments and manipulative techniques is nearly impossible (Choi et al., 2018). Alhadab and Clacher (2018) have provided evidence in their study suggesting that the presence of high-quality auditors (Big N audit firms) fails to constrain all forms of EM. In fact, much of the manipulation takes place in the presence of Big 4 auditors (Awuye, 2022; Chowdhury & Eliwa, 2021). As the evidence contradicts conventional perception, we propose the first hypothesis to address this inconsistency:
H1: Audit quality has a significant impact on real earnings management.
2.4 Leverage
Nigerian research on the relationship between leverage and earnings management practices has shown that higher leverage ratios lead to increased earnings management (Anjana & Balasubramanian, 2017). This is supported by another study that such steps are taken to avoid any reporting loss (Waweru & Riro, 2013). Firms with a high ‘leverage’ ratio have a larger proportion of debt than equity, and they are bound to manipulate earnings by their loan agreements (Indracahya et al., 2017). Cohen and Zarowin (2010) concluded that, as debt covenants mostly require higher earnings and minimal loss, leveraged firms are more likely to show higher earnings through manipulation if needed. At the same time, the managers of highly leveraged firms are more likely to depict that they have lower cash flows from operating activities. This suggests that the firm holds limited idle cash in reserves and actively channels its funds into investments. On the contrary, Alareeni (2018) investigated EM in the Gulf countries; the result showed an insignificant impact of financial leverage on EM. The results differed for Oman, where highly leveraged firms were involved in high levels of EM practices. Since prior research reported contradictory findings, we posit the second hypothesis to understand it from the emerging countries’ perspective:
H2: Leverage has a significant impact on real earnings management.
2.5 Size
A Vietnamese study reported that large-sized firms are more likely to engage in EM, and there exists a positive relationship between the two (Ngo& Le, 2021). According to Jensen and Meckling (2019), bigger firms are more likely to use EM, primarily driven by the prevailing principal-agent issue. Likewise, another study by Degeorge et al. (1999) observed that large firms are more likely to engage in upward EM to avoid any loss. Conversely, Meek et al. (2007) argued that large firms have efficient management and higher internal control, which may lead to reduced information asymmetry. This reduces the probability for large firms to engage in EM. In contrast, Purnama (2017) argues that large firms are more likely to perform EM by reducing their profits to avoid drastic fluctuations or increases in profit. This protects them from paying more taxes, but at the same time, the smaller size of the company may also have an impact on the EM. However, this is with a reverse aim of increasing income so that there is a reflection of better performance. Hence, to address the contradictory findings, we propose the following hypothesis to re-examine the relationship in the case of an emerging country:
H3: Firm size has a significant impact on real earnings management.
2.6 Tax
Based on the positive accounting theory, large companies may attempt to evade taxes, and in the process, they will tend to understate their profits (Beneish, 2001). Badertscher et al. (2009) showed a significant finding in their study that signaled a positive relationship between tax and nominal EM, yet an insignificant relationship with real EM. The reason for this was because tax savings are usually lower than the cost incurred on using real techniques for earning manipulation, and thus, tax does not have any association with real EM. However, another study conducted in non-financial firms of Nigeria found that corporate tax avoidance results in increased REM activities. It is because the managerial desire to reduce corporate tax obligation propels them to report lower taxable incomes, which is referred to as the downward REM (Abubakar et al., 2021). Based on prior literature, we hypothesize the following:
H4: Tax has a significant impact on real earnings management.
2.7 Dividend Payout Ratio
A dividend increase will have a positive effect on stock prices, which translates to a positive effect on profitability (Lo et al., 2017). This is supported by the argument stating that the dividend payout ratio has a significant effect on firm value. Hence, to maintain firm value, it may be that when the dividend is lower, the firm may manipulate earnings upward to avoid any negative signals to the market. Hussain and Akbar (2022) reported that Chinese firms with small dividend-paying status are more involved in earnings management practices than those with large dividend-paying status. Baker et al. (2003) write that managers usually have a targeted dividend payout ratio, which they aim to maintain, and hence do not violate their dividend policy; they may manage earnings. However, this relationship is bi-directional (Ben Salah & Jarboui, 2024). Dilawer (2012) shows that managers believe that dividend decisions convey information to the market. Moreover, the dividend reductions have negative consequences; hence, if there is a reduction in pay, it may lead to an increase in EM. He et al. (2017) illuminate this aspect and state that any change (downfall) in dividend payout signals a negative impact on the market and increased systematic risk. In such a case, increasing earnings becomes important for the company managers to neutralize this effect and show positive growth of the firm through increasing profits. Taking the preceding argument, the hypothesis is:
H5: Dividend payout ratio has a significant impact on real earnings management.
2.8 Competition
Joosten (2012) was of the view that higher industry competition might result in a rise in the cost of using real techniques of EM. Hence, competition serves as a measure by managers to reduce the use of REM, as found in Indonesian firms (Sanusi et al., 2023). An increase in market competition makes firms seek ways to maintain their sustainability by increasing their performance. Higher market competition also leads firms to a higher threat of liquidation. This encourages firms to manipulate their short-term financial performance to acquire external financing and survive in the market (Widuri & Sutanto, 2019). Therefore, we explore the following hypothesis:
H6: Competition has a significant impact on real earnings management.
2.9 Market Value of Equity
Market value of equity is measured as the market value of equity to the book value of equity (Le & Trinh, 2022). Purnama (2017) found empirical support for the Fama–French hypothesis by verifying that investors perceive low market value to book value firm stocks as riskier. The value effect, operationalized as the proportion of market value to the book value of the share, has a greater influence on the EM practices of the firm. In the EM study, it is used as a proxy for the growth opportunities of the firm (Roychowdhury, 2006a). A high-growth firm is more likely to be involved in REM to maintain the stream of earnings and to reduce the intervention of the government (Cohen & Zarowin, 2010; Roychowdhury, 2006a). Based on the literature, the next hypothesis can be formulated as:
H7: Market value of equity has a significant impact on real earnings management.
2.10 Return on Assets
High profitability shows good company prospects, so that investors will respond positively to these signals, prompting an increase in firm value. This is understandable because the company that managed to record increased profits indicates that it has a good performance. This generates a positive sentiment for investors and increases the company’s stock price (ukesti et al., 2021). Increasing stock prices in the market will increase the firm’s value. This is supported by the results of another research (Terpstra & Verbeeten, 2014), which found that profitability ratio, as measured by ROI or ROA, has a significant effect on firm value. Ado et al. (2020) reasoned that profitability may push managers’ desire to employ creative accounting strategies, which is related to the signaling that managers intend to show quality earnings information to the market participants. On the contrary, it is ascertained that a low level of profitability causes management to overstate their earnings to exceed or meet the analyst’s prediction (Iatridis & Kadorinis, 2009). Hence, our final hypothesis aims to address the contradictory findings of the literature by proposing:
H8: ROA has a significant impact on real earnings management.
3. Data and Methodology
The data for this quantitative research, spanning 8 years (2013–2020), captures 221 PSX-listed firms (60% of the total population) from the manufacturing sector. Companies with insufficient data or those that had shut down were excluded. Hence, employing the listwise deletion, the data considered in the study were only for those firms that did not have any missing values. In Pakistan, the manufacturing sector is a key driver of the economy. It contributes nearly 12.7% to the GDP providing employment to about 16.1% of the workforce, thus making it beneficial for the study to be carried out in this sector (Government of Pakistan, 2021). Regressions were run based on Roychowdhury (2006a) for REM, where intercept values in each of the cases, that is, CFO, PROD, and DE, defined abnormal values for respective earnings management components. Since most of the sectors did not have sufficient observations for regression to be run, the manufacturing sector in total was grouped to derive the intercept value. The subsectors of the manufacturing industry differ with respect to their cost structures and capital intensity. While the aggregation smoothed the structural differences, it produced average REM coefficients, causing lower representation of some subsectors. Resultantly, it could lead to the residuals being upward-biased for the firms working in a lower-intensity environment, while the reverse would happen for downward-biased residuals. However, even though it introduces such small biases, it also enables stable estimation of the intercepts.
3.1 Estimation of Abnormal Cash Flow from Operations
 1
1
In Equation 1, the normal CFO has been determined through 1/lagged assets, sales denominated by lagged assets, and the change in sales denominated by lagged assets. This model tries to comprehend the distortions in cash flows from the operations due to manipulation in sales. Normally, cash receipts rise in accordance with a rise in sales. So, the regression of CFO on sales and change in sales will then represent the “normal” cash inflows, where the residuals will show unusual deviations (Roychowdhury, 2006a). Scholars insisted that residuals show sales manipulation, thus confirming it to be a better proxy (Cohen et al., 2008).
3.2 Estimation of Abnormal Discretionary Expenses
 2
2
Linear regression has been used in Equation 2 to derive the intercept term, which denotes ABNDE. The ABNDE reflects upon the increase or decrease in long-run discretionary expenses such as research and development, advertising expenses, and selling and general administrative expenses, which may deflate or inflate earnings (Roychowdhury, 2006a).
3.3 Estimation of Abnormal Production Cost
 3
3
The linear regression is used to derive the proxy for abnormal production in Equation 3. This model was designed to detect manipulations often done by managers in the organization through overproduction. Regressing production costs on sales, current sales growth, and lagged sales growth approximates “normal” cost patterns, while the residual identifies abnormally high or low costs (Roychowdhury, 2006a).
3.4 Upward Earnings Management
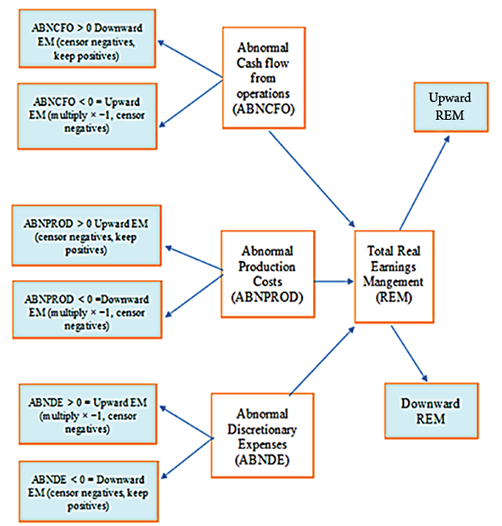
Based on the previous literature, upward EM has been evaluated based on the abnormal increase in production cost, an abnormal decrease in cash flow from operations, and an abnormal decrease in discretionary expenses. It refers to all the manipulative activities that lead to inflating the earnings of a firm. An increase in production cost reduces fixed cost per unit, thereby increasing earnings. All the negative values for abnormal production costs are censored, and the positive ones are assumed to be upward EM. An abnormal decrease in cash flow from operations is assumed to be a result of cash discounts and high credit sales for higher sales revenue, which in turn increases earnings. Thus, an abnormal decrease in CFO is assumed to be a proxy for upward EM, and thus the value is first multiplied by -1, then the negative values are censored as they denote downward EM. An abnormal decrease in discretionary expenses is assumed as a proxy for upward EM. This is because discretionary expenses decrease, then the earnings in return increase. The abnormal discretionary expense is calculated by subtracting normal discretionary expenses from actual discretionary expenses. Here, the normal refers to the estimated or expected discretionary expenses, while the actual reflects the reported amounts in a given period. The increase in the negative value shows an increase in upward EM, thus consistent with Zang (2012). The abnormal value is multiplied by -1, and the negative value thereafter is censored, while only the positive value, which is negative before multiplication by 1, is assumed as upward EM. The total REM is measured as the sum of all the proxies (AbnDE, AbnCFO, and AbnPRO) that are measured for upward EM.
3.5 Downward Earnings Management
Downward EM includes all the activities that are intended to manipulate the earnings in such a manner that the earnings are deflated. Thus, a negative abnormal production cost, a positive abnormal discretionary expense, and abnormal cash flow from the operation are measured as proxies for downward EM. Roychowdhury (2006a) presented the case of upward EM in his REM model; however, it was specified in the study that if anything goes opposite the criterion set for upward EM, then that would portray downward EM.
Consequently, based on that argument, negative production cost may denote that there is an abnormal fall in production, and the fixed cost per unit may rise, leading to higher cost and reduced earnings. A negative value is used as a proxy for downward EM. Thus, the value is multiplied by -1, and thereby the positive value after multiplication is used for the results derivation of downward EM, while all the negative values after multiplication are censored. A positive value for abnormal cash flow from operations is used as a proxy measure for downward EM, and thus, the positive value for AbnCFO (Actual CFO- normal CFO) is used for downward EM, while the negative values are all censored. A positive value for abnormal discretionary expenses is used as a proxy for downward EM. The value derived after subtracting normal DE from actual DE is used, where all negative values are censored, as that denotes upward EM. REM is the overall sum of all the proxy measures (AbnDE, AbnCFO, and AbnDE) used in the study.
Figure 1
Flowchart of Upward and Downward Real Earnings Management through ABNCFO, ABNPROD, and ABNDE
The measurement of all variables is shown in Table 1.
First, regression analysis was conducted, censoring all downward EM values to derive values for upward EM, then the tests were run for each component of REM, and then for REM. Next the upward EM values were censored, and tests were run for each component of downward real EM, and then finally for total REM. To fulfill the need for censoring for ‘downward’ and ‘upward’ EM, a Tobit regression, devised by Tobin (1958), was used. He formulated the Tobit regression, which is used for data that is censored after a certain point and is omitted from the experiment and empirical testing. In the case of the current study, for downward management, all the values depicting upward EM had to be censored, while for upward EM, all the values depicting downward EM had to be censored. Tobit coefficients recognize both the probability of manipulation and its intensity and explicitly incorporate the censoring mechanism in its likelihood function. It estimates the latent earnings management tendency while adhering to the censored nature of the dependent variable (Smith & Brame, 2003).
Table 1
Variables Measurement
|
Variables |
Symbols |
Measurements |
Sources |
|---|---|---|---|
|
Abnormal Cash Flow from Operations |
ABNCFO |
Abnormal Cash Flow from the Operation of firm i in period t / Total Assets of firm i of the preceding year |
(Ge & Kim, 2014; Huang et al., 2017; Lazzem & Jilani, 2017; Roychowdhury, 2006a; Zamri et al., 2013) |
|
Abnormal Production Costs |
ABNPROD |
Abnormal Production Cost of firm i in period t / Total Assets of firm i of preceding year |
(Ge & Kim, 2014; Huang et al., 2017; Lazzem & Jilani, 2017; Roychowdhury, 2006a; Zamri et al., 2013) |
|
Abnormal Discretionary Expenses |
ABNDE |
Abnormal Discretionary Expenses (The sum of Research & Development expenses & SG&A expenses of firm i, in period t / Total assets of firm i of preceding year |
(Ge & Kim, 2014; Huang et al., 2017; Lazzem & Jilani, 2017; Roychowdhury, 2006a; Zamri et al., 2013) |
|
Total Real Earnings Management |
REM |
Sum of Abnormal Discretionary Expenses, Abnormal Production Costs, and Abnormal Cash Flow from Operations |
(Ge & Kim, 2014; Huang et al., 2017; Lazzem & Jilani, 2017; Roychowdhury, 2006a; Zamri et al., 2013) |
|
Size |
Size |
Ln (Total Assets) |
(Alareeni, 2018; Cornett, Marcus, & Tehranian, 2008; Sajjad, 2017; Vo, 2018; Majerová & Pražák, 2020) |
|
Audit |
AUDIT |
Dummy of 1 if audited by PwC, Deloitte Touché Tohmatsu, Ernst & Young, and KPMG, and 0 otherwise |
Kamran & Shah (2014) |
|
Return on assets |
ROA |
EBIT/ Total Assets |
(Cornett et al., 2008; Roychowdhury, 2006a) |
|
Tax incidence |
TAX |
Tax Rate |
(Joosten, 2012) |
|
Dividend payout ratio |
DIVPOR |
Dividend / Net income |
Dilawer (2012) |
|
Leverage |
LEV |
Total Debt / Total Assets |
(Alareeni, 2018; Cohen & Zarowin, 2010). |
|
Competition |
COMP |
Number of firms in the industry |
(Joosten, 2012) |
|
Market value of equity |
GROWTH |
Market Value of Equity / Book Value of Equity |
(Le & Trinh, 2022; Roychowdhury, 2006b) |
Given the possibility that firm performance (measured by ROA) may be endogenously determined in relation to earnings management (Gibbs et al., 2021), since earnings can be managed with a change of returns, a Wald test of exogeneity was carried out. This was done using lagged ROA as an instrumental variable consistent with prior studies suggests that past firm performance is a valid predictor yet endogenous to current year earnings management (Kalbuana et al., 2021).
Table 2
Wald Test of Exogeneity
|
ABNCFO |
ABNPROD |
ABNDE |
REM |
|
|---|---|---|---|---|
|
Upward EM |
0.4627 |
0.5923 |
0.3873 |
0.7501 |
|
Downward EM |
0.7815 |
0.8210 |
0.7413 |
0.2712 |
In Table 2, the values present the P-value (i.e., prob> chi2) for the Wald test of exogeneity. All p-values for the eight regression runs in this study show a lack of endogeneity. Where p-values are not significant, reject the null-hypothesis of endogeneity, which makes IV Tobit or a similar approach unnecessary for addressing endogeneity. Hence, a standard Tobit model with panel adjustment was used in this study, which provides consistent and efficient estimates for exogeneity.
The model used in the study for finding out the determinants of EM is further mathematically explained in the following equations. It should be noted that the standard errors were not clustered at any level, but were estimated using conventional robust procedures.
 4
4
Variables are represented as follows:
AbnDE = abnormal discretionary expense, SIZE= Size of the Firm, AUDIT= Audit Quality, DIVPOR = Dividend Payout Ratio, ROA= the return on assets, LEV= Leverage, TAX= Tax Burden, COMP= market competition, GROWTH= market value of equity, i= firm i, t= period t, β= beta, e= error.
 5
5
AbnPRO = Abnormal Production
The rest of the variable is explained in Equation 4.
 6
6
AbnCFO = abnormal CFO
The rest of the variables are explained in Equation 4.
 7
7
REM= Real EM
The rest of the equation is explained in Equation 41.
4. Results and Discussion
4.1 Descriptive Statistics
Table 3 shows the descriptive statistics. The abnormal cash flow from operations and abnormal production costs depicts a negative average value, implying aggressive REM practices. In contrast, abnormal discretionary expense shows a positive mean (0.2327), implying that it is used more to manage earnings upwards through real techniques. Furthermore, the statistics of TAX show a rate of 17% and an average profitability of 5%, but they still pay dividends. While competition varies the most in this sector, the average value reflects lower competition. Low mean of AUDIT reflected that most firms were not getting a Quality AUDIT. Lastly, the statistics for leverage showed that most of the firms, on average, are highly leveraged.
Table 3
Descriptive Statistics
|
Variable |
Obs |
Mean |
Std. Dev. |
Min |
Max |
|---|---|---|---|---|---|
|
ABNCFO |
1583 |
-.0025 |
.2649 |
-8.3435 |
2.0151 |
|
ABNPROD |
1583 |
-.0107 |
.4557 |
-1.4951 |
7.2575 |
|
ABNDE |
1583 |
.2327 |
.1442 |
-1.8927 |
2.8896 |
|
REM |
1583 |
.2195 |
.5401 |
-5.5953 |
7.6595 |
|
TAX |
1582 |
.1708 |
.8523 |
-9.6016 |
10.3459 |
|
ROA |
1552 |
.0574 |
.1958 |
-5.5574 |
1.2323 |
|
SIZE |
1553 |
15.1505 |
1.5832 |
10.3711 |
19.1918 |
|
DIVPOR |
1583 |
1.2191 |
2.6889 |
-6.3973 |
28.4815 |
|
GROWTH |
1332 |
6.2393 |
.7323 |
3.9006 |
7.94 |
|
COMP |
1583 |
23.6456 |
17.1341 |
1 |
50 |
|
AUDIT |
1583 |
.3557 |
.4789 |
0 |
1 |
|
LEV |
1554 |
.7190 |
.8848 |
-9.4732 |
16.5451 |
Note. The above table shows the descriptive statistics for the variables that have been used in the study. ABNCFO (abnormal cash flow from operation), ABNPROD (abnormal production cost), ABNDE (abnormal discretionary expense), and REM (total real earnings management) are the dependent variables, whereas TAX (tax incidence), ROA (return on asset), SIZE (firm size), DIVPOR (dividend payout ratio), GROWTH (market value of equity denoting firm growth), COMP (market competition), AUDIT (Audit quality), and LEV (Leverage) are the independent variables in this study.
4.2 Multicollinearity
To test the correlation and multicollinearity, a bivariate correlation is carried out, presented in Table 4, which shows the correlation coefficient. If there is a correlation among variables, then they are tested in separate models to avoid any biases in the results (Hammad et al., 2013). The correlation between variables is low; the criteria for assessment have been based on previous studies, which require the correlation coefficient to be within the -0.8 to 0.8 range (Baatour et al., 2017; Gujarati & Porter, 2003). Furthermore, no multicollinearity was observed because none of the coefficients exceeded 0.8.
Table 4
Correlation Matrix
|
Variables |
(1) |
(2) |
(3) |
(4) |
(5) |
(6) |
(7) |
(8) |
(9) |
(10) |
(11) |
(12) |
|---|---|---|---|---|---|---|---|---|---|---|---|---|
|
(1) ABNCFO |
1.000 |
|||||||||||
|
(2) ABNPROD |
-.073** |
1.000 |
||||||||||
|
(3) ABNDE |
.261** |
.082** |
1.000 |
|||||||||
|
(4) REM |
.600** |
.722** |
.449** |
1.000 |
||||||||
|
(5) TAX |
-.009 |
.049* |
-.021 |
.026 |
1.000 |
|||||||
|
(6) ROA |
-.128** |
-.001 |
-.087** |
-.098** |
.059* |
1.000 |
||||||
|
(7) SIZE |
-.144** |
-.044 |
.011 |
-.117** |
.009 |
.187** |
1.000 |
|||||
|
(8) DIVPOR |
-.095** |
-.016 |
-.189** |
-.113** |
-.002 |
.199** |
.127** |
1.000 |
||||
|
(9) GRWOTH |
-.164** |
-.097** |
-.044 |
-.183** |
-.006 |
.252** |
.591** |
0.039 |
1.000 |
|||
|
(10) COMP |
-0.026 |
-0.030 |
-0.026 |
-0.026 |
0.020 |
-0.033 |
-0.150 |
-0.047 |
.132** |
1.000 |
||
|
(11) AUDIT |
-.075** |
-.077** |
-.222** |
-.154** |
.024 |
.214** |
.347** |
.220** |
.310** |
-0.281 |
1.000 |
|
|
(12) LEV |
.037 |
.085** |
.055* |
.098** |
-.067** |
-.060* |
-.132** |
-.109** |
-.161** |
0.028 |
-.159** |
1.000 |
Note. Statistical significance at * p<10%, **p<5%, and ***p<1%.
Variance Inflation Factor (VIF)
The variance inflation factor results in Table 5 show that there are no such multicollinearity issues. Although there exists a higher value for the market value of equity, that is 9.84, and for SIZE, i.e. 8.43, they are still below the cut-off rule of 10 recommended by Gujarati and Porter (2003) and Hair (2009). The mean VIF is also 3.5, which falls between the acceptable ranges. Kutner (2005) suggested an acceptable range below 5, under which not only means VIF, but also all other variables fall. Overall, the model suggests that there is an acceptable degree of multicollinearity and therefore the model is suitable for regression analysis.
Table 5
Variance Inflation Factor (VIF)
|
Variable |
VIF |
1/VIF |
|---|---|---|
|
MVEQU |
9.84 |
0.101635 |
|
SIZE |
8.43 |
0.118603 |
|
REM |
4.04 |
0.247390 |
|
LEV |
3.41 |
0.293126 |
|
ABNPROD |
3.40 |
0.293757 |
|
ROA |
2.74 |
0.365319 |
|
ABNDE |
2.01 |
0.497524 |
|
AUDIT |
1.27 |
0.787669 |
|
comp |
1.23 |
0.812342 |
|
DIVPOR |
1.11 |
0.900715 |
|
TAX |
1.02 |
0.975755 |
|
Mean VIF |
3.50 |
4.3 Empirical Results
Table 6 presents the results showing a significant, positive relationship between tax and upward EM. The reason for this is that when tax increases, firms may manipulate earnings upward to show a higher residual net profit after tax adjustment, so that the value of the firm is not affected by increased taxation. A study by Joosten (2012), however, did not support any kind of significant relationship between tax rate and REM. She reasoned that usually businesses that aim to reduce their tax do it through accrual management techniques since the real management of earnings may have more cost than benefit that comes from tax savings. However, here earnings are being increased, and that certainly may not be to save tax but rather to show higher earnings for a higher value. A study revealed that Chinese listed firms demonstrated significantly higher effective tax rates, which significantly led to upward REM through artificially reducing discretionary expenses (Noronha et al., 2008). Similarly, another study reported that SMEs manipulated real activities to minimize effective taxation under weak disclosure regimes. Where financial incentives were higher for those who reported higher earnings, upward earnings management clearly prevailed over tax aggressiveness. Meanwhile, if there is no such pressure to report higher earnings, the study suggested that SMEs may simultaneously engage in compliant and non-compliant tax avoidance practices to reduce taxes paid (Sánchez‐Ballesta & Yagüe, 2021).
Table 6
Upward Earnings Management Results
|
ABNCFO |
ABNPROD |
ABNDE |
REM |
|
|---|---|---|---|---|
|
(Constant) |
.182101 (0.001 |
-.2646 0.000 |
.087996 0.000 |
.3819* 0.081 |
|
TAX |
.0382* 0.059 |
.0196* 0.032 |
.0113 0.888 |
.01501 0.640 |
|
ROA |
-.9224*** 0.000 |
-.2068*** 0.000 |
-.4887** 0.012 |
-1.221*** 0.000 |
|
SIZE |
-.0639*** 0.003 |
-.0100 0.133 |
-.1080** 0.039 |
-.2098*** 0.000 |
|
DIVPOR |
-.0046 0.140 |
.0004 0.137 |
-.0171*** 0.019 |
-.0151** 0.020 |
|
GROWTH |
.0722 0.106 |
.0378 0.300 |
.3231*** 0.006 |
.4459*** 0.000 |
|
COMP |
.0024*** 0.002 |
.00301*** 0.000 |
.0120*** 0.001 |
.01106*** 0.000 |
|
AUDIT |
.0439* 0.090 |
-.0209 0.931 |
-.2417*** 0.001 |
-.1319*** 0.003 |
|
LEV |
.2205*** 0.001 |
.1458*** 0.000 |
.4885*** 0.000 |
.7988*** 0.000 |
|
Obs |
664/1330 |
817/1330 |
57/1330 |
338/1330 |
|
Pseudo R2 |
0.1250 |
0.1357 |
-0.1186 |
0.1941 |
|
LR chi2(8) |
103.98 |
109.81 |
303.10 |
279.12 |
|
Log Likelihood |
-182.91804 |
-349.66219 |
1429.2178 |
-579.41108 |
Note. The above table shows the regression result for upward earnings management, where ABNCFO, ABNPROD, ABNDE, REM are the dependent variables in columns 3, 4, 5, and 6. The coefficients represent the latent Tobit coefficient corresponding to the variable mentioned in Column 2. The significance has been identified with*, where * depicts significance of above 5% to 10%, ** depicts significance of range above 1% to 5%, and *** depicts significance of less than 1%.
Return on assets shows a significantly negative relationship with all elements of REM and total REM as well. This was supported by an existing study (Simorangkir et al., 2020), where the researchers found that Indonesian firms with strong profitability relied less on REM, since income itself signals performance credibility. At the global level, in the US and European markets, similar patterns were found, where high profitability reduced both accrual and real EM (Sáenz González & García-Meca, 2014). Our study also shows that in countries with weaker investor protection, profitable firms may still manipulate earnings to stabilize reported performance. Thus, while higher profitability discourages REM in Pakistan and similar emerging markets, institutional strength and government efficacy moderate this relationship internationally. The income smoothing theory may suggest this phenomenon since, with higher earnings, a further EM to increase earnings can show spikes in earnings, which may depict uncertainty. Another reason is that higher earnings may already be due to credit sales, hence lower cash flow or low discretionary expense. In such a situation, further reducing and manipulating these variables can then be suspicious in terms of the figures for the firm.
The result has shown that firms with larger sizes reduce ABNDE, ABNPROD, ABNCFO, and REM to manage earnings upwards in general. These results are in line with a study by Meeket al. (2007) that large firms have better management and internal control, which is likely to lessen information asymmetry. Hence, large firms are less likely to engage in EM. DIVPOR shows a significantly negative relationship with REM. This view can be in response to those firms that pay lower dividends and manage income upwards, which can potentially affect firm value. However, conserving cash for growth opportunities, maintaining financial flexibility, or dealing with liquidity issues can serve as other reasons. Hence, such strategic REM is used to offset any potential negative perception by targeting reinvestment avenues to justify earnings retention. More recent studies, such as on the US firms during the years 2000 to 2018, found that firms with lead independent directors managed less REM. The researchers believed that REM was more prominent among firms with less transparency, weak corporate governance as well and high risk. Furthermore, the firms with independent directors tend to increase R&D and capital expenditures, reducing leverage, therefore enhancing firm values. The main reason is that more transparency is ongoing in these organizations, thus making them less engaging towards REM (Hsu et al., 2024). This result corresponds to another study, which suggested that a decrease in dividend payout signals a negative impact on the market and shows increased systematic risk. Hence, to counteract to maintain firm value, the income can be manipulated upwards (Welker et al., 2017). Similarly, another study inspected whether DIVPOR is associated with earnings management. Utilizing a sample of 23,429 corporations from 29 countries, it showed that dividend payers manage earnings less than dividend non-payers, and that this evidence is stronger in countries with weak investor protection policies. This suggests that in markets with weak investor protection, firms with declining DIVPOR manipulated earnings upward to signal stability (He et al., 2017). However, contrasting evidence (Badertscher et al., 2009) highlighted that large firms still resort to REM when under intense analyst forecast pressure. It examined how one type of EM leads to another. The findings revealed that the longer the firm is overvalued, the greater the amount of total earnings management. It suggested that managers usually go for accruals management initially and then move on to real transactions management, to sustain their overvalued equity.
Market value of equity shows a positive relation with ABNDE, which is reflected in the positive relation of GROWTH with REM as well. This can also be because the firms with more growth and better capitalization may, in the year-end, want income to be reflective of their growth and have pressure to push earnings up to maintain capital market value. The discretionary expense mode may have specifically been employed in such occurrences since usually such adjustments are made in the year-end when preparing financial statements, and to manipulate DE in such a short span is easier than PROD or CFO. Research examined the earnings management practices of growth versus value firms. Using a sample of firms, the study found that growth firms tend to manage their earnings upward and downward more aggressively than value firms (Madhogarhia et al., 2009). It should be taken into consideration that these results come about after the extraction of different components of discretionary total accruals as a measure for earnings management. More recently, a study examined the REM practices of growth firms (Nabar & Song, 2017). In contrast to the prior research, our research finds that growth firms are less inclined to engage in REM. The analysis suggests that discretionary expenses will be reduced more when targeting benchmarks. Moreover, the researchers found no evidence that the production costs are low. This might be due to over-anticipation of the future demand since the firm is in its growth phase. These are in line with the conclusion made by Cohen et al. (2008).
Competition has shown a significant positive impact on upward EM. This is probably because, as also stated in a study by Widuri and Sutanto (2019), conditions become competitive for firms in how they increase earnings through manipulative tactics to ensure sustainability and performance relative to competitors. Regarding AUDIT, even though there are firms with a better effect of AUDIT on EM, in our research it can be seen that ABNCFO is positively impacted, while ABNDE is negatively impacted. This result corresponds with prior research, which suggests that as AUDIT increases, use of the discretionary expense alteration technique is reduced, and cash flow manipulation increases, since that cannot be easily attributed to income manipulation (Alhadab & Clacher, 2018).
The leverage of the firm has shown a positive relationship with ABNCFO, ABNPROD, ABNDE, and REM in total, which depicts that highly leveraged firms are pressured into showing higher earnings. Cohen and Zarowin (2010) showed similar results and concluded that leveraged firms are tied with a covenant that requires them to increase earnings and show minimal losses to ensure certainty and security of earnings, a reason that can be applied to Pakistani firms as well.
Table 7
Downward Earnings Management Results
|
ABNCFO |
ABNPROD |
ABNDE |
REM |
|
|---|---|---|---|---|
|
(Constant) |
.182101 0.001 |
-.427043 0.098 |
.087996 0.000 |
.1822295 0.270 |
|
TAX |
.01287* 0.059 |
.05955* 0.032 |
-.000389 0.883 |
.04377* 0.019 |
|
ROA |
-.2913*** 0.000 |
.3590 0.204 |
-.1277*** 0.00 |
-.6805*** 0.000 |
|
SIZE |
-.0314*** 0.003 |
-.0771 0.133 |
-.0095** 0.013 |
-.0724** 0.017 |
|
DIVPOR |
-.0032 0.140 |
.0123 0.137 |
-.0022*** 0.003 |
. 0032 0.572 |
|
GROWTH |
.0375 0.106 |
.1169 0.300 |
.0401*** 0.000 |
0.1257* 0.062 |
|
COMP |
.0007** 0.040 |
.0065*** 0.000 |
.0012*** 0.000 |
.0055*** 0.000 |
|
AUDIT |
-.0036 0.771 |
.0043 0.931 |
-.0246*** 0.000 |
-.0502 0.135 |
|
LEV |
.1120*** 0.000 |
.6541*** 0.000 |
- .0822*** 0.000 |
.4820*** 0.000 |
|
Obs |
666/1330 |
513/1330 |
1273/1330 |
992/1330 |
|
Pseudo R2 |
0.1250 |
0.0313 |
-0.1186 |
0.0686 |
|
LR chi2(8) |
103.98 |
60.04 |
303.10 |
146.48 |
|
Log Likelihood |
-182.91804 |
-929.66806 |
1429.2178 |
-993.99377 |
Note. The above table shows the regression result for downward earnings management, where ABNCFO, ABNPROD, ABNDE, and REM are the dependent variables in columns 3, 4, 5, and 6. The coefficients represent the latent Tobit coefficient corresponding to the variable mentioned in Column 2. The significance has been identified with*, where * depicts significance of above 5% to 10%, ** depicts significance of range above 1% to 5%, and *** depicts significance of less than 1%.
The results in Table 7 show that there is a significant relationship between REM and tax, meaning that as tax increases, downward earnings management also increases. This corresponds to a study (Watts & Zimmerman, 1986), which provided that firms may reduce earnings to evade taxes. However, this result differs from the findings by Joosten (2012), where she suggested that Tax may not affect REM, since REM imposes a greater cost on the firm than the value of tax evasion. Firms used the CFO (credit sales/discount technique) and production cost manipulation techniques. However, reducing production to increase cost does not theoretically make much sense, but increasing credit sales or offering higher sales discounts or showing high discretionary expenses makes more sense when pushing earnings downwards.
ROA has shown a significant negative effect on downward management, where an increase in profitability decreases downward EM, through the technique of the CFO, which can be explained based on the signaling theory. According to this, managers may, at times of higher earnings, want to represent quality earnings and reduce any downward EM; however, signaling theory goes against the income smoothing theory, where it is expected that, in the case of higher earnings, the downward management of earnings increases (Simorangkir et al., 2020). Since income is estimated more at year-end, altering the use of the cash flow technique or the discretionary expense technique at year-end is easier than changing the production plan.
The firm size has shown a significant negative impact on the downward manipulation of earnings through production decrease, which may reaffirm our result for upward EM. It explains that large firms may have the capacity to employ the management of earnings upward through production change. Hence, the larger the firm size, the more they manage income upward instead of downward through the alteration of production units and costs. The same kind of suggestion was derived from a study by Degeorge et al. (1999), who observed that large firms are more likely to engage in upward EM to avoid any loss, and hence, as firm size increases, the downward EM may decrease. One reason for this may also be that large firms may have more efficient systems and may not engage in information asymmetry or may not require much reason to manipulate earnings down; rather, they may want to show higher earnings, which corresponds to their firm size.
The dividend payout ratio has an insignificant impact on downward earnings; however, with ABNDE, it did show a negative relation. Usually, DE is a technique that can be employed at year-end as well. Hence, if a firm pays a good dividend, it may avoid engaging in downward EM because it may want to show better value with better earnings and more dividends paid. The result differs from the dividend policy theory, where earning is pushed down to show a higher dividend ratio (Baker et al., 2003).
Growth depicts a positive relationship with REM (and ABNDE). This means that as the growth increases for a firm, they tend to use more of the DE alteration technique for downward earnings manipulation instead of CFO and PROD. The reason for this may be that firms with high market value have higher capital market pressure and hence feel more pressured to alter income to meet or beat analysts’ earnings forecasts (Myers et al., 2007).
Competition has shown a significantly positive relationship with REM, which means that as competition grows, a downward EM is observed. The theory that supports this has been mentioned by Widuri and Sutanto (2019), who stress the view that competition may lead firms to manipulate their short-term financial performance to avoid any threats to their sustainability. The reason may be to smooth the income trend and build future reserves.
AUDIT has shown a significantly negative relation with ABNDE, which supports previous studies’ view that when AUDIT quality is high, firms may decrease manipulation of DE since it is easily identifiable. Overall, AUDIT shows no strong relation with REM. The results show that higher leveraged firms have a significantly positive relation with downward EM. Audit shows mixed effects, with high audit quality reducing manipulation through discretionary expenses but not fully constraining cash flow related REM. This agrees with Alhadab and Clacher (2018), who reported that U.K. IPO firms with Big 4 auditors reduced accrual EM but still engaged in REM. It examined UK IPOs between 1998 and 2008 and found evidence that high-quality auditors refrain from the use of EM done through the manipulation of discretionary expenses. The study findings revealed that IPO firms audited by high-quality auditors undertake sales-based manipulation to manage earnings upward at the end of the IPO year. Therefore, this implies that the presence of high audit quality is not sufficient to constrain the firms from all forms of earnings management. Another study by Alzoubi (2016) found contradicting results. The sample consisted of eighty-six firms from the Amman Stock Exchange (2007 to 2010). The findings revealed that there is a significantly negative association between audit quality and REM. This was true for firms using the services of independent auditors. Leverage (LEV) shows a significant effect on REM. The reasons for this can be that firms with higher leverage increase cash flow and decrease production to avoid idle cash and are also restricted by covenants, hence forcing the firms to pursue such measures which may reduce earnings but increase cash availability for firms. However, research was carried out on forty-five manufacturing firms in Vietnam during 2017–2019, which gave contradicting results. The firms with specifically high leverage or increasing leverage were chosen, where the findings revealed that firm leverage had a negative effect on REM but a positive and significant influence on accrual-based EM. This implies that LEV change and different levels have differing impacts (Tran, 2022). However, some studies gave supporting evidence to our results. The study by Anagnostopoulou and Tsekrekos (2017) showed that leverage levels are high and lead to higher REM manipulation. The reason given was that firms with high leverage could attract heavy outsider scrutiny, making firms to go under pressure and then use both forms of earnings management to achieve earnings targets. This aligns with Cohen and Zarowin (2010), who reported similar behavior in U.S. firms. Recent evidence from emerging economies like Korea also adheres to the fact that leverage pressures push firms toward REM (Tulcanaza-Prieto et al., 2020). Together, these findings highlight that debt-related incentives for manipulation are consistent across both developed and developing contexts. Overall, the above result has shown significance with REM or parts of REM, hence accepting the hypotheses stated above, where these variables were expected to affect earnings management.
Real earnings management, even if it complies with the accounting standards, is considered unethical from an ethical viewpoint. Earnings manipulation, while sometimes legal, raises serious ethical concerns, particularly due to institutional weaknesses in emerging markets with weaker regulatory enforcement and limited monitoring systems. It can cause distributional harm by misleading minority stakeholders who lack access to governance and information. It can also distort resource allocation, thereby reducing efficiency. All of these together weaken investor confidence. The distinction between legality and ethics is based on fairness, transparency, and accountability to the stakeholders. In these situations, ethical responsibility becomes essential, as companies may take advantage of regulatory gaps, compromising transparency and long-term sustainability (Osma & Guillamón-Saorín, 2011; Sun et al., 2014). As REM serves as an ethical dilemma, especially when the regulatory governance system is still weak, situating it within the ethical-regulatory framework means that its consequences are far beyond mere compliance with the law. Therefore, it calls for an in-depth investigation to understand the intersection of ethical norms and governance rules in shaping such financial reporting behaviors.
5. Conclusion
This study examined the factors influencing downward and upward EM by identifying firms suspected of engaging in real activities manipulation. Additionally, each type of REM measure, including abnormal CFO, abnormal DE, and abnormal PRO, was separated, as done in previous studies. The results indicate that in Pakistan, manufacturing firms are more likely to manipulate earnings upward through real activities when they are highly leveraged, have higher growth, and face greater competition. Firms with high taxes, significant growth, intense competition, and high leverage are more likely to manipulate real activities to lower earnings. Even though these factors are common for both upward and downward EM, segregating the two EM in this research specifically highlighted the direction of manipulation, reflecting the distinct intent behind each strategic move, which is not observable in an aggregate analysis. The coexistence of these scenarios suggests there are diverse reasons for each type of manipulation tactic. In Pakistan, manufacturing firms may look for ways to manipulate earnings either downward or upward. It is also noted that firms with higher returns have less need to manipulate earnings in either direction.
The study has contributed to the existing literature in several ways. It analyzed the incentives for upward and downward EM and distinctly measures each of the proxies measured in terms of CFO, PROD, and DE. Numerous studies have covered Pakistan’s manufacturing sector to measure EM activities. However, this study adds by researching REM and each component’s REM as per the Roychowdhury model (Roychowdhury, 2006b). Furthermore, it attempted to find the relationship between the results of the association of downward and upward EM with firm-specific factors, which fortifies the grounds of the study and the credibility of the results. Moreover, to prove that the results are least biased, several different regressions were run for the overall upward EM, showing similar results, thus further increasing the reliability of the study.
There are several important points that practitioners, policymakers, and academics may want to consider. First, the fact that although the presence of high-quality audit reduces upward EM may be a point of contentment for the auditors, a positive association of the same variable with downward EM highlights that to show higher credibility, firms may artificially reduce earnings. Thus, auditors should also be keen when there is an artificial reduction in earnings. Second, high dividend-paying firms are more likely to manage earnings upwards. Third, large-sized firms or firms with high competition are also more likely to manage earnings. With the above-mentioned significant signals, academics may carry out a more acute study on the factors, while policymakers may redesign policy keeping in view the firm-specific factors that led to EM.
Regulators should set stricter disclosure requirements on operational decisions that affect earnings to reduce REM, particularly in leveraged and high-growth companies. For example, firms should be mandated to report a breakdown of discretionary expenses and also provide managerial explanations regarding year-on-year changes in production costs and discretionary expenses. This way, they can timely detect and limit the abnormal production cost patterns, leading to REM. Audit firms need to improve their ability to detect REM through specialized training. It is suggested that they adopt concrete audit procedures in this regard. They could employ verification/reconciliation procedures to cross-check adjustments in production volume with respect to inventory records. Furthermore, such processes could involve comparing abrupt changes in selling, general, and administrative expenses with internal approvals. Also, policymakers should review dividend and tax policies and create sector-specific guidelines to tackle manipulation in manufacturing firms. Industry benchmarking could also be used to monitor and detect any outlier firm practicing REM. Additionally, regulators can mandate periodic REM scans for high-leverage firms.
Since the scope of this research covered only the manufacturing sector, the authors recommend exploring other sectors, such as the services and financial industries. Moreover, a comparative study of AEM and REM in different stock markets of other countries is also an interesting avenue for future research. It may reveal the reason for a trade-off between the two different bases of EM or would provide insights into the generalizability of such behavior when observed in countries with varying regulatory and institutional environments. At the methodological level, future researchers can consider clustering standard errors to capture any potential within-group correlations, where appropriate. Additionally, we ensure consistency of the coefficients, significance, and theoretical alignment in all models, but future studies can extend the analysis by including supplementary robustness tests, which were not incorporated in this research due to computational constraints. Furthermore, future studies can incorporate sectoral analysis for a deeper insight into which sector is more affected. Finally, EM forecast using big data analysis and machine learning can be explored.
Funding statement
The authors acknowledge the funding of this project from the Deanship of Scientific Research, Vice Presidency for Graduate Studies and Scientific Research, King Faisal University, Saudi Arabia (Grant No.KFU260773)
References
Abubakar, A. H., Mansor, N., & Wan-Mohamad, W. I. A. (2021). Corporate tax avoidance, free cash flow and real earnings management: Evidence from Nigeria. Universal Journal of Accounting and Finance, 9(1), 86–97.
Ado, A. B., Rashid, N., Mustapha, U. A., & Ademola, L. S. (2020). The financial determinants of earnings management and the profitability of listed companies in Nigeria. Journal of Critical Reviews, 7(9), 31–36.
Alareeni, B. (2018). The impact of firm-specific characteristics on earnings management: Evidence from GCC countries. International Journal of Managerial and Financial Accounting, 85–104.
Alhadab, M., & Clacher, I. (2018). The impact of audit quality on real and accrual earnings management around IPOs. The British Accounting Review, 50(4), 442–461.
Alzoubi, E. S. S. (2016). Audit quality and earnings management: Evidence from Jordan. Journal of Applied Accounting Research, 17(2), 170–189.
Anagnostopoulou, S. C., & Tsekrekos, A. E. (2017). The effect of financial leverage on real and accrual-based earnings management. Accounting and Business Research, 47(2), 191–236.
Anjana, C., & Balasubramanian, P. (2017). Determinants of dividend policy: A study of selected listed firms in national stock exchange. International Journal of Applied Business and Economic Research, 15(4), 101–116.
Awuye, I. S. (2022). The impact of audit quality on earnings management: Evidence from France. Journal of Accounting and Taxation, 14, 52–63.
Baatour, K., Othman, H. B., & Hussainey, K. (2017). The effect of multiple directorships on real and accrual-based earnings management: Evidence from Saudi listed firms. Accounting Research Journal, 30(4), 395–412.
Badertscher, B. A., Phillips, J. D., Pincus, M., & Rego, S. O. (2009). Earnings management strategies and the trade‐off between tax benefits and detection risk: To conform or not to conform? The Accounting Review, 84(1), 63–97.
Baker, T., Collins, D., & Reitenga, A. (2003). Stock option compensation and earnings management incentives. Journal of Accounting, Auditing & Finance, 18(4), 557–582.
Ben Salah, O., & Jarboui, A. (2024). The relationship between dividend policy and earnings management: A causality analysis. Journal of Economics, Finance and Administrative Science, 29(57), 166–185.
Beneish, M. D. (2001). Earnings management: A perspective. Managerial Finance, 27(12), 3–17.
Bui, T. H. (2024). Past, present, and future of earnings management research. Cogent Business & Management, 11(1), 2300517.
Choi, A., Choi, J. H., & Sohn, B. C. (2018). The joint effect of audit quality and legal regimes on the use of real earnings management: International evidence. Contemporary Accounting Research, 35(4), 2225–2257.
Chowdhury, S. N., & Eliwa, Y. (2021). The impact of audit quality on real earnings management in the UK context. International Journal of Accounting & Information Management, 29(3), 368–391.
Cohen, D. A., Dey, A., & Lys, T. Z. (2008). Real and accrual‐based earnings management in the pre‐and post‐Sarbanes‐Oxley periods. The Accounting Review, 83(3), 757–787.
Cohen, D. A., & Zarowin, P. (2010). Accrual-based and real earnings management activities around seasoned equity offerings. Journal of Accounting and Economics, 50(1), 2–19.
Cornett, M. M., Marcus, A. J., & Tehranian, H. (2008). Corporate governance and pay-for-performance: The impact of earnings management. Journal of Financial Economics, 87(2), 357–373.
Dechow, P. M., & Skinner, D. J. (2000). Earnings management: Reconciling the views of accounting academics, practitioners, and regulators. Accounting Horizons, 14(2), 235–250.
Degeorge, F., Patel, J., & Zeckhauser, R. (1999). Earnings management to exceed thresholds. The Journal of Business, 72(1), 1–33.
Dilawer, T. (2012). Earning management and dividend policy: Evidence from Pakistani textile industry. International Journal of Academic Research in Business and Social Sciences, 2(10), 362.
Dye, R. A. (1988). Earnings management in an overlapping generations model. Journal of Accounting Research, 26(2) 195–235.
Garanina, T., Nikulin, E., & Frangulantc, O. (2016). Earnings management and R&D costs capitalization: Evidence from Russian and German markets. Investment Management and Financial Innovations (13, Iss. 1 (contin.)), 206–214.
Garg, M. (2018). The effect of internal control certification regulatory changes on real and accrual-based earnings management. European Accounting Review, 27(5), 817–844.
Ge, W., & Kim, J.-B. (2014). Real earnings management and the cost of new corporate bonds. Journal of Business Research, 67(4), 641–647.
Geertsema, P. G., Lont, D. H., & Lu, H. (2020). Real earnings management around CEO turnovers. Accounting & Finance, 60(3), 2397–2426.
Gibbs, R. A., Simcoe, T. S., & Waguespack, D. M. (2021). Does earnings management matter for strategy research? Strategic Management Journal, 1–23.
Goncharov, I. (2005). Earnings management and its determinants: Closing gaps in empirical accounting research. Berlin, Germany: Peter Lang Verlag. Retrieved Nov 11, 2025, from https://www.peterlang.com/document/1100110.
Gong, G., Louis, H., & Sun, A. X. (2008). Earnings management and firm performance following open‐market repurchases. The Journal of Finance, 63(2), 947–986.
Graham, J. R., Harvey, C. R., & Rajgopal, S. (2005). The economic implications of corporate financial reporting. Journal of Accounting and Economics, 40(1–3), 3–73.
Gujarati, D., & Porter, D. (2003). Multicollinearity: What happens if the regressors are correlated. Basic Econometrics, 363.
Habib, A., Ranasinghe, D., Wu, J. Y., Biswas, P. K., & Ahmad, F. (2022). Real earnings management: A review of the international literature. Accounting & Finance, 62(4), 4279–4344.
Hair, J. F. (2009). Multivariate data analysis. Kennesaw.edu. https://digitalcommons.kennesaw.edu/facpubs/2925/
Hammad, S. A., Jusoh, R., & Ghozali, I. (2013). Decentralization, perceived environmental uncertainty, managerial performance and management accounting system information in Egyptian hospitals. International Journal of Accounting and Information Management, 21(4), 314–330.
He, W., Ng, L., Zaiats, N., & Zhang, B. (2017). Dividend policy and earnings management across countries. Journal of Corporate Finance, 42, 267–286.
Hepworth, S. R. (1953). Smoothing periodic income. The Accounting Review, 28(1), 32–39.
Hsu, Y. T., Lee, C. F., Lin, C. Y., & Tang, N. (2024). Lead independent director and earnings management. European Financial Management, 30(1), 3–54.
Huang, S., Roychowdhury, S., & Sletten, E. (2020). Does Litigation Encourage or Deter Real Earnings Management? Accounting Review, 95(3), 251–278.
Hussain, A., & Akbar, M. (2022). Dividend policy and earnings management: Do agency problem and financing constraints matter? Borsa Istanbul Review, 22(5), 839–853.
Iatridis, G., & Kadorinis, G. (2009). Earnings management and firm financial motives: A financial investigation of UK listed firms. International Review of Financial Analysis, 18(4), 164–173.
Ibrahim, G., Mansor, N., Zakariyya, M. R., Ishak, H., Abdulwahab, A. Y. A., & Ahmad, S. S. (2023). External Monitoring Mechanism and Financial Reporting Quality Tunnelling from REM Perspective in Listed non-financial Firms Nigeria. International Journal of Academic Research in Public Policy and Governace, 9(1), 71–83.
Indracahya, E., Faisol, D. A., & Indracahya, E. (2017). The Effect of Good Corporate Governance Elemets, Leverage, Firm Age, Company Size and Profitability On Earning Management. Profita, 10(2), 203–227.
Jensen, M. C., & Meckling, W. H. (2019). Theory of the firm: Managerial behavior, agency costs and ownership structure. In Corporate governance (pp. 77–132). Gower.
Jones, J. J. (1991). Earnings management during import relief investigations. Journal of Accounting Research, 29(2), 193–228.
Joosten, C. (2012). Real earnings management and accrual-based earnings management as substitutes.[Master’s thesis, Department Accountancy Faculty of Economics and Business Studies, Tilburg University, 943685].
Kalbuana, N., Prasetyo, B., Asih, P., Arnas, Y., Simbolon, S. L., Abdusshomad, A., Kurnianto, B., Saputro, R., Sari, M. P., & Zandra, R. A. P. (2021). Earnings management is affected by firm size, leverage and roa: Evidence from Indonesia. Academy of Strategic Management Journal, 20, 1–12.
Kamran, K., & Shah, A. (2014). The impact of corporate governance and ownership structure on earnings management practices: Evidence from listed companies in Pakistan. The Lahore Journal of Economics, 19(2), 27–70.
Kutner, M. H. (2005). Applied linear statistical models.
Lazzem, S., & Jilani, F. (2017). The impact of leverage on accrual-based earnings management: The case of listed French firms. Research in International Business and Finance, 44(1), 350–358.
Le, T. D., & Trinh, T. (2022). Distracted analysts and earnings management. Finance Research Letters, 103038.
Liu, F., & Liang, C. (2024). The moral masking behavior of management after real earnings management: An analysis of management’s integrity commitment. Heliyon, 10(19).
Lo, H.-C., Wu, R.-S., & Kweh, Q. L. (2017). Do institutional investors reinforce or reduce agency problems? Earnings management and the post-IPO performance. International Review of Financial Analysis, 52, 62–76.
Madhogarhia, P., Sutton, N. K., & Kohers, T. (2009). Earnings management practices among growth and value firms. Applied Financial Economics, 19(22), 1767–1778.
Matoussi, H., & Chakib Kolsi, M. (2006). The interaction between accruals management and financial engineering with special purpose entities. Journal of Human Resource Costing & Accounting, 10(2), 72–91.
Meek, G. K., Rao, R. P., & Skousen, C. J. (2007). Evidence on factors affecting the relationship between CEO stock option compensation and earnings management. Review of Accounting and Finance, 6(3), 304–323.
Myers, J. N., Myers, L. A., & Skinner, D. J. (2007). Earnings momentum and earnings management. Journal of Accounting, Auditing & Finance, 22(2), 249–284.
Nabar, S., & Song, X. (2017). Growth firms’ real earnings management practices. Journal of Forensic & Investigative Accounting, 9(1), 606–620.
Ngo, D. N. P., & Le, A. T. H. (2021). Relationship between the audit committee and earning management in listed companies in Vietnam. The Journal of Asian Finance, Economics and Business, 8(2), 135–142.
Noronha, C., Zeng, Y., & Vinten, G. (2008). Earnings management in China: An exploratory study. Managerial Auditing Journal, 23(4), 367–385.
Osma, B. G., & Guillamón-Saorín, E. (2011). Corporate governance and impression management in annual results press releases. Accounting, Organizations and Society, 36(4-5), 187–208.
Government of Pakistan. (2021). Pakistan Economic Survey 2020–21. https://www.finance.gov.pk/survey/chapters_21/PES_2020_21.pdf
Purnama, D. (2017). Pengaruh profitabilitas, leverage, ukuran perusahaan, kepemilikan institusional dan kepemilikan manajerial terhadap manajemen laba. Jurnal riset keuangan dan Akuntansi, 3(1).
Ronen, J. (2008). Earnings management. Springer.
Ross, S. A. (1973). The economic theory of agency: The principal’s problem. The American Economic Review, 63(2), 134–139.
Roychowdhury, S. (2006a). Earnings management through real activities manipulation. Journal of Accounting and Economics, 42(3), 335–370.
Roychowdhury, S. (2006b). Earnings management through real activities manipulation. Journal of Accounting and Economics, 335–370.
Sáenz González, J., & García-Meca, E. (2014). Does corporate governance influence earnings management in Latin American markets? Journal of Business Ethics, 121(3), 419–440.
Sajjad, R. (2017). Impact of Characteristics of Board On Earnings Management of the Firms: Evidence from Pakistan Stock Exchange. [Doctoral dissertation, Capital University].
Sánchez‐Ballesta, J. P., & Yagüe, J. (2021). Financial reporting incentives, earnings management, and tax avoidance in SMEs. Journal of Business Finance & Accounting, 48(7–8), 1404–1433.
Sanusi, F., Januarsi, Y., Purbasari, I., & Akhmadi. (2023). The discipline vs complement role of product market competition and market power: Evidence from real earnings management in an emerging market. Cogent Business & Management, 10(1), 2170072.
Schipper, K. (1989). Earnings management. Accounting Horizons, 3(4), 91.
Silva, R. d., Tardin, N., Monte-Mor, D., Ferreira, T., & Jeldes, F. (2023). Big bath accounting in an emerging market: Evidence from newly appointed CEOs in Brazil. Journal of Technology Management & Innovation, 18(1), 93–103.
Simorangkir, E. N., Sibarani, H. J., Toni, N., Edward, Y. R., Ginting, R. R., Liang, W., & Piter, J. (2020). Effect of Tax Planning, Return on Assets, And Deferred Tax Expenses on Earning Management in Automotive Sub Sector Companies and Components. PalArch’s Journal of Archaeology of Egypt/Egyptology, 17(4).
Siyal, S., Ahmed, W., Musa Kaleem, M., & Wang, L. (2020). Determinants of real earning management: A study in public listed companies in Pakistan Stock Exchange. Journal of Finance & Economics Research, 5(2), 96–111.
Smith, D. A., & Brame, R. (2003). Tobit models in social science research: Some limitations and a more general alternative. Sociological Methods & Research, 31(3), 364–388.
Stein, J. C. (1989). Efficient capital markets, inefficient firms: A model of myopic corporate behavior. The Quarterly Journal of Economics, 104(4), 655–669.
Sukesti, F., Ghozali, I., Fuad, F., Kharis Almasyhari, A., & Nurcahyono, N. (2021). Factors affecting the stock price: The role of firm performance. The Journal of Asian Finance, Economics and Business, 8(2), 165–173.
Sun, J., Lan, G., & Liu, G. (2014). Independent audit committee characteristics and real earnings management. Managerial Auditing Journal, 29(2), 153–172.
Sweeney, A. P. (1994). Debt-covenant violations and managers’ accounting responses. Journal of Accounting and Economics, 17(3), 281–308.
Terpstra, M., & Verbeeten, F. H. (2014). Customer satisfaction: Cost driver or value driver? Empirical evidence from the financial services industry. European Management Journal, 32(3), 499–508.
Tobin, J. (1958). Estimation of relationships for limited dependent variables. Econometrica: Journal of the Econometric Society, 24–36.
Tran, L. T. H. (2022). Reporting quality and financial leverage: Are qualitative characteristics or earnings quality more important? Evidence from an emerging bank-based economy. Research in International Business and Finance, 60, 101578.
Tulcanaza-Prieto, A. B., Lee, Y., & Koo, J.-H. (2020). Effect of leverage on real earnings management: Evidence from Korea. Sustainability, 12(6), 2232.
Wagener, S. (2024). Accounting for the middle: motivations, extent, and limitations of middle managers’ earnings management. Journal of Business Economics, 94(2), 225–277.
Watts, R. L., & Zimmerman, J. L. (1986). Positive accounting theory. Prentice-Hall Inc.
Waweru, N. M., & Riro, G. K. (2013). Corporate governance, firm characteristics and earnings management in an emerging economy. Journal of Applied Management Accounting Research, 11(1), 43.
Welker, M., Ye, K., & Zhang, N. (2017). (Un) intended consequences of a mandatory dividend payout regulation for earnings management: evidence from a natural experiment. Journal of Accounting, Auditing & Finance, 32(4), 510–535.
Wells, P. (2002). Earnings management surrounding CEO changes. Accounting & Finance, 42(2), 169–193.
Widuri, R., & Sutanto, J. E. (2019). Differentiation strategy and market competition as determinants of earnings management. Atlantis Press.
Zamri, N., Rahman, R. A., & Isa, N. S. M. (2013). The impact of leverage on real earnings management. Procedia Economics and Finance, 7, 86–95.
Zang, A. Y. (2012). Evidence on the trade-off between real activities manipulation and accrual-based earnings management. The Accounting Review, 87(2), 675–703.
1 Equations 5,6, and 7 have been run exactly like the regression equation in Equation 4 except for the fact that the dependent variables have been changed and the rest of the independent variables, which are the firm specific factors, are kept the same for same period and firm.