Psichologija ISSN 1392-0359 eISSN 2345-0061
2021, vol. 63, pp. 86–100 DOI: https://doi.org/10.15388/Psichol.2021.29
General Psychosocial Measures are Affected by the Situation Preceding Assessment: The ‘Arbitrary Distinction’ Between State and Trait Measures is Still Unresolved
Attila Szabo
ELTE Eötvös Loránd University, Hungary
szabo.attila@ppk.elte.hu
https://orcid.org/0000-0003-2788-4304
Krisztina Ábel
ELTE Eötvös Loránd University, Hungary
abel.krisztina@ppk.elte.hu
https://orcid.org/0000-0002-7177-6573
Abstract. General psychosocial measures are assumed to be stable over time. However, such measures may be affected by the situation preceding their assessment. In this study, 28 participants completed the WHO-5 Well-Being Index, the Subjective Happiness Scale, and the Life Orientation Test, which are general measures, and the Positive Affect Negative Affect Schedule and the Feeling Scale, which are state measures. Subsequently, the first part of ‘Mega Disasters Nagasaki The Forgotten Bomb’ documentary was presented to the participants. Following the intervention, they completed the same measures again. State measures of negative affect increased, feeling state decreased as expected, but retrospectively measured well-being and the index of optimism also decreased. There were large individual differences. The findings indicate that general measures, assumed to be stable over time, could be influenced by a historical video depicting a disaster. Therefore, there might be a need for reporting and controlling the events preceding their measurement. These results imply that some empirical results, obtained with general or trait measures, may be affected by an event preceding their assessment if that event had an emotional impact.
Keywords: assessment, questionnaire, scale, state, trait
Situacijos poveikis psichosocialinių rodiklių įverčiams: skirtumas tarp būsenos ir bruožo vis dar nėra aiškus
Nors paprastai manoma, kad psichosocialinių rodiklių įverčiai laikui bėgant nekinta, visgi jie gali priklausyti nuo situacinių veiksnių. Šiame straipsnyje pristatomame tyrime dalyvavo 28 asmenys. Jie pildė Bendros gerovės, Subjektyvios laimės, Gyvenimo orientacijos klausimynus, vertinančius bendrą būseną, ir Teigiamo ir neigiamo emocingumo bei Jausmų klausimynus, vertinančius situacinę būseną. Tyrimo dalyviams buvo pateiktas dokumentinis įrašas „Užmiršta Nagasakio bomba“. Peržiūrėję įrašą jie dar kartą pildė minėtus klausimynus. Tyrimo rezultatai atskleidė, kad ne tik padidėjo neigiama emocinė būsena, kaip buvo tikėtasi, bet ir suprastėjo subjektyvios gerovės bei sumažėjo optimizmo vertinimas. Gauti rezultatai rodo, kad bendrų psichosocialinių rodiklių įverčiai nėra stabilūs, bet priklauso nuo situacijos. Todėl tyrimuose reikėtų atsižvelgti į situacinius veiksnius. Priešingu atveju, jei nėra atsižvelgiama į emocinį situacijos poveikį, bendrų psichosocialinių rodiklių įverčiai ir jais grįstos išvados gali būti nevalidžios.
Keywords: vertinimas, klausimynas, skalė, būsena, bruožas
Received: 06/08/2020. Accepted: 02/12/2020
Copyright © 2021 Attila Szabo, Krisztina Ábel. Published by Vilnius University Press. This is an Open Access article distributed under the terms of the Creative Commons Attribution Licence (CC BY), which permits unrestricted use, distribution, and reproduction in any medium, provided the original author and source are credited.
The conceptualization of the subjective well-being and happiness is complex and often too philosophical (Ryff & Singer, 2006). Empirical research, however, needs to be clear and parsimonious. Well-being was defined as the “balance point between an individual’s resource pool and the challenges faced.” (Dodge et al., 2012; p. 230). Given that the “balance point” can change from moment-to-moment this definition regards well-being as a dynamic state. In contrast, well-being is often perceived as a multidimensional construct (Murray et al., 2015), described as “…how people generally feel about their life.” (Fouché & Martindale, 2011, p. 678). The “general feel” aspect of the definition ascribes a persistent or trait view to well-being. Eid and Diener (2004) argued that the situational factors have negligible effects on the general measures, but in experimental research some situational factors could affect findings based on general measures. The emotional impact of such situational factors is crucial in the degree of influence on the general measures.
Subjective happiness is the mirror of one’s well-being as based on Diener (2000), who conceptualized well-being as an index of happiness (Diener, 2000, p. 34.). Happiness can be defined as “the degree to which an individual judges the overall quality of his life favorably.” (Veenhoven, 1991; p. 2). This interpretation is subject to large cultural heterogeneity which impacts the ‘umbrella’ classification (Oishi et al., 2013). Indeed, happiness is closely related to well-being (Medvedev & Landhuis, 2018) to the extent that some authors assess well-being by measuring subjective happiness (i.e., Lin et al., 2010). The close relationship between these constructs begs for the understanding of how a situational change in one variable, or both, could impact the targeted dependent measure in a specific experimental context. Indeed, happiness measures can often reflect responses to situational events (Veenhoven, 1994) despite their general or trait-like view (Stones et al., 1995).
Optimism, defined as the tendency to “believe that good rather than bad things will happen” (Scheier & Carver, 1985, p. 219) is a strong component of happiness (Myers, 1992), as well as well-being (Conversano et al., 2010; Karademas, 2006; Lin et al., 2010; Murray et al., 2015). In the scholastic literature, like in Scheier and Carver’s definition, optimism can be conceptualized as a trait characterizing the person as having mostly positive expectations about the future, but optimism can be situational too (Millstein et al., 2019). Accordingly, the trait view of optimism may be incorrect in certain situations that could have a potential impact on one’s state optimism. Nevertheless, well-being (measured retrospectively), happiness and optimism are most often described as generally persisting subjective characteristics or traits and, therefore, their measurement should remain stable over time (Carver et al., 2010).
While the stability of general and trait measures is often assumed in the psychological literature, an early position paper (Allen & Potkay, 1981) presented convincing argument for situations when the distinction between trait (or general) and state (momentary) measures is arbitrary. An example is when researchers try to change trait measures into state measures by simply changing the instruction with which the trait measure is delivered. Such attempts were made in measuring state optimism by the conversion of the trait optimism scale (Kluemper et al., 2009). But there are also instances when state measures are converted into trait measures by simply changing the instruction for their completion (Lightsey et al., 2012). Allen and Potkav state clearly that “A trait instrument should be unaffected by instructions or other aspects of a psychological study.” (p. 923). Another aspect of the psychological study is the momentary situation (intervention) that should not influence trait measures. Although later Zuckerman (1983) wrote a rebuttal to Allen and Potkav, he also claimed that “Trait test scores before and after an arousing or relaxing treatment show no change, but valid state test scores do change if the treatment is relevant to the state being measured.” (p. 1083). The purpose of the current work is to test this long-held and taken for granted assumption.
General feeling states can also be regarded as the aggregate products of the momentary feeling states. For example, there is difference between an affect and a mood. The Diagnostic and Statistical Manual of mental disorders (DSM-IV; American Psychiatric Association, 2000) defines affects as reflections of behaviors stemming from subjective emotional states and moods as persisting global emotions. As formulated by Manjunatha et al. (2009), a mood might be described as a persisting emotional climate in contrast to affect, which reflects the changing (moment-by-moment) emotional weather (Manjunatha et al., 2009). Accordingly, a mood is a more enduring general or global emotion, while an affect is the momentary valence (positive or negative) of that emotion (Williams & Tappen, 2007), which is largely affected by the situation. Nevertheless, the interdependence between the two (as illustrated by the fact that they are often used interchangeably in the literature; Williams & Tappen, 2007), implies that the affective valence influences mood. For example, repeated events triggering negative affective states will eventually result in negative mood. However, not only the frequency of the affective valence is instrumental in forming one’s mood and subjective well-being, but also its intensity (Diener et al., 1985). Accordingly, a traumatic or an exhilarating event generates strong affect that has an immediate effect on mood, while less intense events shape the person’s mood through their frequency of occurrence.
Most general or global measures in psychology are assumed to reflect persistent or stable psychological constructs. Well-being, happiness, optimism and pessimism are a few examples of constructs assessed with general rather than state measures. Indeed, logically it cannot be expected that, for example, a response to how one felt over the past two weeks (i.e. World Health Orgaization-5 (WHO-5) well-being scale; Bech et al., 2003) can be changed by an event, unless an emotionally-laden situation affects the retrospective appraisal. (This is the reason why we have chosen the WHO-5 as one of the dependent measures here.) However, the subjective feeling state (Hardy & Rejeski, 1989) which reflects the momentary well-being (determined by the affective valence; Diener et al., 1985), can be very sensitive to the situation. Therefore, in the literature it is assumed that global measures yield stable and/or general (trait) results while situation-specific state measures reflect the momentary impact of the event and/or situation. The problem with this assumption is that it disregards the theory of Diener et al. (1985) on the frequency and intensity of an affect. We propose that situations with high impact (intensity) might affect the appraisal of general measures as well. For example, global scores of optimism, pessimism, happiness and well-being could be affected by an intervention that is only expected to influence momentary feeling states assessed through state measures.
Global or general measures are usually not used in repeated measures research designs because they are not expected to change as a result of any intervention. Alternately, they are expected to remain stable over time. This ‘assumption of stability’, to the best knowledge of these authors, has not been challenged in the literature. Based on Diener at al.’s (1985) dual dimensions of affect, we propose that a situation having a presumably high impact (intensity effect) on research participants could alter not only state measures, but also global measures. Testing this conjecture has substantial methodological relevance, apart from testing the early claim made by Zuckerman that general or trait measures should not change as a result of an emotion-laden intervention, because it may challenge the assumption made by many scholars concerning the situational stability of the general or trait measures. In testing our hypothesis that the presentation of a historical documentary will affect the appraisal of general measures, we examined four closely related general measures including happiness well-being, optimism and pessimism, as well as three state measures (mainly as manipulation check to demonstrate that the intervention had indeed an emotional impact) including positive- and negative-affect and momentary feeling state. Well-being was chosen because its assessment is based on the retrospective appraisal of the events in the last two weeks, which under normal circumstances should not change, but the current level of well-being could influence the evaluations of the well-being over the past two weeks. A situation with an emotionally laden component would change the current appraisal of well-being and, consequently, the retrospective appraisal of well-being too. Thus, we hypothesize that a measure intended to gauge ‘general’ well-being could be distorted by the acute effects of a situation. Happiness, optimism, and pessimism were also assessed because of their close relationship to well-being and as trait measures, they also should not change over time under relatively constant circumstances. Then, the purpose of this study was to examine how an emotionally-laden situation might affect these general or trait measures and, hence, to uncover whether research control over the events preceding the assessment of trait measure could be necessary.
Method
Sample Size Calculation
We calculated the required sample size using the G* Power (v. 3.1) software (Faul et al., 2009). Since the design included multiple measures assessed before and after intervention in the same participants, we performed the calculation based on F tests, multivariate analysis of variance (MANOVA), within factors with the following input parameters: medium effect size (f = .25), α error probability = .05, power (1 – β) error probability = .90, number of groups = 1, number of measurements = 7, and a correlation between the repeated measures = .5. This calculation yielded a required sample size = 27, but if we accepted the minimum needed power of 1- β = .80 (Cohen, 1992), the minimum sample size was 23. Therefore, we aimed at recruiting at least 23 participants for the study (the final sample was 28).
Participants
The research was performed in accord with the Declaration of Helsinki – Ethical Principles for Medical Research Involving Human Subjects (World Medical Association, 2018). In total, 28 class attendees of a research methods class at a large urban university qualified for participation. They had the option to participate or only observe (to grasp the learning material) in the study. They were informed that participation is optional, and only those students should take an active part in the research who consent to their participation. However, all 28 class attendees opted to take part in the study. All participants were Hungarians. There were 15 men and 12 women (one person did not disclose her/his gender and age) whose mean age was 20.1 (± SD = 1.2) years. No other personal data was collected from the participants.
Materials
General well-being
Well-being was measured with the psychometrically validated Hungarian version (Susánszky et al., 2006) of the five-item World Health Orgaization-5 (WHO-5 scale; Bech, et al., 2003). The WHO-5 is a very brief instrument gauging emotional well-being, retrospectively, during the past two weeks through items like ‘I have felt calm and relaxed’. The Hungarian version is rated on a 4-point Likert scale ranging from ‘not characteristic at all’ in the preceding two weeks (0), to ‘very much characteristic’ in the past two weeks (3). A higher score reflects greater well-being. The internal reliability of the Hungarian version of the WHO-5 was reported to be adequate (Cronbach’s alpha = .85; Susánszky et al., 2006).
Happiness
The psychometrically validated Hungarian version (Szabo, 2019) of the Subjective Happiness Scale (SHS; Lyubomirsky & Lepper, 1999) was used to assess the subjectively perceived happiness of the participants. The scale has only four items. The first measures perceived happiness in general. The second item assesses subjective happiness relative to friends/peers, while the third determines one’s level of happiness in relation to those who no matter what happens to them enjoy life. Finally, the fourth item measures perceived happiness relative to people who do not seem happy, even though they are not depressed, and cannot fully enjoy life (the rating of this item is reversed). Each item is rated on a 7-point Likert scale ranging. The sum of the four ratings yield a total score for perceived happiness. The internal consistency of the here adopted scale was reported to be adequate (Cronbach’s alpha =.80; Szabo, 2019)
Optimism and pessimism
Optimism and pessimism were measured with the adapted version (Bérdi & Köteles, 2010) of the revised Life Orientation Test (LOT-R; Scheier et al., 1994). The LOT-R has 10 items. Three of the items assess optimism awhile another three items measure pessimism. Four items are only fillers only. A sample item for optimism is: ‘In uncertain times, I usually expect the best’ and a sample item for pessimism is: ‘If something can go wrong for me, it will’. Respondents are asked to indicate the extent to which they agree or disagree with the items on a 5-point Likert scale ranging from ‘strongly agree’ to ‘strongly disagree’. It should be noted that the LOT was initially conceptualized to measure optimism as a unidimensional construct, with optimism and pessimism being bipolar opposites (Scheier & Carver, 1985). However, it was shown that the LOT-R optimism and pessimism reflect two independent constructs (Herzberg et al., 2006). The psychometric properties of the two-dimensional LOT-R are excellent (Herzberg et al., 2006). The internal reliability of the here employed version of the scale ranges between Cronbach’s alpha .77 and .81 (Bérdi & Köteles, 2010).
Positive and negative affect
These measures of the momentary affective states were assessed with the psychometrically validated Hungarian version (Gyollai et al., 2011) of the abbreviated 10-item Positive Affect Negative Affect Schedule (PANAS; Thompson, 2007) scale. A sample item for positive affect is ‘inspired’ and one for negative affect is ‘upset’. Each PANAS item is rated on a 5-point Likert scale ranging from 1 (very slightly or not at all) to 5 (very much) and reflects the momentary feeling. Therefore, participants should indicate the extent to which they experience a specific feeling in the moment of responding. A total score can be obtained for positive (5) and negative (5) items. The internal reliability reported for the here employed Hungarian version of the PANAS is acceptable; Cronbach’s alpha = .73 for positive affect and .65 for negative affect (Gyollai et al., 2011).
Momentary well-being
The Feeling Scale (FS; Hardy & Rejeski, 1989) was used to measure core affect, described as the momentary state of well-being based on Russell’s (2003) work. The FS is a single-item 11-point Likert scale ranging from -5 (feeling very bad) to +5 (feeling very good) that measures the person’s conscious overall feeling state, present as a simple non-reflective feeling, such as feeling good or bad (Russell, 2003).
Documentary video
The historical documentary video, presented after the baseline assessment of the psychological measures, was the ‘Nagasaki: The Forgotten Bomb’ episode of the TV series ‘Seconds from Disaster’, which is a US and UK co-produced documentary television program presented by the National Geographic Network. The video-series examines historical human-created natural disasters in the 20th century. Each episode analyses a specific incident by looking at the possible causes and circumstances that led to the disaster. The ‘Nagasaki: The Forgotten Bomb’ (Seconds from Disaster: The Forgotten Bomb [Full Documentary]; YouTube, 2017) episode lasts 49:30 minutes, but only the first 20 minutes, corresponding to the presentation of the events before and immediately after the bombing, were presented to the participants. The documentary had Hungarian subtitles. This video was chosen because disaster movies have an emotional component that triggers an affective challenge (Nie et al., 2011; Zhihong et al., 2009).
Procedure
Since volunteerism is a significant problem in psychological research, especially when participants are exposed to emotion-laden interventions, we built the current study into the 2019-2020 research methods course offered to first-year sports and leisure sciences students in the Institute of Health Promotion and Sport Sciences at ELTE Eötvös Loránd University in Budapest. The participants had no prior training in psychology. Although the current research was incorporated in the named course’s learning curriculum, ethical approval for conducting the investigation was obtained from the Research Ethics Board of the Faculty of Education and Psychology at ELTE Eötvös Loránd University. The class experiment took place in the morning because the lecture was scheduled for 8.00 a.m. Out of the 54 students enrolled in the course, only 28 attended the class on the study day. After settling in, students received the battery of questionnaires containing the WHO-5, SHS, LOT-R, PANAS, and the FS. They had to indicate their gender and age and a code-name of their choice to maintain anonymity. Subsequently, a student acting as the research assistant collected the questionnaires and started the documentary on a large screen with an audio volume set at 75 dB in the 84 m2 sized classroom. The documentary was played for 20 minutes, and immediately after viewing, participants received the same battery of questionnaires as before the documentary. To help the researchers match the pre- and post-intervention answers, respondents had to indicate again their gender, age, and code-name. The only instruction provided to the participants at this time was to answer the questions as honestly as possible and indicate how they feel at this moment without trying to remember their answers given before the documentary. After all questionnaires were completed, the student research assistant collected them and handed it over to the principal investigatory later.
Data analyses
Given that the Shapiro-Wilks tests revealed that the assumption of normality was violated in half of the dependent measures and, thus, the planned MANOVA could not be performed, we employed the Wilcoxon signed ranked non-parametric test to compare the differences in the dependent measures before and after the presentation of the documentary. Based on Kirk (1990), a sample size of 10 or more is enough to generate enough power for this test. Our sample size was almost three times higher. Indeed, while less robust than parametric data analyses, non-parametric tests are less sensitive to smaller samples and, therefore, might be the most practical for small studies like the current one (Fagerland, 2012). We also performed correlation analyses to determine the concordance between pre-and post-intervention ratings of the state and general questionnaires. While the Pearson product-moment correlation (r) does not require normal distribution, we also calculated the Kendall’s tau (τ) rank correlation coefficients because they are more robust to both extreme observations and nonlinearity (Newson, 2002).
Results
First, all dependent measures were compared between men and women by using independent-samples Mann-Whitney U tests. Two such tests were performed; one for the initial (pre-documentary or baseline) scores and another for the change (difference: pre- to post-documentary) scores. None of these tests turned out to be statistically significant (p > .05). Next, we employed related-samples Wilcoxon signed-rank tests to test the differences between the dependent measures pre- and post-documentary viewing. The null hypothesis could not be rejected in three measures, including positive affect, happiness, and pessimism. However, the median rank of general well-being after watching the documentary was statistically significantly lower than the median rank before the intervention (Z = -2.54, p = .011, effect size [r] = .34). Similarly, in contrast to the baseline, the median ranks were statistically significantly lower after the documentary video in optimism (Z = -2.86, p = .004, r = .38), negative affect (Z = -3.52, p < .001, r = .47), and feeling state (Z = -3.93, p < .001, r = .53). The descriptive statistics are shown in Table 1. The Pearson product-moment (r) and Kendall’s tau (τ) correlations between before- and after-intervention measures were all statistically significant (Table 2), but in full accord with Zuckerman (1983), state measures showed lower pre-, post-intervention concordance.
Table 1. Descriptive statistics of seven dependent measures before and after the documentary video.
|
Measure |
Mean |
Standard |
95% Confidence |
Median |
Effect size (r) |
|
|
Lower |
Upper |
|||||
|
General / trait measures1 |
||||||
|
Well-being before |
9.32 |
2.36 |
8.41 |
10.24 |
9.50 |
|
|
Well-being after |
8.32 |
2.44 |
7.38 |
9.27 |
8.00* |
.34 |
|
Happiness before |
18.79 |
3.83 |
17.30 |
20.27 |
19.00 |
|
|
Happiness after |
18.04 |
3.97 |
16.50 |
19.57 |
18.50 |
.15 |
|
Optimism before |
12.46 |
1.92 |
11.72 |
13.21 |
12.00 |
|
|
Optimism after |
11.57 |
2.41 |
10.64 |
12.51 |
11.50* |
.38 |
|
Pessimism before |
6.75 |
2.68 |
5.71 |
7.79 |
6.50 |
|
|
Pessimism after |
6.50 |
2.27 |
5.62 |
7.38 |
6.50 |
.07 |
|
State measures |
||||||
|
Positive affect before |
16.86 |
3.98 |
15.31 |
18.40 |
18.00 |
|
|
Positive affect after |
16.89 |
4.65 |
15.09 |
18.69 |
16.50 |
.04 |
|
Negative affect before |
7.86 |
3.94 |
6.33 |
9.39 |
6.00 |
|
|
Negative affect after |
10.54 |
4.12 |
8.94 |
12.13 |
9.50* |
.47 |
|
Feeling state before |
2.25 |
2.14 |
1.42 |
3.08 |
2.50 |
|
|
Feeling state after |
0.00 |
2.63 |
-1.02 |
1.02 |
0.00* |
.53 |
NOTE: 1General measures are presumed to be insensitive to situational factors they should be unaffected by an event), while state measures should reflect responses to situational factors. *Statistically significantly different (p < .05) from the baseline (before / above value) as based on related samples Wilcoxon signed ranked test. The effect size r was calculated with the formula “r = Z / sqrt (2N)” (Pallant, 2007, p. 225).
Table 2. Pearson product-moment and Kendall rank correlation coefficients and their level of statistical significance showing the concordance between pre- and post-documentary assessments in the dependent measures.
|
Dependent measures |
n |
Pearson product-moment (r) |
p |
Kendall’s tau (τ) |
p |
|
General / trait measures |
|||||
|
Well-being |
28 |
.71 |
<.001 |
.53 |
<.001 |
|
Happiness |
28 |
.77 |
<.001 |
.63 |
<.001 |
|
Optimism |
28 |
.77 |
<.001 |
.67 |
<.001 |
|
Pessimism |
28 |
.75 |
<.001 |
.59 |
<.001 |
|
State measures |
|||||
|
Positive affect |
28 |
.70 |
<.001 |
.57 |
<.001 |
|
Negative affect |
28 |
.61 |
=.001 |
.35 |
=.017 |
|
Feeling state |
28 |
.46 |
=.012 |
.34 |
=.019 |
Individual Response Profiles
To visualize the individual response profiles that gave rise to intervention-induced statistically significant changes in four out of the seven dependent measures, we calculated the difference scores for these variables by subtracting the post-intervention score from the pre-intervention (or baseline) value. Accordingly, a greater post-intervention score resulted in a negative value, reflecting an increase in the appraisal of the respective psychological measure. In contrast, a positive result indicated that the baseline measure was higher than the post-intervention score and, hence, indicated a decrease in the respective measure. To examine the individual differences in the direction of change attributable to the intervention, we plotted the number of cases exhibiting increase, no change, or decrease in two trait and two state measures that changed statistically significantly from pre- to post-intervention. These profiles are illustrated in Figure 1.
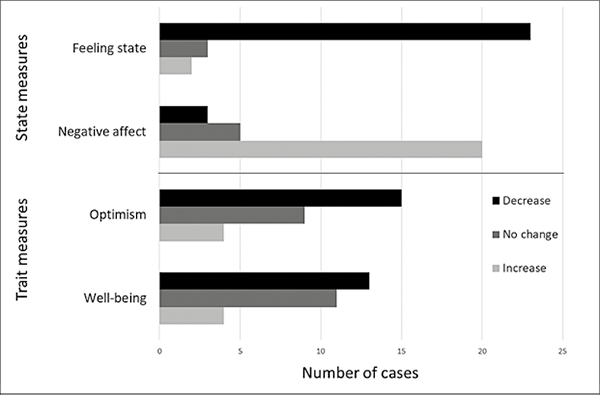
Figure 1. Individual differences in four variables in which statistically significantly changes were observed after the presentation of a traumatic historical documentary video. The upper two measures (feeling state and negative affect) were expected to change since they are state measures, but the lower two measures (well-being and optimism) were supposed to remain stable.
Note: This figure makes no inference to the magnitude of the change; it simply shows the direction in which the scores have changed after the documentary to illustrate the overall tendency of the directional changes in state and trait (or general) measures. Some of these changes may have occurred simply by chance.
Discussion
Our results shed doubt on the situation-independence of trait or global measures. They contradict Zuckerman (1983) who claimed that trait measures should not change due to an intervention having an emotional component, and who appear to support Allen and Potkay (1981), who concluded that there is only an ‘arbitrary distinction’ between state and general measures. They proposed that the presumed stability of the general measures should be empirically determined rather than assumed: “Empirical demonstration of stability should universally replace taking stability for granted.” (p, 926). We performed exactly this work by looking at four general measures and three state measures reflecting well-being. The state measures were needed for manipulation check to establish that the intervention had an emotional impact. These measures supported the emotional component of the documentary by yielding increased negative affect and decreased feeling state. However, positive affect was unaffected probably because of the negative emotional valence (as reflected by the increased negative affect) induced by the presented documentary. It was shown that changes in positive and negative affect are not concomitant. For example, positive affect decreases in infection-induced sickness behavior while the negative affect remains unchanged (Janicki-Deverts et al., 2007). The effect sizes of the changes in negative affect and feeling states in this study suggest that the change in the negative direction was considerable. Thus, the intensity of the impact of the intervention was relatively high. In fact, it was high enough to induce changes in two general or trait measures. The retrospectively measured well-being, in accord with the instruction on the WHO-5: “Please indicate for each of the five statements which is closest to how you have been feeling over the last two weeks.” (emphasis in italics added), should be stable over time as Zuckerman (1983) suggested. However, this general measure decreased both significantly (refer to Table 1) and meaningfully, as reflected by moderate effect sizes (i.e. r = .3 to .5; Cohen, 1992). Further, optimism, assessed here as a trait measure (Scheier & Carver, 1985), also decreased after the intervention. Again, the decrease was not only statistically significant, but it was also substantiated by a moderate effect size reflecting the meaningfulness of the change. In discord with Zuckerman (1983) and the widespread assumption in the literature that results based on general / trait measures are insensitive to situational impact, our findings suggest that at least some of these measures are sensitive to situations having a high (emotional) impact. The low proportion of the shared variance (r2 × 100) between the pre- and post-intervention measures (maximum 59%) also suggests the sensitivity of these measures to the situation (see Table 2). However, these values may also embed measurement errors and other uncontrolled factors.
On one hand, the examination of the individual response profiles (refer to Figure 1) reveals that the state measures reflected the effect of the intervention. Indeed, feeling states, or core affect mirroring the momentary state of well-being (Russell’s, 2003) decreased in parallel with an increase in negative affect in over two thirds of the participants. On the other hand, it was unexpected to observe a decrease in both optimism and retrospective well-being (i.e., how one felt during the past two weeks) in about half of the participants. Further, these two measures that were supposed to be stable also changed in positive direction in both variables in four participants. A positive reaction to traumatic event can be a sort of defense reaction for some individuals (Thompson, 1985), but they are unexpected to surface in trait assessment. The lower part of Figure 1 expands the statistical findings in the current study by showing the large individual differences in responses to trait measures modified by a situation, in this case, viewing a traumatic historical documentary. In line with the state measures (upper part of Figure 1) one would expect trait measures to reflect similar consistency. In other words, while over two-thirds of the state measures changed in the expected direction, at least two-thirds of the trait measures’ responses should have remained stable, which is not the case. These findings depict high (>50%) individual differences in responses to trait (and a smaller one to state) measures and support their instability in certain situations. However, as a note of caution, it should be emphasized that these directional changes do not reflect magnitudes, and some of them may have occurred simply by chance.
Pessimism did not increase despite the large decrease in optimism. This finding may not be surprising, considering that the two are independent constructs (Herzberg et al., 2006). It is possible that the intervention down-tuned the re-appraisal of positive expectations and/or outlook on a segment of life (influenced by the content of the documentary) without affecting the negative expectations of the person. Further, while in this study we gauged optimism with a trait instrument (LOT-R), requesting participants to indicate how they generally feel about future events, this measure may become easily sensitive to situational factors too. Indeed, by simply changing the instructions with which the LOT-R was administered, researchers were able to measures of state optimism (Kluemper et al., 2009). The here disclosed results, and those of Kluemper et al., shed doubt on the presumption that the LOT-R remains stable over time and different situations (Carver et al., 2010) and decades later appear to lend support to the proposed ‘arbitrary distinction’ between state and trait measures (Allen & Potkay, 1981). Consequently, the lesson learned is that when assessing optimism (using the LOT-R) the event(s) preceding its measurement should be taken into consideration because it could have an impact on the responses assumed to reflect a trait, or general, optimism.
Despite the lesser optimism and more negative appraisal of well-being in the previous two weeks, subjective happiness scores were not influenced by the intervention. This result can be explained either by a greater stability of the Subjective Happiness Scale (SHS) or by the perception of happiness being unaffected by the current intervention. It should be noted that participants in the present study were only observers of a tragic event from the past that did not change their positive affect (a state measure) either. Happiness and positive affect are closely connected via medial prefrontal cortex (MPFC) activity, as demonstrated by positron emission tomography (Matsunaga et al., 2011). The current intervention did not affect these variables, nor did it affect pessimism. Our findings agree in part with an earlier work showing that pessimism was not affected by the induction of either positive or negative mood in males, but it increased in response to positive mood-induction and decreased in response to negative mood-induction in females (Lewis et al., 1995). In the present inquiry, no gender differences were observed in any of the measures. The difference between the current and Lewis’s et al.’s study may be attributed either to the type of treatment or participants’ characteristics.
The current study has strengths and limitations. The principal contribution of the study is the finding that general or trait measures assumed to be stable over time (Zuckerman, 1983) may not be stable if measured after an emotionally laden situation, such as the presentation of a documentary of a tragic historical event. The take-home message of these findings is that the assumed stability of some general or trait measures should be reconsidered by controlling the situation preceding their measurement. Accordingly, the ‘arbitrary distinction’ between state and trait measures (Allen & Potkay, 1981) might be considered unresolved. Another strength of the work is that, unlike most psychological studies, it was conducted with non-volunteers.
The current findings’ generalizability is not warranted because the results stem from a young Hungarian university sample. Cultural and age factors could affect research results, and so could the selected intervention. One major limitation of the study is that it did not include a control group watching a neutral video of a similar duration. While such a research design requires a substantially larger sample size, we recommend that future investigations use a ‘between and within-participants’ research design that includes a control group. Affective measures in this group may shed light on whether any situation or only emotion-laden situations affect the research findings and reveal how the experimental time-course influences these measurements. The exclusion of gender, as a between-subjects grouping factor, in the sample size calculation for the intended MANOVA (which would have had required significantly larger sample size) is another shortcoming of this research, even though it became irrelevant after the need of using non-parametric statistics due to the violation of the assumptions of the MANOVA. Finally, the small sample size is also a limitation of this work, but as a note to this limitation, we should emphasize that the effect sizes disclosed here were still moderate and, therefore, meaningful.
Conflict of interest
The authors have no conflict of interest to declare.
References
Allen, B. P., & Potkay, C. R. (1981). On the arbitrary distinction between states and traits. Journal of Personality and Social Psychology, 41(5), 916–928. https://doi.org/10.1037/0022-3514.41.5.916
American Psychiatric Association (2000). Diagnostic and statistical manual of mental disorders (4th ed., Text Revision). Washington, DC: Author
Bech, P., Olsen, L. R., Kjoller, M., & Rasmussen, N. K. (2003). Measuring well-being rather than the absence of distress symptoms: a comparison of the SF-36 Mental Health subscale and the WHO-Five well-being scale. International Journal of Methods in Psychiatric Research, 12(2), 85–91. https://doi.org/10.1002/mpr.145
Bérdi, M. & Köteles, F. (2010). Az optimizmus mérése: az Életszemlélet Teszt átdolgozott változatának (LOT–R) pszichometriai jellemzői hazai mintán. [The measurement of optimism: The psychometric properties of the Hungarian version of the revised Life Orientation Tests (LOT-R). In Hungarian] Magyar Pszichológiai Szemle 65(2), 273-294. https://doi.org/10.1556/mpszle.65.2010.2.7
Carver, C. S., Scheier, M. F., & Segerstrom, S. C. (2010). Optimism. Clinical Psychology Review, 30(7), 879–889. https://doi.org/10.1016/j.cpr.2010.01.006
Cohen, J. (1992). A power primer. Psychological Bulletin, 112(1), 155-199
Conversano, C., Rotondo, A., Lensi, E., Vista, O. D., Arpone, F., & Reda, M. A. (2010). Optimism and Its Impact on Mental and Physical Well-Being. Clinical Practice & Epidemiology in Mental Health, 1(1), 25–29. https://doi.org/10.2174/17450179010060100025
Diener, E. (2000). Subjective well-being: The science of happiness and a proposal for a national index. American Psychologist, 55(1), 34–43. https://doi.org/10.1037/0003-066x.55.1.34
Diener, E., Larsen, R. J., Levine, S., & Emmons, R. A. (1985). Intensity and frequency: Dimensions underlying positive and negative affect. Journal of Personality and Social Psychology, 48(5), 1253–1265. https://doi.org/10.1037/0022-3514.48.5.1253
Dodge, R., Daly, A., Huyton, J., & Sanders, L. (2012). The challenge of defining well-being. International Journal of Wellbeing, 2(3), 222–235. https://doi.org/10.5502/ijw.v2i3.4
Eid, M., & Diener, E. (2004). Global Judgments of Subjective Well-Being: Situational Variability and Long-Term Stability. Social Indicators Research, 65(3), 245–277. https://doi.org/10.1023/b:soci.0000003801.89195.bc
Fagerland, M. W. (2012). t-tests, non-parametric tests, and large studies—a paradox of statistical practice? BMC Medical Research Methodology, 12(1). https://doi.org/10.1186/1471-2288-12-78
Faul, F., Erdfelder, E., Buchner, A., & Lang, A. G. (2009). Statistical power analyses using G*Power 3.1: Tests for correlation and regression analyses. Behavior Research Methods, 41(4), 1149–1160. https://doi.org/10.3758/brm.41.4.1149
Fouché, C., & Martindale, K. (2011). Work–Life Balance: Practitioner Well-Being in the Social Work Education Curriculum. Social Work Education, 30(6), 675–685. https://doi.org/10.1080/02615479.2011.586566
Gyollai, Á., Simor, P., Köteles, F., & Demetrovics, Z. (2011). Psychometric properties of the Hungarian version of the original and the short form of the Positive and Negative Affect Schedule (PANAS). Neuropsychopharmacologia Hungarica, 13(2), 73-79.
Hardy, C. J., & Rejeski, W. J. (1989). Not What, but How One Feels: The Measurement of Affect during Exercise. Journal of Sport and Exercise Psychology, 11(3), 304–317. https://doi.org/10.1123/jsep.11.3.304
Herzberg, P. Y., Glaesmer, H., & Hoyer, J. (2006). Separating optimism and pessimism: A robust psychometric analysis of the Revised Life Orientation Test (LOT-R). Psychological Assessment, 18(4), 433–438. https://doi.org/10.1037/1040-3590.18.4.433
Karademas, E. C. (2006). Self-efficacy, social support and well-being: The mediating role of optimism. Personality and Individual Differences, 40(6), 1281-1290. https://doi.org/10.1016/j.paid.2005.10.019
Kirk, R. E. (1990). Statistics: An introduction (3rd ed.). Fort Worth, TX: Holt, Rinehart & Wins.
Janicki-Deverts, D., Cohen, S., Doyle, W. J., Turner, R. B., & Treanor, J. J. (2007). Infection-induced proinflammatory cytokines are associated with decreases in positive affect, but not increases in negative affect. Brain, Behavior, and Immunity, 21(3), 301–307. https://doi.org/10.1016/j.bbi.2006.09.002
Kluemper, D. H., Little, L. M., & DeGroot, T. (2009). State or trait: effects of state optimism on job-related outcomes. Journal of Organizational Behavior, 30(2), 209–231. https://doi.org/10.1002/job.591
Lewis, L. M., Dember, W. N., Schefft, B. K., & Radenhausen, R. A. (1995). Can experimentally induced mood affect optimism and pessimism scores? Current Psychology, 14(1), 29–41. https://doi.org/10.1007/bf02686871
Lightsey, O. R., Gharibian Gharghani, G., Katz, A. M., McKinney, V. A., & Rarey, E. B. (2012). Positive Automatic Cognitions Mediate the Relationship Between Personality and Trait Positive Affect. Journal of Happiness Studies, 14(1), 115–134. https://doi.org/10.1007/s10902-011-9319-x
Lin, J.-D., Lin, P.-Y., & Wu, C.-L. (2010). Well-being perception of institutional caregivers working for people with disabilities: Use of Subjective Happiness Scale and Satisfaction with Life Scale analyses. Research in Developmental Disabilities, 31(5), 1083–1090. https://doi.org/10.1016/j.ridd.2010.03.009
Lyubomirsky, S., & Lepper, H. S. (1999). A measure of subjective happiness: Preliminary reliability and construct validation. Social Indicators Research, 46(2), 137-155. https://doi.org/10.1023/A:1006824100041
Manjunatha, N., Khess, C. R., & Ram, D. (2009). The conceptualization of terms: ′Mood′ and ′affect′ in academic trainees of mental health. Indian Journal of Psychiatry, 51(4), 285. https://doi.org/10.4103/0019-5545.58295
Matsunaga, M., Murakami, H., Yamakawa, K., Isowa, T., Fukuyama, S., Shinoda, J., … Ohira, H. (2011). Perceived happiness level influences evocation of positive emotions. Natural Science, 03(08), 723–727. https://doi.org/10.4236/ns.2011.38095
Medvedev, O. N., & Landhuis, C. E. (2018). Exploring constructs of well-being, happiness and quality of life. PeerJ, 6, e4903. https://doi.org/10.7717/peerj.4903
Millstein, R. A., Chung, W.-J., Hoeppner, B. B., Boehm, J. K., Legler, S. R., Mastromauro, C. A., & Huffman, J. C. (2019). Development of the State Optimism Measure. General Hospital Psychiatry, 58, 83–93. https://doi.org/10.1016/j.genhosppsych.2019.04.002
Murray, M., Murray, L., & Donnelly, M. (2015). Systematic review protocol of interventions to improve the psychological well-being of general practitioners. Systematic Reviews, 4(1). https://doi.org/10.1186/s13643-015-0098-z
Myers, D. G. (1992). The secrets of happiness. Psychology Today, 25(4), 38-45.
Newson, R. (2002). Parameters behind “nonparametric” statistics: Kendall’s tau, Somers’ D and median differences. The Stata Journal, 2(1), 45-64. https://doi.org/10.1177/1536867x0200200103
Nie, D., Wang, X.-W., Shi, L.-C., & Lu, B.-L. (2011). EEG-based emotion recognition during watching movies. 2011 5th International IEEE/EMBS Conference on Neural Engineering. https://doi.org/10.1109/ner.2011.5910636
Oishi, S., Graham, J., Kesebir, S., & Galinha, I. C. (2013). Concepts of Happiness Across Time and Cultures. Personality and Social Psychology Bulletin, 39(5), 559–577. https://doi.org/10.1177/0146167213480042
Pallant, J. (2007) SPSS Survival Manual: A Step by Step Guide to Data Analysis Using SPSS for Windows. 3rd Edition., New York, NY: McGraw Hill Open University Press.
Pathak, R., & Lata, S. (2018). Optimism in relation to resilience and perceived stress. Journal of Psychosocial Research, 13(2), 359-367. https://doi.org/10.32381/JPR.2018.13.02.10
Ryff, C. D., & Singer, B. H. (2006). Know Thyself and Become What You Are: A Eudaimonic Approach to Psychological Well-Being. Journal of Happiness Studies, 9(1), 13–39. https://doi.org/10.1007/s10902-006-9019-0
Scheier, M. F., & Carver, C. S. (1985). Optimism, coping, and health: Assessment and implications of generalized outcome expectancies. Health Psychology, 4(3), 219–247. https://doi.org/10.1037/0278-6133.4.3.219
Scheier, M. F., Carver, C. S., & Bridges, M. W. (1994). Distinguishing optimism from neuroticism (and trait anxiety, self-mastery, and self-esteem): A reevaluation of the Life Orientation Test. Journal of Personality and Social Psychology, 67(6), 1063–1078. https://doi.org/10.1037/0022-3514.67.6.1063
Seconds from Disaster: The Forgotten Bomb (Full Documentary) (2017). Retrieved March 01, 2020 from YouTube: https://www.youtube.com/watch?v=T-1GOWXw8sE
Stones, M. J., Hadjistavropoulos, T., Tuuko, H., & Kozma, A. (1995). Happiness has traitlike and statelike properties: A reply to Veenhoven. Social Indicators Research, 36(2), 129–144. https://doi.org/10.1007/bf01079722
Susánszky, É., Konkoly Thege, B., Stauder, A., & Kopp, M. (2006). A WHO jól-lét kérdőív rövidített (WBI-5) magyar változatának validálása a Hungarostudy 2002 országos lakossági egészségfelmérés alapján. [Validation of the short (5-item) version of the Well-being Scale based on a Hungarian representative health survey (Hungarostudy 2002); In Hungarian]. Mentálhigiéné és Pszichoszomatika, 7(3), 247–255. https://doi.org/10.1556/mental.7.2006.3.8
Szabo, A. (2019). Validity of the Hungarian version of the Subjective Happiness Scale (SHS-HU). Mentálhigiéné És Pszichoszomatika, 20(2), 180–201. https://doi.org/10.1556/0406.20.2019.010
Thompson, E. R. (2007). Development and Validation of an Internationally Reliable Short-Form of the Positive and Negative Affect Schedule (PANAS). Journal of Cross-Cultural Psychology, 38(2), 227–242. https://doi.org/10.1177/0022022106297301
Thompson, S. C. (1985). Finding Positive Meaning in a Stressful Event and Coping. Basic and Applied Social Psychology, 6(4), 279–295. https://doi.org/10.1207/s15324834basp0604_1
Veenhoven, R. (1991). Is happiness relative?. Social Indicators Research, 24(1), 1-34. https://doi.org/10.1007/BF00292648
Veenhoven, R. (1994). Is happiness a trait? Social Indicators Research, 32(2), 101–160. https://doi.org/10.1007/bf01078732
Williams, C. L., & Tappen, R. M. (2007). Effect of exercise on mood in nursing home residents with Alzheimer’s disease. American Journal of Alzheimer’s Disease & Other Dementias, 22(5), 389-397. https://doi.org/10.1177/1533317507305588
World Medical Association (2018). WMA Declaration of Helsinki – Ethical Principles for Medical Research Involving Human Subjects. Retrieved March 08, 2020 from: https://www.wma.net/policies-post/wma-declaration-of-helsinki-ethical-principles-for-medical-research-involving-human-subjects/
Zhihong Z., Pantic, M., Roisman, G. I., & Huang, T. S. (2009). A Survey of Affect Recognition Methods: Audio, Visual, and Spontaneous Expressions. IEEE Transactions on Pattern Analysis and Machine Intelligence, 31(1), 39–58. https://doi.org/10.1109/tpami.2008.52
Zuckerman, M. (1983). The distinction between trait and state scales is not arbitrary: Comment on Allen and Potkay’s” On the arbitrary distinction between traits and states.”. Journal of Personality and Social Psychology volume 44(4), 1083-1086. https://doi.org/10.1037/0022-3514.44.5.1083